Asymptote Gallery for Category “Examples 2D” #2
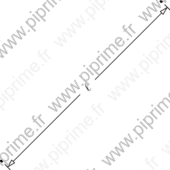
generalities-fig001

Show generalities/fig0010.asy on Github.
Generated with Asymptote 3.00-0.
Categories : Examples 2D | Generalities
Tags : #Basis | #Size
unitsize(2cm);

pair A, B, C, D;
A=(0,0);
B=(2,0);
C=(4,0);
D=(4,2);
draw(A--B);
draw(C--D);
generalities-fig002

Show generalities/fig0020.asy on Github.
Generated with Asymptote 3.00-0.
Categories : Examples 2D | Generalities
Tags : #Basis | #Size
size(5cm,0);
pair A, B, C, D;
A=(0,0);
B=(2,0);
C=(4,0);
D=(4,2);
draw(A--B);
draw(C--D);
generalities-fig003
Show generalities/fig0030.asy on Github.
Generated with Asymptote 3.00-0.
Categories : Examples 2D | Generalities
Tags : #Basis | #Size
size(10cm,0);
pair A, B, C, D;
A=(0,0);
B=(2,0);
C=(4,0);
D=(4,2);
draw(A--B);
draw(C--D);
generalities-fig004

Show generalities/fig0040.asy on Github.
Generated with Asymptote 3.00-0.
Categories : Examples 2D | Generalities
Tags : #Basis | #Size
size(5cm, 3cm);
pair A, B, C, D;
A=(0,0);
B=(2,0);
C=(4,0);
D=(4,2);
draw(A--B);
draw(C--D);
generalities-fig005

Show generalities/fig0050.asy on Github.
Generated with Asymptote 3.00-0.
Categories : Examples 2D | Generalities
Tags : #Basis | #Size
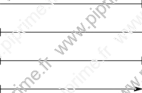
size(10cm,2.5cm);
pair A, B, C, D;
A=(0,0);
B=(2,0);
C=(4,0);
D=(4,2);
draw(A--B);
draw(C--D);
generalities-fig006

Show generalities/fig0060.asy on Github.
Generated with Asymptote 3.00-0.
Categories : Examples 2D | Generalities
Tags : #Basis | #Size
size(10cm, 2.5cm, false);
pair A, B, C, D;
A=(0,0);
B=(2,0);
C=(4,0);
D=(4,2);
draw(A--B);
draw(C--D);
generalities-fig007

Show generalities/fig0070.asy on Github.
Generated with Asymptote 3.00-0.
Categories : Examples 2D | Generalities
Tags : #Basis | #Size
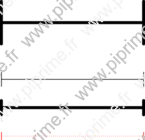
size(3cm, 10cm, false);
pair A, B, C, D;
A=(0,0);
B=(2,0);
C=(4,0);
D=(4,2);
draw(A--B);
draw(C--D);
generalities-fig008

Show generalities/fig0080.asy on Github.
Generated with Asymptote 3.00-0.
Categories : Examples 2D | Generalities
Tags : #Basis | #Size
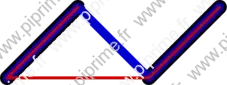
pair A, B, C, D;
A=(0, 0);
B=(3cm, 0);
C=(6cm, 0);
D=(6cm, 4cm);
draw(A--B);
draw(C--D);
generalities-fig009

Show generalities/fig0090.asy on Github.
Generated with Asymptote 3.00-0.
Categories : Examples 2D | Generalities
Tags : #Basis | #Size | #Unitsize
unitsize(1cm);
pair A, B, C, D;
A=(0, 0);
B=(3, 0);
C=(6, 0);
D=(6, 4);
draw(A--B);
draw(C--D);
generalities-fig010

Show generalities/fig0100.asy on Github.
Generated with Asymptote 3.00-0.
Categories : Examples 2D | Generalities
Tags : #Basis | #Size | #Unitsize
unitsize(x=2cm, y=1cm);

pair A, B, C, D;
A=(0, 0);
B=(3, 0);
C=(6, 0);
D=(6, 4);
draw(A--B);
draw(C--D);
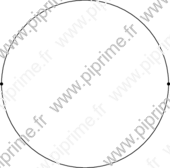
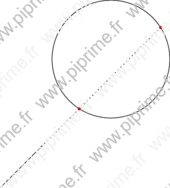
generalities-fig011
Show generalities/fig0110.asy on Github.
Generated with Asymptote 3.00-0.
Categories : Examples 2D | Generalities
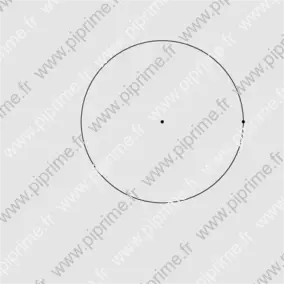
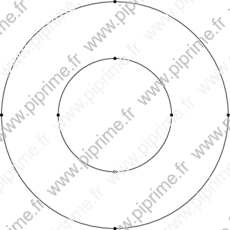
Tags : #Basis | #Circle | #Fixedscaling | #Size
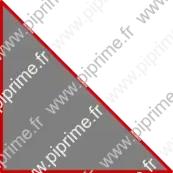
size(10cm,0);

draw(scale(4)*unitcircle);
dot((0, 0));
dot((4, 0));

fixedscaling((-8, -8),(6, 6));
shipout(bbox(Fill(lightgrey)));
generalities-fig012
![]()
Show generalities/fig0120.asy on Github.
Generated with Asymptote 3.00-0.
Categories : Examples 2D | Generalities
Tags : #Basis | #Fixedscaling | #Size | #True size | #Frame | #Deferred drawing
// From Asympote's FAQ
size(10cm,0);

path p=(0,0)--(1,0);

frame object;
draw(object, scale(8cm)*p);

add(object);
add(object, (0, -40));
generalities-fig013

Show generalities/fig0130.asy on Github.
Generated with Asymptote 3.00-0.
Categories : Examples 2D | Generalities
Tags : #Basis | #Fixedscaling | #Deferred drawing | #True size
// From Asympote's FAQ
size(10cm,0);

path p=(0,0)--(1,0);
picture object;
draw(object,scale(8cm)*p);

add(object);
add(object,(0,-40)); // Adds truesize object to currentpicture
generalities-fig014
Show generalities/fig0140.asy on Github.
Generated with Asymptote 3.00-0.
Categories : Examples 2D | Generalities
Tags : #Basis | #Path | #Size
size(6cm,6cm);

pair A=(0,0), B=(1,0), C=(0,1);
draw (A--B--C);
generalities-fig015
Show generalities/fig0150.asy on Github.
Generated with Asymptote 3.00-0.
Categories : Examples 2D | Generalities
Tags : #Basis | #Path | #Size
size(6cm, 6cm);
pair A=(0,0), B=(1,0), C=(0,1);
draw (A--B--C--cycle);
generalities-fig016
Show generalities/fig0160.asy on Github.
Generated with Asymptote 3.00-0.
Categories : Examples 2D | Generalities
Tags : #Basis | #Array | #Path
size(6cm, 6cm);

pair [] A;
A[0]=(-1, -1);
A[1]=( 1, -1);
A[2]=( 1,  1);
A[3]=(-1,  1);
draw (A[0]--A[1]--A[2]--A[3]--cycle);
draw (A[0]--A[2]);
draw (A[1]--A[3]);
generalities-fig017
Show generalities/fig0170.asy on Github.
Generated with Asymptote 3.00-0.
Categories : Examples 2D | Generalities
Tags : #Basis | #Point/Dot | #Path | #Size
size(6cm,6cm);

draw(unitsquare);
dot((0,0)--(1,1)--(0,1)--(1,0));
draw((0,0)--(1,1));
draw((1,0)--(0,1));
generalities-fig018

Show generalities/fig0180.asy on Github.
Generated with Asymptote 3.00-0.
Categories : Examples 2D | Generalities
Tags : #Basis | #Point/Dot | #Path | #Size
size(6cm,3cm,false);

draw(unitsquare);
dot((0,0)--(1,1)--(0,1)--(1,0));
draw((0,0)--(1,1));
draw((1,0)--(0,1));
generalities-fig019
![]()
Show generalities/fig0190.asy on Github.
Generated with Asymptote 3.00-0.
Categories : Examples 2D | Generalities
Tags : #Basis | #Point/Dot | #Line type
size(8cm,0);

pair A,B,C;
A=(0,0);B=(1,0);C=(2,0);
draw(A,8bp+black);
draw(B,8bp+blue);
draw(C,linewidth(8bp));
generalities-fig020

Show generalities/fig0200.asy on Github.
Generated with Asymptote 3.00-0.
Categories : Examples 2D | Generalities
Tags : #Basis | #Point/Dot | #Line type | #Transform/scale/shift/rotate | #Unitsize | #Path
unitsize(3cm);

pair A=(0,0), B=(1,0), C=(0,1);
path trig;
trig=A--B--C--cycle;
draw(trig);
dot(trig,linewidth(4bp));
dot(shift(3,0)*trig,red+4bp);
generalities-fig021

Show generalities/fig0210.asy on Github.
Generated with Asymptote 3.00-0.
Categories : Examples 2D | Generalities
Tags : #Basis | #Path | #Position
size(6cm,6cm);

pair A, B, C;
A=(0,0); B=(1,0); C=(0,1);
draw(A--B--C--cycle);
draw (midpoint(A--B) -- C);
draw (B+0.5*(C-B) -- A);
draw (interp(A,C,0.5) -- B);
generalities-fig022
Show generalities/fig0220.asy on Github.
Generated with Asymptote 3.00-0.
Categories : Examples 2D | Generalities
Tags : #Basis | #Path | #Position
size(6cm,6cm);

pair A, B, C;
A=(0,0); B=(1,0); C=(0,1);
draw(A--B--C--cycle);
draw (midpoint(A--B) -- C);
draw (B+0.5*(C-B) -- A);
draw (interp(A,C,0.5) -- B);
dot(A/3 + B/3 + C/3);
generalities-fig023
Show generalities/fig0230.asy on Github.
Generated with Asymptote 3.00-0.
Categories : Examples 2D | Generalities
Tags : #Basis | #Line type | #Path
size(6cm,0);

pair A=(0,0), B=(1,0), C=(0,1);
draw(A--B--C--cycle);
draw(A--B,linewidth(4bp));
generalities-fig024
Show generalities/fig0240.asy on Github.
Generated with Asymptote 3.00-0.
Categories : Examples 2D | Generalities
Tags : #Basis | #Line type | #Path
size(6cm,0);

pair A=(0,0), B=(1,0), C=(0,1);
draw(A--B--C--cycle);
draw(A--B,(red+green));
generalities-fig025
Show generalities/fig0250.asy on Github.
Generated with Asymptote 3.00-0.
Categories : Examples 2D | Generalities
Tags : #Basis | #Line type | #Path
size(6cm,0);

pair A=(0,0), B=(1,0), C=(0,1);

draw(A--B,.8white+6bp);
draw(A--C,.6white+6bp);
draw(B--C,.4white+6bp);

draw(A--B--C--cycle,yellow);
generalities-fig026
Show generalities/fig0260.asy on Github.
Generated with Asymptote 3.00-0.
Categories : Examples 2D | Generalities
Tags : #Basis | #Line type | #Path
size(8cm,0);

path p1=(0,0)--(1,1);
path p2=(2,0)--(3,1);

draw(p1,linewidth(5mm));
draw(p2,linewidth(5mm));
draw(p1--p2, 3mm+.8blue);
draw(reverse(p1)--p2, 1mm+.8red);
generalities-fig027
![]()
Show generalities/fig0270.asy on Github.
Generated with Asymptote 3.00-0.
Categories : Examples 2D | Generalities
Tags : #Basis | #Point/Dot | #Label | #Position
size(8cm,0);

pair A=(0,0), B=(1,0);

dot("$A$",A,N);
dot("$B$",B,N);
draw(interp(A,B,-.5)--interp(A,B,1.25));
generalities-fig028
Show generalities/fig0280.asy on Github.
Generated with Asymptote 3.00-0.
Categories : Examples 2D | Generalities
Tags : #Basis | #Line type
unitsize(cm);
path line=(0,0)--(6,0);

draw(line,solid);
draw(shift(0,-1)*line,dotted);
draw(shift(0,-2)*line,dashed);
draw(shift(0,-3)*line,longdashed);
draw(shift(0,-4)*line,dashdotted);
draw(shift(0,-5)*line,longdashdotted);
generalities-fig029
Show generalities/fig0290.asy on Github.
Generated with Asymptote 3.00-0.
Categories : Examples 2D | Generalities
Tags : #Basis | #Line type
unitsize(1cm);
path line=(0,0)--(6,0);
pen my_pen=linetype("24 8 8 8");

draw(line,linetype("24 8 8 8"));
draw(shift(0,-1)*line,my_pen+.8red);
draw(shift(0,-2)*line,my_pen+.7green+4bp);
draw(shift(0,-3)*line,linetype("24 8 8 8",false)+.7blue+4bp);
draw(shift(0,-4)*line,linetype("24 8 8 8",true,false)+4bp);
draw(shift(0,-5)*line,linetype("24 8 8 8",false,false)+.5red+blue+4bp);
generalities-fig030
Show generalities/fig0300.asy on Github.
Generated with Asymptote 3.00-0.
Categories : Examples 2D | Generalities
Tags : #Basis | #Arrows/Bars
size(8cm,0);

transform T=shift(0,-0.125);
path g=(0,0)--(1,0);
int i=-1;
draw(T^(++i)*g, Arrows());
draw(T^(++i)*g, 0.8*green, Arrows(SimpleHead));
draw(T^(++i)*g, 0.8*red, Arrows(SimpleHead,size=5mm));

draw(T^(++i)*g, Arrows(HookHead));
draw(T^(++i)*g, 0.8*green, Arrows(HookHead,size=5mm));
draw(T^(++i)*g, 0.8*red, Arrows(HookHead(barb=20),size=5mm));
draw(T^(++i)*g, 2mm+0.8*blue, Arrows(HookHead(dir=60),size=5mm, Fill));

draw(T^(++i)*g, 0.8*yellow, Arrows(HookHead(barb=-10,dir=40),size=5mm));

draw(T^(++i)*g, Arrows(TeXHead));
draw(T^(++i)*g, 0.8*green, Arrows(TeXHead,size=5bp));
draw(T^(++i)*g, 5bp+0.8*red, Arrows(TeXHead));
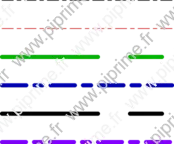
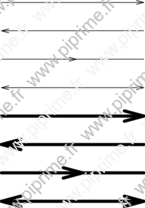
generalities-fig031
Show generalities/fig0310.asy on Github.
Generated with Asymptote 3.00-0.
Categories : Examples 2D | Generalities
Tags : #Basis | #Arrows/Bars
path line=(0,0)--(5cm,0);
draw(line,Arrow);
draw(shift(0,-cm)*line, BeginArrow);
draw(shift(0,-2cm)*line, MidArrow);
draw(shift(0,-3cm)*line, Arrows);

draw(shift(0,-4cm)*line, linewidth(3bp), Arrow(20bp));
draw(shift(0,-5cm)*line, linewidth(3bp), BeginArrow(20bp));
draw(shift(0,-6cm)*line, linewidth(3bp), MidArrow(20bp));
draw(shift(0,-7cm)*line, linewidth(3bp), Arrows(20bp));
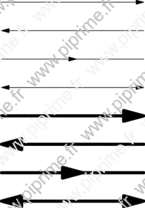
generalities-fig032
Show generalities/fig0320.asy on Github.
Generated with Asymptote 3.00-0.
Categories : Examples 2D | Generalities
Tags : #Basis | #Arrows/Bars
path line=(0,0)--(5cm,0);
DefaultHead=HookHead;
draw(shift(6cm,0)*line,Arrow());
draw(shift(6cm,-cm)*line, BeginArrow());
draw(shift(6cm,-2cm)*line, MidArrow());
draw(shift(6cm,-3cm)*line, Arrows());

draw(shift(6cm,-4cm)*line, linewidth(3bp), Arrow(20bp));
draw(shift(6cm,-5cm)*line, linewidth(3bp), BeginArrow(20bp));
draw(shift(6cm,-6cm)*line, linewidth(3bp), MidArrow(20bp));
draw(shift(6cm,-7cm)*line, linewidth(3bp), Arrows(20bp));
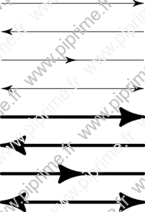
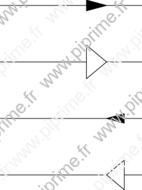
generalities-fig033
Show generalities/fig0330.asy on Github.
Generated with Asymptote 3.00-0.
Categories : Examples 2D | Generalities
Tags : #Basis | #Arrows/Bars
path line=(0,0)--(5cm,0);
DefaultHead=SimpleHead;
draw(shift(6cm,0)*line,Arrow());
draw(shift(6cm,-cm)*line, BeginArrow());
draw(shift(6cm,-2cm)*line, MidArrow());
draw(shift(6cm,-3cm)*line, Arrows());

draw(shift(6cm,-4cm)*line, linewidth(3bp), Arrow(20bp));
draw(shift(6cm,-5cm)*line, linewidth(3bp), BeginArrow(20bp));
draw(shift(6cm,-6cm)*line, linewidth(3bp), MidArrow(20bp));
draw(shift(6cm,-7cm)*line, linewidth(3bp), Arrows(20bp));
generalities-fig034
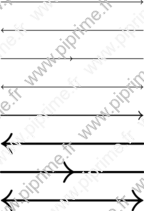
Show generalities/fig0340.asy on Github.
Generated with Asymptote 3.00-0.
Categories : Examples 2D | Generalities
Tags : #Basis | #Arrows/Bars
path line=(0,0)--(5cm,0);
DefaultHead=TeXHead;
draw(shift(6cm,0)*line,Arrow());
draw(shift(6cm,-cm)*line, BeginArrow());
draw(shift(6cm,-2cm)*line, MidArrow());
draw(shift(6cm,-3cm)*line, Arrows());

draw(shift(6cm,-4cm)*line, linewidth(bp), Arrow());
draw(shift(6cm,-5cm)*line, linewidth(2bp), BeginArrow(5bp));
draw(shift(6cm,-6cm)*line, linewidth(2bp), MidArrow(5bp));
draw(shift(6cm,-7cm)*line, linewidth(2bp), Arrows(5bp));
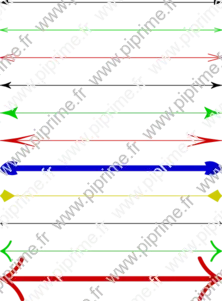
generalities-fig035
Show generalities/fig0350.asy on Github.
Generated with Asymptote 3.00-0.
Categories : Examples 2D | Generalities
Tags : #Basis | #Arrows/Bars
path line=(0,0)..(2.5cm,2.5cm)..(5cm,0);
draw(line,ArcArrow);
draw(shift(0,-2cm)*line,BeginArcArrow);
draw(shift(0,-4cm)*line,MidArcArrow);
draw(shift(0,-6cm)*line,ArcArrows);

draw(shift(6cm,0)*line,3bp+.8red,ArcArrow(20bp));
draw(shift(6cm,-2cm)*line,3bp+.8red,BeginArcArrow(20bp));
draw(shift(6cm,-4cm)*line,3bp+.8red,MidArcArrow(20bp));
draw(shift(6cm,-6cm)*line,3bp+.8red,ArcArrows(20bp));
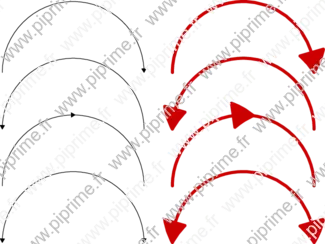
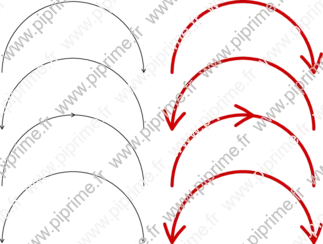
generalities-fig036
Show generalities/fig0360.asy on Github.
Generated with Asymptote 3.00-0.
Categories : Examples 2D | Generalities
Tags : #Basis | #Arrows/Bars
DefaultHead=HookHead;

path line=(0,0)..(2.5cm,2.5cm)..(5cm,0);
draw(line,ArcArrow());
draw(shift(0,-2cm)*line,BeginArcArrow());
draw(shift(0,-4cm)*line,MidArcArrow());
draw(shift(0,-6cm)*line,ArcArrows());

draw(shift(6cm,0)*line,3bp+.8red,ArcArrow(20bp));
draw(shift(6cm,-2cm)*line,3bp+.8red,BeginArcArrow(20bp));
draw(shift(6cm,-4cm)*line,3bp+.8red,MidArcArrow(20bp));
draw(shift(6cm,-6cm)*line,3bp+.8red,ArcArrows(20bp));
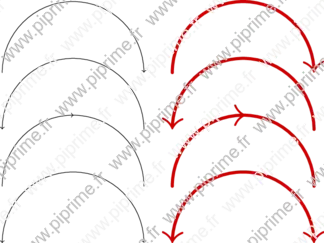
generalities-fig037
Show generalities/fig0370.asy on Github.
Generated with Asymptote 3.00-0.
Categories : Examples 2D | Generalities
Tags : #Basis | #Arrows/Bars
DefaultHead=SimpleHead;

path line=(0,0)..(2.5cm,2.5cm)..(5cm,0);
draw(line,ArcArrow());
draw(shift(0,-2cm)*line,BeginArcArrow());
draw(shift(0,-4cm)*line,MidArcArrow());
draw(shift(0,-6cm)*line,ArcArrows());

draw(shift(6cm,0)*line,3bp+.8red,ArcArrow(20bp));
draw(shift(6cm,-2cm)*line,3bp+.8red,BeginArcArrow(20bp));
draw(shift(6cm,-4cm)*line,3bp+.8red,MidArcArrow(20bp));
draw(shift(6cm,-6cm)*line,3bp+.8red,ArcArrows(20bp));
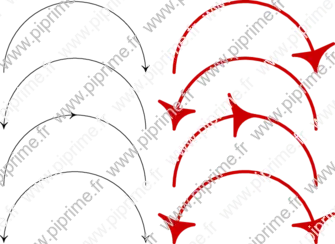
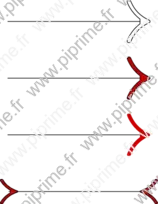
generalities-fig038
Show generalities/fig0380.asy on Github.
Generated with Asymptote 3.00-0.
Categories : Examples 2D | Generalities
Tags : #Basis | #Arrows/Bars
DefaultHead=TeXHead;

path line=(0,0)..(2.5cm,2.5cm)..(5cm,0);
draw(line,Arrow());
draw(shift(0,-2cm)*line,BeginArrow());
draw(shift(0,-4cm)*line,MidArrow());
draw(shift(0,-6cm)*line,Arrows());

draw(shift(6cm,0)*line,3bp+.8red,Arrow(5bp));
draw(shift(6cm,-2cm)*line,3bp+.8red,BeginArrow(5bp));
draw(shift(6cm,-4cm)*line,3bp+.8red,MidArrow(5bp));
draw(shift(6cm,-6cm)*line,3bp+.8red,Arrows(5bp));
generalities-fig039

Show generalities/fig0390.asy on Github.
Generated with Asymptote 3.00-0.
Categories : Examples 2D | Generalities
Tags : #Basis | #Arrows/Bars | #Fill/Unfill
path line=(0,0)--(5cm,0);

draw(line,Arrow(20bp,filltype=NoFill));
draw(shift(0,-cm)*line,Arrow(20bp,filltype=FillDraw(.8red)));
draw(shift(0,-2cm)*line,Arrow(20bp,filltype=Fill(.8red)));
draw(shift(0,-3cm)*line,Arrows(filltype=FillDraw(-10,10,.8red)));
generalities-fig040

Show generalities/fig0400.asy on Github.
Generated with Asymptote 3.00-0.
Categories : Examples 2D | Generalities
Tags : #Basis | #Arrows/Bars | #Fill/Unfill
DefaultHead=HookHead;
path line=(0,0)--(5cm,0);

draw(line,Arrow(20bp,filltype=NoFill));
draw(shift(0,-cm)*line,Arrow(20bp,filltype=FillDraw(.8red)));
draw(shift(0,-2cm)*line,Arrow(20bp,filltype=Fill(.8red)));
draw(shift(0,-3cm)*line,Arrows(filltype=FillDraw(-10,10,.8red)));
generalities-fig041
Show generalities/fig0410.asy on Github.
Generated with Asymptote 3.00-0.
Categories : Examples 2D | Generalities
Tags : #Basis | #Arrows/Bars | #Fill/Unfill
DefaultHead=TeXHead;
path line=(0,0)--(5cm,0);

draw(line,Arrow(10bp,filltype=NoFill));
draw(shift(0,-2cm)*line,Arrow(10bp,filltype=FillDraw(.8red)));
draw(shift(0,-4cm)*line,Arrow(10bp,filltype=Fill(.8red)));
draw(shift(0,-6cm)*line,Arrows(filltype=FillDraw(-10,10,.8red)));
generalities-fig042

Show generalities/fig0420.asy on Github.
Generated with Asymptote 3.00-0.
Categories : Examples 2D | Generalities
Tags : #Basis | #Arrows/Bars
path line=(0,0)--(5cm,0);

draw(line,linewidth(5bp),Arrow);
draw(shift(0,-2cm)*line,linewidth(5bp),Arrow(30bp,10));
draw(shift(0,-5cm)*line,linewidth(30bp),Arrow(20bp,50));
draw(shift(0,-8cm)*line,linewidth(10bp),Arrow(20bp,50,filltype=NoFill));
generalities-fig043
Show generalities/fig0430.asy on Github.
Generated with Asymptote 3.00-0.
Categories : Examples 2D | Generalities
Tags : #Basis | #Arrows/Bars | #Position | #Fill/Unfill
size(5cm,0);
path line=(0,0)--(5,0);

draw(line,Arrow(20bp,position=.75));
draw(shift(0,-2)*line,Arrow(20bp,40,.75,filltype=NoFill));

position pos=BeginPoint;
pos.position=.75;
draw(shift(0,-4)*line,BeginArrow(20bp,pos));
draw(shift(0,-6)*line,BeginArrow(20bp,40,pos,filltype=NoFill));
generalities-fig044
![]()
Show generalities/fig0440.asy on Github.
Generated with Asymptote 3.00-0.
Categories : Examples 2D | Generalities
Tags : #Basis | #Arrows/Bars | #Position
unitsize(8cm);

path g=(0,0)--(1,0);
draw(g,Arrow(Relative(0.45)));
add(arrow(g,Relative(0.55)));
generalities-fig045
![]()
Show generalities/fig0450.asy on Github.
Generated with Asymptote 3.00-0.
Categories : Examples 2D | Generalities
Tags : #Basis | #Arrows/Bars | #Position | #Fill/Unfill
size(8cm,0);

path g = (0,0)--(1,0);
draw(g,Arrow(Relative(0.75)));
add(arrow(reverse(g), invisible, FillDraw(green,red), Relative(0.75)));
generalities-fig046
Show generalities/fig0460.asy on Github.
Generated with Asymptote 3.00-0.
Categories : Examples 2D | Generalities
Tags : #Basis | #Arrows/Bars | #Position
size(5cm,0);
path line=(0,0)--(5,0);
transform T=shift(0,-1);

draw(line, Bar);
draw(T*line, BeginBar);
draw(T^2*line, Bars);
draw(T^3*line, Arrow, BeginBar);
generalities-fig047
Show generalities/fig0470.asy on Github.
Generated with Asymptote 3.00-0.
Categories : Examples 2D | Generalities
Tags : #Basis | #Arrows/Bars | #Line type
path line=(0,0)--(5cm,0);
transform T=shift(0,-cm);

draw(line,linewidth(1mm),Bars);
draw(T^2*line,Bars(5mm));
draw(T^3*line,linewidth(1mm),Bars(5mm));
draw(T^4*line,dotted+red,Bars);
generalities-fig048
Show generalities/fig0480.asy on Github.
Generated with Asymptote 3.00-0.
Categories : Examples 2D | Generalities
Tags : #Basis | #Arrows/Bars
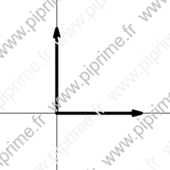
size(6cm,0);

draw((-.5,0)--(1,0));
draw((0,-.5)--(0,1));
draw((0,0)--(.75,0),linewidth(1mm),Arrow(3mm));
draw((0,0)--(0,.75),linewidth(1mm),Arrow(3mm));
generalities-fig049

Show generalities/fig0490.asy on Github.
Generated with Asymptote 3.00-0.
Categories : Examples 2D | Generalities
Tags : #Basis | #Fill/Unfill
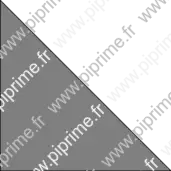
fill((0,0)--(0,6cm)--(6cm,0)--cycle, gray);
generalities-fig050
Show generalities/fig0500.asy on Github.
Generated with Asymptote 3.00-0.
Categories : Examples 2D | Generalities
Tags : #Basis | #Fill/Unfill
filldraw((0,0)--(0,6cm)--(6cm,0)--cycle,gray);
generalities-fig051
Show generalities/fig0510.asy on Github.
Generated with Asymptote 3.00-0.
Categories : Examples 2D | Generalities
Tags : #Basis | #Fill/Unfill
filldraw((0,0)--(0,6cm)--(6cm,0)--cycle, fillpen=gray, drawpen=linewidth(1mm) + 0.8 * red);
generalities-fig052

Show generalities/fig0520.asy on Github.
Generated with Asymptote 3.00-0.
Categories : Examples 2D | Generalities
Tags : #Basis | #Fill/Unfill | #Shading | #Array | #Path
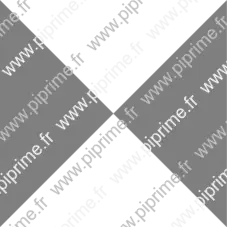
pen[][] p={{rgb(black)}, {rgb(.8red)}};

latticeshade((0,0)--(0,6cm)--(6cm,0)--cycle, p);
generalities-fig053

Show generalities/fig0530.asy on Github.
Generated with Asymptote 3.00-0.
Categories : Examples 2D | Generalities
Tags : #Basis | #Fill/Unfill | #Shading | #Array
pen[][] p={{rgb(black),rgb(black)}, {rgb(red),rgb(green)}};

latticeshade((0,0)--(0,6cm)--(6cm,0)--cycle,p);
generalities-fig054

Show generalities/fig0540.asy on Github.
Generated with Asymptote 3.00-0.
Categories : Examples 2D | Generalities
Tags : #Basis | #Fill/Unfill | #Shading
size(8cm,0);

pen[][] p={{rgb(white),rgb(grey),rgb(black)},
    {red,green,blue},
    {cyan,magenta,yellow}};

latticeshade(unitsquare,p);
generalities-fig055

Show generalities/fig0550.asy on Github.
Generated with Asymptote 3.00-0.
Categories : Examples 2D | Generalities
Tags : #Basis | #Fill/Unfill | #Shading
size(8cm,0);
import palette;

real[][] v={{1,2},{3,4}};
pen[] Palette=Rainbow();

latticeshade(box((0,0),(1,1)),palette(v,Palette));
generalities-fig056
Show generalities/fig0560.asy on Github.
Generated with Asymptote 3.00-0.
Categories : Examples 2D | Generalities
Tags : #Basis | #Fill/Unfill | #Shading | #Circle
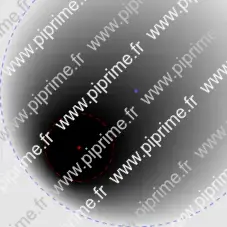
size(8cm,0);

pair A=(0.35,0.35), B=(0.6,0.6);

radialshade(unitsquare,black,A,0.15,lightgrey,B,.6);

dot(A,.8red);
dot(B,blue+grey);
draw(shift(A)*scale(.15)*unitcircle,dashed+.8red);
draw(shift(B)*scale(.6)*unitcircle,dashed+blue+grey);
clip(unitsquare);
generalities-fig057

Show generalities/fig0570.asy on Github.
Generated with Asymptote 3.00-0.
Categories : Examples 2D | Generalities
Tags : #Basis | #Fill/Unfill | #Shading | #Transform/scale/shift/rotate | #Direction
size(8cm,0);

transform t=xscale(1.25);
pen p1=blue, p2=yellow;
pair pa=t*dir(135), pb=t*dir(-45);

axialshade(t*unitcircle,p1,pa,p2,pb);
draw(pa--pb, dashed);
generalities-fig058
Show generalities/fig0580.asy on Github.
Generated with Asymptote 3.00-0.
Categories : Examples 2D | Generalities
Tags : #Fill/Unfill | #Shading | #Arc | #Loop/for/while | #Transform/scale/shift/rotate
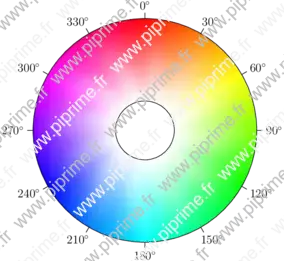
// Author: John Bowman
size(10cm,0);

real r=1;
real R=3.8;

int step=30;
path p=arc(0,r,0,step);
path P=arc(0,R,step,0);
for(int h=0; h < 360; h += step) {
  transform t=rotate(90-h);
  tensorshade(t*p--t*P--cycle,
              new pen[] {white,white,hsv(h-step,1,1),hsv(h,1,1)});
}

for(int h=0; h < 360; h += 30) {
  pair v=R*dir(90-h);
  draw(Label(string(h)+"$^\circ$",EndPoint),(v--1.05v));
}

draw(circle(0,r));
draw(circle(0,R));
generalities-fig059

Show generalities/fig0590.asy on Github.
Generated with Asymptote 3.00-0.
Categories : Examples 2D | Generalities
Tags : #Basis | #Shading | #Tex/latex features | #Texpath | #Fill/Unfill | #Array
size(16cm,0);

path[] P=texpath("$\displaystyle\int_{-\infty}^{+\infty}e^{-\alpha x^2}\,dx=
\sqrt{\frac{\pi}{\alpha}}$");
pair m=min(P), M=max(P);

axialshade(P,yellow,m,red,(m.x,M.y));
draw(P,0.5*blue);
shipout(bbox(3mm,Fill));
generalities-fig060
Show generalities/fig0600.asy on Github.
Generated with Asymptote 3.00-0.
Categories : Examples 2D | Generalities
Tags : #Basis | #Fill/Unfill | #Path
size(8cm,0);

pair A, B, C, D;
A=(0,0); B=(1,0);
C=(1,1); D=(0,1);
fill(A--C--B--D--cycle,grey);
generalities-fig061
Show generalities/fig0610.asy on Github.
Generated with Asymptote 3.00-0.
Categories : Examples 2D | Generalities
Tags : #Basis | #Fill/Unfill | #Path
size(8cm,0);

pair A, B, C, D;
A=(0,0); B=(1,0);
C=(1,1); D=(0,1);
filldraw(A--C--B--D--cycle,grey);
generalities-fig062

Show generalities/fig0620.asy on Github.
Generated with Asymptote 3.00-0.
Categories : Examples 2D | Generalities
Tags : #Basis | #Opacity | #Fill/Unfill | #Circle | #Transform/scale/shift/rotate
size(10cm, 0);

path cle=unitcircle;

draw((-1.5, 0)--(2.5, 0), linewidth(10mm));
filldraw(cle, red+opacity(.5));
filldraw(shift((1, 0))*cle, blue+opacity(.5));

shipout(format="pdf");
generalities-fig063
![]()
Show generalities/fig0630.asy on Github.
Generated with Asymptote 3.00-0.
Categories : Examples 2D | Generalities
Tags : #Basis | #Point/Dot | #Direction
pair O=0;

dot("N",O,N);
dot("S",O,S);
dot("E",O,E);
dot("W",O,W);
generalities-fig064

Show generalities/fig0640.asy on Github.
Generated with Asymptote 3.00-0.
Categories : Examples 2D | Generalities
Tags : #Basis | #Point/Dot | #Direction | #Label | #Labelmargin
pair O=0;
labelmargin=2;

dot("N",O,N);
dot("S",O,S);
dot("E",O,E);
dot("W",O,W);
generalities-fig065

Show generalities/fig0650.asy on Github.
Generated with Asymptote 3.00-0.
Categories : Examples 2D | Generalities
Tags : #Basis | #Point/Dot | #Direction | #Label | #Labelmargin
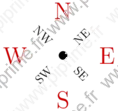
size(10cm,0);

pair O=0;
dot("N",O,10N);
draw("S",O,10S);
draw("E",O,10E);
draw("W",O,10W);

draw("NE",O,5NE);
draw("SE",O,5SE);
draw("NW",O,5NW);
draw("SW",O,5SW);
generalities-fig066
Show generalities/fig0660.asy on Github.
Generated with Asymptote 3.00-0.
Categories : Examples 2D | Generalities
Tags : #Basis | #Point/Dot | #Direction | #Label | #Labelmargin
pair O=0;
draw(scale(2)*Label("N",.8red),O,10*N,linewidth(3mm));
draw(scale(2)*Label("S",.8red),O,10*S);
draw(scale(2)*Label("E",.8red),O,10*E);
draw(scale(2)*Label("W",.8red),O,10*W);

draw(rotate(45)*Label("NE"),O,5NE);
draw(rotate(-45)*Label("SE"),O,5SE);
draw(rotate(-45)*Label("NW"),O,5NW);
draw(rotate(45)*Label("SW"),O,5SW);
generalities-fig067

Show generalities/fig0670.asy on Github.
Generated with Asymptote 3.00-0.
Categories : Examples 2D | Generalities
Tags : #Basis | #Point/Dot | #Label | #Tex/latex features | #Fraction
pair O=0;
dot(O);
label(scale(5) * "$\frac{\pi^2}{2}$", O);
generalities-fig068

Show generalities/fig0680.asy on Github.
Generated with Asymptote 3.00-0.
Categories : Examples 2D | Generalities
Tags : #Basis | #Point/Dot | #Label | #Tex/latex features | #Fraction | #Align
dot(Label(scale(5) * "$\frac{\pi^2}{2}$", (0,0), align=E));
generalities-fig069
Show generalities/fig0690.asy on Github.
Generated with Asymptote 3.00-0.
Categories : Examples 2D | Generalities
Tags : #Basis | #Label
label(scale(15)*Label("$\pi$"), (0,0));
generalities-fig070
Show generalities/fig0700.asy on Github.
Generated with Asymptote 3.00-0.
Categories : Examples 2D | Generalities
Tags : #Basis | #Label
texpreamble("\usepackage{manfnt}");

label(scale(6)*Label("\textdbend"), (0,0));
generalities-fig071
![]()
Show generalities/fig0710.asy on Github.
Generated with Asymptote 3.00-0.
Categories : Examples 2D | Generalities
Tags : #Basis | #Point/Dot | #Label | #Tex/latex features | #Align
dot(Label("$A$"), (0,0), S);
generalities-fig072
Show generalities/fig0720.asy on Github.
Generated with Asymptote 3.00-0.
Categories : Examples 2D | Generalities
Tags : #Basis | #Point/Dot | #Label | #Align | #Shipout
size(6cm, 6cm);

dot(Label("$A$"),(0,0),S);
draw(E--W,invisible);
draw(N--S,invisible);

shipout(bbox());
generalities-fig073
![]()
Show generalities/fig0730.asy on Github.
Generated with Asymptote 3.00-0.
Categories : Examples 2D | Generalities
Tags : #Basis | #Point/Dot | #Label | #Tex/latex features | #Align
dot(Label("$A$", fontsize(26pt)), (0,0), NE);
generalities-fig074
![]()
Show generalities/fig0740.asy on Github.
Generated with Asymptote 3.00-0.
Categories : Examples 2D | Generalities
Tags : #Basis | #Point/Dot | #Label | #Tex/latex features | #Align | #Defaultpen
defaultpen(fontsize(26pt));

dot(Label("$A$"),(0,0),NE);
dot(Label("$B$"),(2cm,0),NE+N);
generalities-fig075

Show generalities/fig0750.asy on Github.
Generated with Asymptote 3.00-0.
Categories : Examples 2D | Generalities
Tags : #Basis | #Label
label(rotate(45) * scale(5) * "\textbf{Hello}");
generalities-fig076

Show generalities/fig0760.asy on Github.
Generated with Asymptote 3.00-0.
Categories : Examples 2D | Generalities
Tags : #Basis | #Label | #Transform/scale/shift/rotate | #Fill/Unfill
frame f;
label(f,"\textbf{Hello}",yellow,Fill(black));
add(scale(5)*rotate(45)*f);
generalities-fig077

Show generalities/fig0770.asy on Github.
Generated with Asymptote 3.00-0.
Categories : Examples 2D | Generalities
Tags : #Basis | #Label | #Transform/scale/shift/rotate | #Fill/Unfill
frame f;
filldraw(scale(5cm)*unitsquare, black);
label(f,"Hello", 0.8*red, Fill(white));
add(rotate(45) * scale(5) * f, (2.5cm,2.5cm));
generalities-fig078

Show generalities/fig0780.asy on Github.
Generated with Asymptote 3.00-0.
Categories : Examples 2D | Generalities
Tags : #Basis | #Label | #Layer
label(scale(5)*"\textbf{Cancel}");
draw((min(currentpicture).x,0)--(max(currentpicture).x,0), 6bp + red * 0.8);
generalities-fig079

Show generalities/fig0790.asy on Github.
Generated with Asymptote 3.00-0.
Categories : Examples 2D | Generalities
Tags : #Basis | #Label | #Layer
label(scale(6)*"\textbf{Cancel}");
layer();
draw((min(currentpicture).x,0)--(max(currentpicture).x,0), 6bp + red * 0.8);
generalities-fig080
Show generalities/fig0800.asy on Github.
Generated with Asymptote 3.00-0.
Categories : Examples 2D | Generalities
Tags : #Basis | #Direction
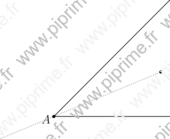
size(6cm,0);
path line1=(0,0)--(1,0);
path line2=(0,0)--(1,1);
pair bissec=dir(line1,line2);

draw(line1); draw(line2);
dot(bissec,linewidth(3bp));
draw(-.5bissec--bissec,dotted);
dot("$A$",(0,0),-bissec);
generalities-fig081
Show generalities/fig0810.asy on Github.
Generated with Asymptote 3.00-0.
Categories : Examples 2D | Generalities
Tags : #Basis | #Direction
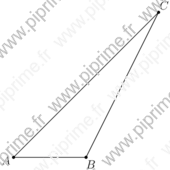
size(6cm,0);
pair A=0, B=(1,0), C=(2,2);;

draw(A--B--C--cycle);
dot("$A$",A,dir(C--A,B--A));
dot("$B$",B,dir(C--B,A--B));
dot("$C$",C,dir(A--C,B--C));
generalities-fig082
Show generalities/fig0820.asy on Github.
Generated with Asymptote 3.00-0.
Categories : Examples 2D | Generalities
Tags : #Basis | #Align | #Basealign | #Transform/scale/shift/rotate | #Fontsize
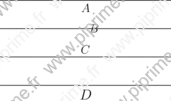
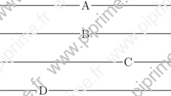
size(0,0);
path line=(0,0)--(6cm,0);
transform T=shift(0,-cm);

draw("$A$",line);
draw("$B$",T*line,dir(0));
draw("$C$",T^2*line,N);
draw(Label("$D$",fontsize(14pt)),T^3*line);
generalities-fig083
Show generalities/fig0830.asy on Github.
Generated with Asymptote 3.00-0.
Categories : Examples 2D | Generalities
Tags : #Basis | #Align | #Basealign | #Fill/Unfill | #Position | #Transform/scale/shift/rotate
size(0,0);
path line=(0,0)--(6cm,0);
transform T=shift(0,-cm);

draw(Label("A",align=Center,filltype=UnFill), line);
draw(Label("B",UnFill), T*line, Center);
draw(Label("C",align=Center,position=Relative(.75),UnFill), T^2*line);
draw(Label("D",position=Relative(.25),UnFill), align=Center, T^3*line);
generalities-fig084
![]()
Show generalities/fig0840.asy on Github.
Generated with Asymptote 3.00-0.
Categories : Examples 2D | Generalities
Tags : #Basis | #Align | #Basealign | #Transform/scale/shift/rotate | #Shipout
pair c=0;
label("abc xyz ijk",c,Align,basealign);
label("abc xyz ijk",c,Align,red);
draw(c--(c+(2cm,0))); // This is the baseline.

shipout((scale(3)*currentpicture.fit()));
generalities-fig085
Show generalities/fig0850.asy on Github.
Generated with Asymptote 3.00-0.
Categories : Examples 2D | Generalities
Tags : #Basis | #Label | #Path
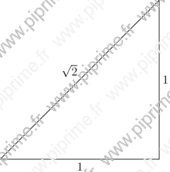
size(6cm,0);
pair A=0, B=(1,0), C=(1,1);

draw("$1$",A--B);
draw("$1$",B--C);
draw("$\sqrt{2}$",C--A);
generalities-fig086
Show generalities/fig0860.asy on Github.
Generated with Asymptote 3.00-0.
Categories : Examples 2D | Generalities
Tags : #Basis | #Label | #Path | #Tex/latex features | #Align | #Rotate
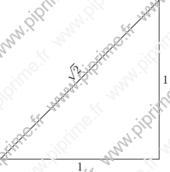
size(6cm,0);
pair A=0, B=(1,0), C=(1,1);

draw("$1$",A--B);
draw("$1$",B--C);

// draw(rotate(dir(C--A))*"$\sqrt{2}$",C--A);
draw(Label("$\sqrt{2}$",Rotate(-dir(C--A))),C--A);
generalities-fig087
Show generalities/fig0870.asy on Github.
Generated with Asymptote 3.00-0.
Categories : Examples 2D | Generalities
Tags : #Basis | #Label | #Path | #Align | #Rotate
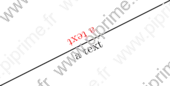
size(6cm,0);
path g=(1,1)--(3,2);
draw(Label("a text",Rotate(dir(g))), g);
draw(Label("a text",red,Rotate(-dir(g)),align=I*dir(g)), g);
generalities-fig088

Show generalities/fig0880.asy on Github.
Generated with Asymptote 3.00-0.
Categories : Examples 2D | Generalities
Tags : #Basis | #Defaultpen | #Point/Dot | #Transform/scale/shift/rotate | #Arrows/Bars | #Margin
size(0,0);
pair A=(0,0), B=(4cm,0);
path line=A--B;
transform TD=shift(0,-cm);
transform TR=shift(2.5cm,0);

defaultpen(linewidth(3bp));

draw("$AB$",line,.8red,Arrows(3mm));
draw("$A$",A,N); draw("$B$",B,N);

draw("$AB$",TD*line,.8red,Arrows(3mm),PenMargins);
draw("$A$",TD*A,N); draw("$B$",TD*B,N);

draw("$AB$",TD^2*line,.8red,Arrows(3mm),DotMargins);
dot("$A$",TD^2*A,dotfactor*NW); dot("$B$",TD^2*B,dotfactor*NE);

margin BigMargins=Margin(2,2);
draw("$AB$",TD^3*line,.8red,Arrows(3mm),BigMargins);
draw("$A$",TD^3*A,N); draw("$B$",TD^3*B,N);
generalities-fig089
Show generalities/fig0890.asy on Github.
Generated with Asymptote 3.00-0.
Categories : Examples 2D | Generalities
Tags : #Basis | #Deferred drawing | #Arrows/Bars | #Labelmargin | #Margin | #Picture
//From documentation of Asymptote
size(6cm, 0);

void distance(picture pic=currentpicture, pair A, pair B, Label L="", real n=0, pen p=currentpen)
{
  real d=3mm;
  guide g=A--B;
  transform T=shift(-n*d*unit(B-A)*I);
  pic.add(new void(frame f, transform t) {
    picture opic;
    guide G=T*t*g;
    draw(opic, G, p, Arrows(NoFill), Bars, PenMargins);
    label(opic, L, midpoint(G), UnFill(1));
    add(f, opic.fit());
  });
  pic.addBox(min(g), max(g), T*min(p), T*max(p));
}

pair A=(0, 0), B=(3, 3);

dot(A);
dot(B);
distance(A, B, Label("$\ell$", Rotate(dir(A--B))), 1);
generalities-fig090
Show generalities/fig0900.asy on Github.
Generated with Asymptote 3.00-0.
Categories : Examples 2D | Generalities
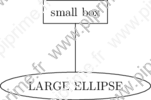
Tags : #Basis | #Object | #Label
// Author: John Bowman
size(0, 100);
real margin=2mm;
pair z1=(0,1);
pair z0=(0,0);

object label1=draw("small box",box,z1,margin);
object label0=draw("LARGE ELLIPSE",ellipse,z0,margin);

add(new void(frame f, transform t) {
    draw(f,point(label1,S,t)--point(label0,N,t));
  });
generalities-fig091
Show generalities/fig0910.asy on Github.
Generated with Asymptote 3.00-0.
Categories : Examples 2D | Generalities
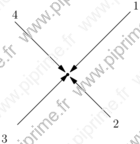
Tags : #Basis | #Arrows/Bars
size(0,0);
pair A=0;
dot(A);

arrow("1",A,NE, 3cm);
arrow("2",A,SE, 2cm);
arrow("3",A,SW, 2.5cm, Margin(3,0));
arrow("4",A,NW, 2.5cm,N);
generalities-fig092
Show generalities/fig0920.asy on Github.
Generated with Asymptote 3.00-0.
Categories : Examples 2D | Generalities
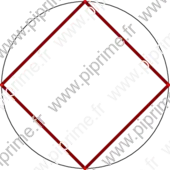
Tags : #Basis | #Path | #Circle
size(6cm,0);

draw(E--N--W--S--cycle,.5red+1mm);

draw(E..N..W..S..cycle);
dot(E..N..W..S..cycle,red);
generalities-fig093
Show generalities/fig0930.asy on Github.
Generated with Asymptote 3.00-0.
Categories : Examples 2D | Generalities
Tags : #Basis | #Size | #Path | #Circle
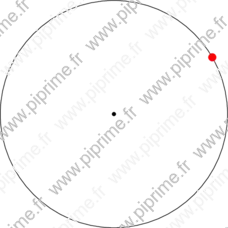
size(0,0);
pair O=0;

draw(circle(O,4cm));
dot(circle(O,4cm), red+4bp);
generalities-fig094
Show generalities/fig0940.asy on Github.
Generated with Asymptote 3.00-0.
Categories : Examples 2D | Generalities
Tags : #Basis | #Size | #Path | #Circle
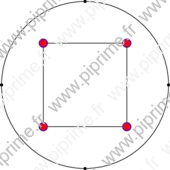
size(6cm);

draw(unitcircle, dot);
dotfactor*=3;
draw(shift(-0.5,-0.5)*unitsquare, dot(blue,Fill(red)));
generalities-fig095
Show generalities/fig0950.asy on Github.
Generated with Asymptote 3.00-0.
Categories : Examples 2D | Generalities
Tags : #Basis | #Size | #Path | #Transform/scale/shift/rotate
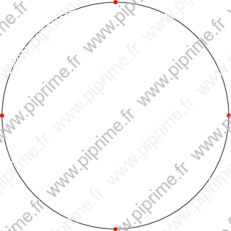
size(0,0);

real R=4cm;

draw(scale(R)*unitcircle);
dot((0,0),linewidth(4bp));
dot((R*cos(pi/6),R*sin(pi/6)),red+8bp);
generalities-fig096
Show generalities/fig0960.asy on Github.
Generated with Asymptote 3.00-0.
Categories : Examples 2D | Generalities
Tags : #Basis | #Size | #Path
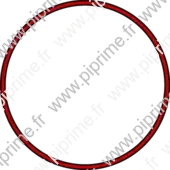
size(6cm,0);

import graph;

path PerfectCircle=Circle((0,0),1);

draw(PerfectCircle,linewidth(2mm));
dot(PerfectCircle,.8red);
generalities-fig097
Show generalities/fig0970.asy on Github.
Generated with Asymptote 3.00-0.
Categories : Examples 2D | Generalities
Tags : #Basis | #Size | #Path | #Circle
size(6cm,0);

//Return Circle AB diameter
path circle(pair A, pair B)
{
  return shift(midpoint(A--B))*scale(abs(A-B)/2)*unitcircle;
}

pair A=(0,0), B=(1,0);

draw(circle(A,B));
dot(A--B);
generalities-fig098
Show generalities/fig0980.asy on Github.
Generated with Asymptote 3.00-0.
Categories : Examples 2D | Generalities
Tags : #Basis | #Size | #Path | #Circle
size(6cm,0);

//Return Circle AB diameter
path circle(pair A, pair B)
{
  return shift(midpoint(A--B))*scale(abs(A-B)/2)*unitcircle;
}

pair A=(0,0), B=(3,0), C=(2,1);

draw(A--B,.8blue);
draw(A--C,.8red);
draw(B--C,.8green);
draw(circle(A,B),.8blue);
draw(circle(A,C),.8red);
draw(circle(B,C),.8green);
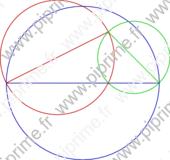
generalities-fig099

Show generalities/fig0990.asy on Github.
Generated with Asymptote 3.00-0.
Categories : Examples 2D | Generalities
Tags : #Basis | #Size | #Path | #Circle | #Function creation
size(6cm,0);

//Return Circle AB diameter
path circle(pair A, pair B)
{
  return shift(midpoint(A--B))*scale(abs(A-B)/2)*unitcircle;
}

pair A=(0,0), B=(1,0), C=(2,0);
path cleAB=circle(A,B);
path cleAC=circle(A,C);

for(real t=0; t<length(cleAB); t+=0.01)
  fill(circle(point(cleAB,t),point(cleAC,t)));
generalities-fig100
Show generalities/fig1000.asy on Github.
Generated with Asymptote 3.00-0.
Categories : Examples 2D | Generalities
Tags : #Basis | #Circle | #Arc
size(0,0);
pair O=0;

defaultpen(linewidth(2mm));
draw(arc(O,4cm,0,60), .8red, BeginPenMargin);
draw(arc(O,4cm,60,120), .7green, PenMargins);
draw(arc(O,-4cm,0,120), .7blue);
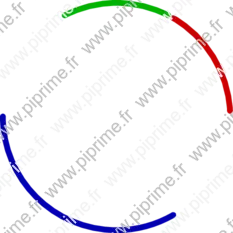
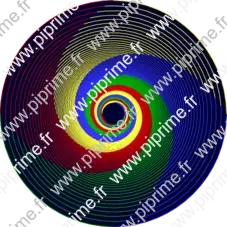
generalities-fig101
Show generalities/fig1010.asy on Github.
Generated with Asymptote 3.00-0.
Categories : Examples 2D | Generalities
Tags : #Basis | #Circle | #Picture | #Transform/scale/shift/rotate | #Array
size(8cm,0);

picture pic;
pen [] P={.8red,.7green,blue+.5grey,yellow+.6grey};

fill(scale(10)*unitcircle,.2blue);

for (int i = 0; i <= 3; ++i)
  draw(pic, arc((0,0),10,i*90,(i+1)*90), P[i]);

for (real i = 1; i <= 10; i+=.05)
  add(rotate(90*i)*scale(1/i)*pic);
generalities-fig102
Show generalities/fig1020.asy on Github.
Generated with Asymptote 3.00-0.
Categories : Examples 2D | Generalities
Tags : #Basis | #Loop/for/while | #Fill/Unfill | #Arc
size(6cm,0);

real a=360/6;
for (int i = -1; i < 5; ++i)
  fill(arc((0,0),1,i*a,(i+1)*a)--cycle,grey);
generalities-fig103
Show generalities/fig1030.asy on Github.
Generated with Asymptote 3.00-0.
Categories : Examples 2D | Generalities
Tags : #Basis | #Loop/for/while | #Fill/Unfill | #Arc
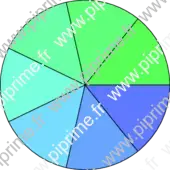
size(6cm,0);

real n=7, a=360/n;
for (int i = 0; i < n; ++i)
  filldraw((0,0)--arc((0,0),1,i*a,(i+1)*a)--cycle, i/n*blue + (1-i/n)*green + grey);
generalities-fig104
Show generalities/fig1040.asy on Github.
Generated with Asymptote 3.00-0.
Categories : Examples 2D | Generalities
Tags : #Basis | #Loop/for/while | #Fill/Unfill | #Arc | #Label | #Number format | #Align
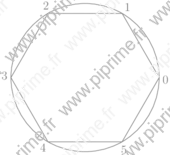
size(6cm,0);

real a=360/6;
for (int i = -1; i < 5; ++i)
  draw(Label(format("%i",i+1)),arc((0,0),10,i*a,(i+1)*a)--cycle,grey);
generalities-fig105
Show generalities/fig1050.asy on Github.
Generated with Asymptote 3.00-0.
Categories : Examples 2D | Generalities
Tags : #Basis | #Number format
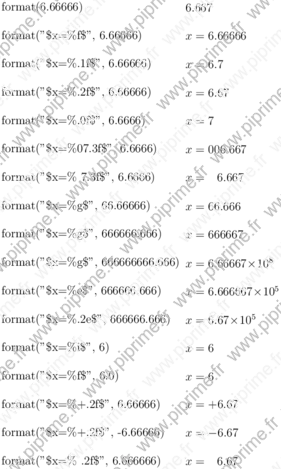
size(0,0);

pair x=0;
pair y=(-6.5cm,0);

label(format(6.66666), x, E);
label("format(6.66666)", y, E);

x+=(0,-1cm);y+=(0,-1cm);
label(format("$x=%f$", 6.66666), x, E);
label("format(\"\$x=\%f\$\", 6.66666)", y, E);

x+=(0,-1cm);y+=(0,-1cm);
label(format("$x=%.1f$", 6.66666), x, E);
label("format(\"\$x=\%.1f\$\", 6.66666)", y, E);

x+=(0,-1cm);y+=(0,-1cm);
label(format("$x=%.2f$", 6.66666), x, E);
label("format(\"\$x=\%.2f\$\", 6.66666)", y, E);

x+=(0,-1cm);y+=(0,-1cm);
label(format("$x=%.0f$", 6.66666), x, E);
label("format(\"\$x=\%.0f\$\", 6.6666)", y, E);

x+=(0,-1cm);y+=(0,-1cm);
label(format("$x=%07.3f$", 6.66666), x, E);
label("format(\"\$x=\%07.3f\$\", 6.6666)", y, E);

x+=(0,-1cm);y+=(0,-1cm);
label(format("$x=%7.3f$", 6.66666), x, E);
label("format(\"\$x=\% 7.3f\$\", 6.6666)", y, E);

x+=(0,-1cm);y+=(0,-1cm);
label(format("$x=%g$", 66.666), x, E);
label("format(\"\$x=\%g\$\", 66.66666)", y, E);

x+=(0,-1cm);y+=(0,-1cm);
label(format("$x=%g$", 666666.666), x, E);
label("format(\"\$x=\%g\$\", 666666.666)", y, E);

x+=(0,-1cm);y+=(0,-1cm);
label(format("$x=%g$", 666666666.666), x, E);
label("format(\"\$x=\%g\$\", 666666666.666)", y, E);

x+=(0,-1cm);y+=(0,-1cm);
label(format("$x=%e$", 666666.666), x, E);
label("format(\"\$x=\%e\$\", 666666.666)", y, E);

x+=(0,-1cm);y+=(0,-1cm);
label(format("$x=%.2e$", 666666.666), x, E);
label("format(\"\$x=\%.2e\$\", 666666.666)", y, E);

x+=(0,-1cm);y+=(0,-1cm);
label(format("$x=%i$", 6), x, E);
label("format(\"\$x=\%i\$\", 6)", y, E);

x+=(0,-1cm);y+=(0,-1cm);
label(format("$x=%f$", 6.0), x, E);
label("format(\"\$x=\%f\$\", 6.0)", y, E);

x+=(0,-1cm);y+=(0,-1cm);
label(format("$x=%+.2f$", 6.66666), x, E);
label("format(\"\$x=\%+.2f\$\", 6.66666)", y, E);

x+=(0,-1cm);y+=(0,-1cm);
label(format("$x=%+.2f$", -6.66666), x, E);
label("format(\"\$x=\%+.2f\$\", -6.66666)", y, E);

x+=(0,-1cm);y+=(0,-1cm);
label(format("$x=% .2f$", 6.666666), x, E);
label("format(\"\$x=\% .2f\$\", 6.666666)", y, E);
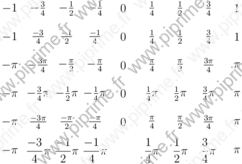
generalities-fig106

Show generalities/fig1070.asy on Github.
Generated with Asymptote 3.00-0.
Categories : Examples 2D | Generalities
Tags : #Basis
// This file was compiled with this unix command: LC_NUMERIC="french" asy
size(0,0);
texpreamble("\usepackage[frenchb]{babel}");

pair x=0;

x+=(0,-1cm);
label(format("$x=%f$", 666666.666), x, E);
x+=(0,-1cm);
label(format("$x=%f$", pi), x, E);
x+=(0,-1cm);
label(format("$x=\nombre{%f}$", 666666.666), x, E);
x+=(0,-1cm);
label(format("$x=\nombre{%f}$", pi), x, E);
generalities-fig107
Show generalities/fig1080.asy on Github.
Generated with Asymptote 3.00-0.
Categories : Examples 2D | Generalities
Tags : #Basis | #Number format | #Fraction
size(0,0);

int pgcd(int a, int b)
{
  int a_=abs(a), b_=abs(b), r=a_;
  if (b_>a_) {a_=b_; b_=r; r=a_;}
  while (r>0)
    {
      r=a_%b_;
      a_=b_;
      b_=r;
    }
  return a_;
}

string texfrac(int p, int q,
               string factor="",
               bool signin=false, bool factorin=true,
               bool displaystyle=false,
               bool zero=true)
{
  if (p==0) return (zero ? "$0$" : "");
  string disp= displaystyle ? "$\displaystyle " : "$";
  int pgcd=pgcd(p,q);
  int num= round(p/pgcd), den= round(q/pgcd);
  string nums;
  if (num==1)
    if (factor=="" || (!factorin && (den !=1))) nums="1"; else nums="";
  else
    if (num==-1)
      if (factor=="" || (!factorin && (den !=1))) nums="-1"; else nums="-";
    else nums= (string) num;
  if (den==1) return "$" + nums + factor + "$";
  else
    {
      string dens= (den==1) ? "" : (string) den;
      if (signin || num>0)
        if (factorin)
          return disp + "\frac{" + nums + factor + "}{" + (string) dens + "}$";
        else
          return disp + "\frac{" + nums + "}{" + (string) dens + "}"+ factor + "$";
      else
        {
          if (num==-1)
            if (factor=="" || !factorin) nums="1"; else nums="";
          else nums=(string)(abs(num));
        if (factorin)
          return disp + "-\frac{" + nums + factor + "}{" + (string) dens + "}$";
        else
          return disp + "-\frac{" + nums + "}{" + (string) dens + "}"+ factor + "$";
        }
    }
}

for (int i=-4; i<=4; ++i)
  {
    label(texfrac(i,4), (i*cm,0));
    label(texfrac(i,4,signin=true), (i*cm,-cm));
    label(texfrac(i,4,factor="\pi"), (i*cm,-2cm));
    label(texfrac(i,4,factor="\pi",factorin=false), (i*cm,-3cm));
    label(texfrac(i,4,factor="\pi",signin=true,factorin=true), (i*cm,-4cm));
    label(texfrac(i,4,factor="\pi",signin=true,factorin=false,displaystyle=true,zero=false), (i*cm,-5cm));
  }
generalities-fig108
Show generalities/fig1090.asy on Github.
Generated with Asymptote 3.00-0.
Categories : Examples 2D | Generalities
Tags : #Basis | #Fill/Unfill | #Picture
size(6cm,0);

pair A=0, B=(1,0), C=(.7,1);

void fillangle(picture pic=currentpicture,
	       pair O=0, pair A, pair B,
	       real radius=10,
	       pen p=grey)
{
  picture tpic;
  int n=sgn(radius);
  real a1=degrees(shift(-O)*A,false);
  real a2=degrees(shift(-O)*B,false);
  fill(tpic,(0,0)--arc((0,0), -radius, max(a1,a2), min(a1,a2),true)--cycle, p=p);
  add(pic,tpic,O);
}

draw(A--B--C--cycle);

real r1=15, r2=20;
fillangle(A,B,C,r1,.8red);
fillangle(A,B,C,-r2);
fillangle(B,A,C,r1,.8red);
fillangle(B,A,C,-r2);
fillangle(C,B,A,r1,.8red);
fillangle(C,B,A,-r2);
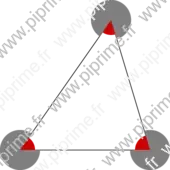
generalities-fig109
Show generalities/fig1100.asy on Github.
Generated with Asymptote 3.00-0.
Categories : Examples 2D | Generalities
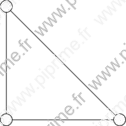
Tags : #Basis | #Transform/scale/shift/rotate
size(0,0);
pair A, B, C;
A=(0,0); B=(4cm,0); C=(0,4cm);

draw(A--B--C--cycle);
filldraw(shift(A)*scale(6bp)*unitcircle, white);
filldraw(shift(B)*scale(6bp)*unitcircle, white);
filldraw(shift(C)*scale(6bp)*unitcircle, white);
generalities-fig110
Show generalities/fig1110.asy on Github.
Generated with Asymptote 3.00-0.
Categories : Examples 2D | Generalities
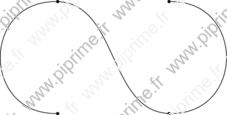
Tags : #Basis | #Point/Dot
size(8cm,0);
pair A=(0,0), B=(0,1), C=(1,0), D=(1,1);

draw(A..B..C..D);
dot(A);dot(B);dot(C);dot(D);
generalities-fig111
Show generalities/fig1120.asy on Github.
Generated with Asymptote 3.00-0.
Categories : Examples 2D | Generalities
Tags : #Basis | #Point/Dot | #Path
size(6cm,0);
import roundedpath;

pair A=(0,0), B=(0,1), C=(1,0), D=(1,1);

draw(roundedpath(A--B--C--D,.5));
dot(A--B--C--D);
generalities-fig112
Show generalities/fig1130.asy on Github.
Generated with Asymptote 3.00-0.
Categories : Examples 2D | Generalities
Tags : #Basis | #Point/Dot
size(6cm,0);
pair A=(0,0), B=(0,1), C=(1,0), D=(1,1);

draw(A--B..C..D);
dot(A--B--C--D);
generalities-fig113
Show generalities/fig1140.asy on Github.
Generated with Asymptote 3.00-0.
Categories : Examples 2D | Generalities
Tags : #Basis | #Point/Dot
size(6cm,0);
pair A=(0,0), B=(0,1), C=(1,0), D=(1,1);

draw(A..B..C..D--cycle);
dot(A);dot(B);dot(C);dot(D);
generalities-fig114

Show generalities/fig1150.asy on Github.
Generated with Asymptote 3.00-0.
Categories : Examples 2D | Generalities
Tags : #Basis | #Point/Dot
size(6cm,0);
pair A=(0,0), B=(0,1), C=(1,0), D=(1,1);

draw(A---B..C..D);
dot(A);dot(B);dot(C);dot(D);
generalities-fig115
Show generalities/fig1160.asy on Github.
Generated with Asymptote 3.00-0.
Categories : Examples 2D | Generalities
Tags : #Basis | #Point/Dot
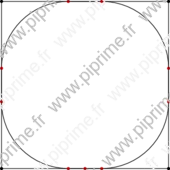
size(6cm,0);
import roundedpath;

draw(roundedpath(unitsquare,.4));
dot(roundedpath(unitsquare,.4),red);
draw(unitsquare);
dot(unitsquare);
generalities-fig116
Show generalities/fig1170.asy on Github.
Generated with Asymptote 3.00-0.
Categories : Examples 2D | Generalities
Tags : #Basis | #Point/Dot
size(0,0);

pair A=0, B=(6cm,0);

draw(A{N}..B);
dot(A{N}..B);
generalities-fig117
![]()
Show generalities/fig1180.asy on Github.
Generated with Asymptote 3.00-0.
Categories : Examples 2D | Generalities
Tags : #Basis | #Point/Dot
size(0,0);

pair A=0, B=(6cm,0);

draw(A{N}..B{E});
dot(A{N}..B{E});
generalities-fig118
![]()
Show generalities/fig1190.asy on Github.
Generated with Asymptote 3.00-0.
Categories : Examples 2D | Generalities
Tags : #Basis
size(0,0);

pair A=0, B=(6cm,0);

draw(A{dir(90)}..B{dir(0)});
dot(A{dir(90)}..B{dir(0)});
generalities-fig119

Show generalities/fig1200.asy on Github.
Generated with Asymptote 3.00-0.
Categories : Examples 2D | Generalities
Tags : #Basis
size(0,0);

pair A=0, B=(6cm,0);

draw(A{dir(90)}..B{dir(180)});
dot(A{dir(90)}..B{dir(180)});
generalities-fig120

Show generalities/fig1210.asy on Github.
Generated with Asymptote 3.00-0.
Categories : Examples 2D | Generalities
Tags : #Basis
size(0,0);

pair A=0, B=(6cm,0);

draw(A{N}..B{N});
dot(A{N}..B{N});
generalities-fig121
Show generalities/fig1220.asy on Github.
Generated with Asymptote 3.00-0.
Categories : Examples 2D | Generalities
Tags : #Basis
size(0,0);

pair A=0, B=(6cm,0);

draw(A{N}..B{N}..cycle);
dot(A{N}..B{N}..cycle);
generalities-fig122

Show generalities/fig1230.asy on Github.
Generated with Asymptote 3.00-0.
Categories : Examples 2D | Generalities
Tags : #Basis | #Path | #Fill/Unfill
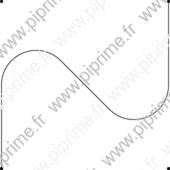
//From documentation of Asymptote
size(0,6cm);
guide center = (0,1){W}..tension 0.8..(0,0){(1,-.5)}..tension 0.8..{W}(0,-1);

draw((0,1)..(-1,0)..(0,-1));
filldraw(center{E}..{N}(1,0)..{W}cycle);
unfill(circle((0,0.5),0.125));
fill(circle((0,-0.5),0.125));
generalities-fig123

Show generalities/fig1240.asy on Github.
Generated with Asymptote 3.00-0.
Categories : Examples 2D | Generalities
Tags : #Basis | #Path | #Circle
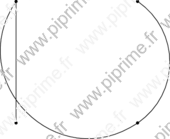
size(8cm);
draw(unitcircle, linewidth(bp));
pen p;
for (int t=-88; t <= 88; t += 2) {
  if(t%5 == 0) {
    p=linewidth(bp);
    draw((0,1){dir (t-90)}..{dir (270-t)}(0,-1), linewidth(bp));
  } else p=currentpen;
  draw((Cos(t),Sin(t)){dir(180+t)}..{dir(180-t)}(-Cos(t),Sin(t)), p);
}
generalities-fig124
Show generalities/fig1250.asy on Github.
Generated with Asymptote 3.00-0.
Categories : Examples 2D | Generalities
Tags : #Basis
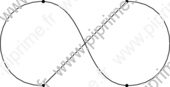
size(0,0);

pair A=0, B=(3cm,3cm), C=(6cm,0);

draw(A..B..C);
draw(A{curl 0}..B..{curl 0}C,red);
dot(A--B--C);
generalities-fig125

Show generalities/fig1260.asy on Github.
Generated with Asymptote 3.00-0.
Categories : Examples 2D | Generalities
Tags : #Basis
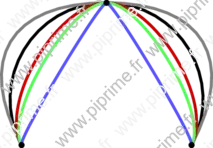
size(0,0);

pair A=0, B=(3cm, 3cm), C=(6cm, 0);

draw(A..B..C,linewidth(3mm));
draw(A{curl 1}..B..{curl 1}C,2mm+.8red);
dot(A--B--C);
generalities-fig126
Show generalities/fig1270.asy on Github.
Generated with Asymptote 3.00-0.
Categories : Examples 2D | Generalities
Tags : #Basis
size(0,0);

pair A=0, B=(3cm,4cm), C=(6cm,0);

draw(A..B..C);
draw(A{curl 0}..B..{curl 0}C,1mm+red+grey);
draw(A{curl 5}..B..{curl 0}C,1mm+green+grey);
draw(A{curl 10}..B..{curl 0}C,1mm+blue+grey);
draw(A{curl 10}..B..{curl 10}C,1mm+yellow+grey);
dot(A--B--C);
generalities-fig127
![]()
Show generalities/fig1280.asy on Github.
Generated with Asymptote 3.00-0.
Categories : Examples 2D | Generalities
Tags : #Basis
size(0,0);

pair A=0, B=(3cm,0.5cm), C=(6cm,0);

draw(A{N}..B{E}..C{S});
draw(A{N}::B{E}::C{S},red);
dot(A--B--C);
generalities-fig128
Show generalities/fig1290.asy on Github.
Generated with Asymptote 3.00-0.
Categories : Examples 2D | Generalities
Tags : #Basis
size(0,0);

pair A=0, B=(3cm,5cm), C=(6cm,0);
defaultpen(1mm);

draw(A..B..C);
draw(A.. tension .75 ..B.. tension .75 ..C,grey);
draw(A.. tension 1.5 ..B.. tension 1.5 ..C,.8red);
draw(A.. tension 2 ..B.. tension 2 ..C,green+grey);
draw(A.. tension 10 ..B.. tension 10 ..C,blue+grey);
dot(A--B--C,linewidth(6bp));
generalities-fig129
Show generalities/fig1300.asy on Github.
Generated with Asymptote 3.00-0.
Categories : Examples 2D | Generalities
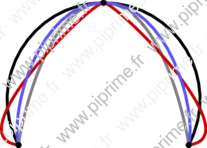
Tags : #Basis
size(0,0);

pair A=0, B=(3cm,5cm), C=(6cm,0);
defaultpen(1mm);

draw(A..B..C);
draw(A.. tension 10 and 1 ..B.. tension 1 and 10 ..C,grey);
draw(A.. tension 1 and 10 ..B.. tension 10 and 1 ..C,.8red);
draw(A.. tension 2 and 1 ..B.. tension 1 and 2 ..C,blue+grey);
dot(A--B--C,linewidth(6bp));
generalities-fig130

Show generalities/fig1310.asy on Github.
Generated with Asymptote 3.00-0.
Categories : Examples 2D | Generalities
Tags : #Basis
size(0,0);

pair A=0, B=(3cm,5cm), C=(6cm,0);
defaultpen(1mm);

draw(A..B..C);
draw(A.. tension 5 and 3 ..B.. tension 1 and 5 ..C,grey);
draw(A.. tension 5 and 1 ..B.. tension 3 and 5 ..C,.8red);
dot(A--B--C,linewidth(6bp));
generalities-fig131
Show generalities/fig1320.asy on Github.
Generated with Asymptote 3.00-0.
Categories : Examples 2D | Generalities
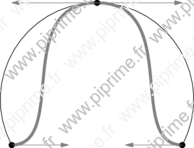
Tags : #Basis | #Path
size(0,0);

pair A=0, B=(3cm,5cm), C=(6cm,0);

pair ctrl_rgt_A, ctrl_lft_B, ctrl_rgt_B, ctrl_lft_C;
ctrl_rgt_A=A+2cm*E;
ctrl_lft_B=B+3cm*W;
ctrl_rgt_B=B+3cm*E;
ctrl_lft_C=C+2cm*W;

draw(A..B..C);
draw(A.. controls ctrl_rgt_A and ctrl_lft_B ..B.. controls ctrl_rgt_B and ctrl_lft_C ..C,1mm+grey);
dot(A--B--C,linewidth(6bp));
draw((A--ctrl_rgt_A),Arrow, p=grey);
draw((B--ctrl_rgt_B),Arrow, p=grey);
draw((B--ctrl_lft_B),Arrow, p=grey);
draw((C--ctrl_lft_C),Arrow, p=grey);
generalities-fig132
Show generalities/fig1330.asy on Github.
Generated with Asymptote 3.00-0.
Categories : Examples 2D | Generalities
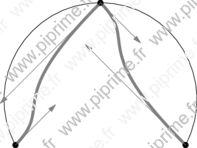
Tags : #Basis | #Path
size(0,0);

pair A=0, B=(3cm,5cm), C=(6cm,0);

pair ctrl_rgt_A, ctrl_lft_B, ctrl_rgt_B, ctrl_lft_C;
ctrl_rgt_A=A+2cm*NE;
ctrl_lft_B=B+5cm*SW;
ctrl_rgt_B=B+2cm*SE;
ctrl_lft_C=C+5cm*NW;

draw(A..B..C);
draw(A.. controls ctrl_rgt_A and ctrl_lft_B ..B.. controls ctrl_rgt_B and ctrl_lft_C ..C,1mm+grey);
dot(A--B--C,linewidth(6bp));
draw((A--ctrl_rgt_A),Arrow, p=grey);
draw((B--ctrl_rgt_B),Arrow, p=grey);
draw((B--ctrl_lft_B),Arrow, p=grey);
draw((C--ctrl_lft_C),Arrow, p=grey);
generalities-fig133

Show generalities/fig1340.asy on Github.
Generated with Asymptote 3.00-0.
Categories : Examples 2D | Generalities
Tags : #Basis | #Path
size(8cm);
path p1 = (0,0){up}..(5,4)..(10,0){down};

pair post0=postcontrol(p1,0);
pair pre1=precontrol(p1,1);
pair post1=postcontrol(p1,1);
pair pre2=precontrol(p1,2);

dot(post0^^pre1^^post1^^pre2);
path p2 = (0,0)..controls post0 and pre1..(5,4)..controls post1 and pre2..(10,0);

draw(p1,2mm+red);
draw(p2,linewidth(1mm));
generalities-fig134
Show generalities/fig1350.asy on Github.
Generated with Asymptote 3.00-0.
Categories : Examples 2D | Generalities
Tags : #Basis | #Path | #Circle
size(0,0);

path pt1=scale(4cm)*unitcircle;
path pt2=scale(2cm)*unitcircle;

draw(pt1^^pt2);
dot(pt1^^pt2);
generalities-fig135
Show generalities/fig1360.asy on Github.
Generated with Asymptote 3.00-0.
Categories : Examples 2D | Generalities
Tags : #Basis | #Path | #Circle | #Point/Dot | #Transform/scale/shift/rotate
size(0,0);

path cle=scale(4cm)*unitcircle;

draw(cle);

for(real i=0; i<=length(cle); i+=.2)
  {
    dot(point(cle,i));
    draw((0,0)--point(cle,i),dotted);
  }
generalities-fig136
Show generalities/fig1370.asy on Github.
Generated with Asymptote 3.00-0.
Categories : Examples 2D | Generalities
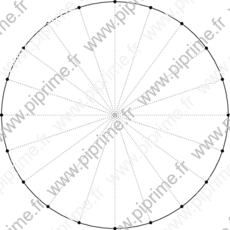
Tags : #Basis | #Path | #Circle | #Loop/for/while
size(0,0);

path cle=scale(4cm)*unitcircle;

draw(cle);

for(real i=0; i<=length(cle); i+=.2)
  draw(point(cle,i)--2cm*dir(cle,i)+point(cle,i),Arrow,p=i/length(cle)*red);
generalities-fig137
Show generalities/fig1380.asy on Github.
Generated with Asymptote 3.00-0.
Categories : Examples 2D | Generalities
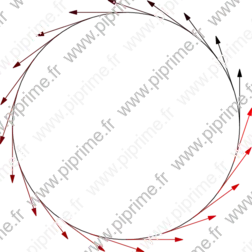
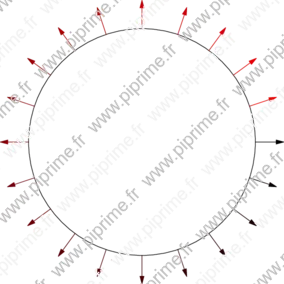
Tags : #Basis | #Path | #Circle | #Loop/for/while
size(0,0);

path cle=scale(4cm)*reverse(unitcircle);

draw(cle);

for(real i=0; i<=length(cle); i+=.2)
  draw(point(cle,i)--2cm*dir(cle,i)+point(cle,i),Arrow,p=i/length(cle)*red);
generalities-fig138
Show generalities/fig1390.asy on Github.
Generated with Asymptote 3.00-0.
Categories : Examples 2D | Generalities
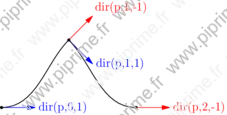
Tags : #Basis | #Path
size(8cm,0);
pair O=(0,0);
path p=(0,0){dir(0)}..{dir(45)}(2,2){dir(-45)}..{dir(0)}(4,0);

pair En1=dir(p, 1, -1);
pair En2=dir(p, 2, -1);
draw(p);
draw(Label("dir(p,1,-1)", EndPoint), point(p,1)--point(p,1)+En1, red, Arrow);
draw(Label("dir(p,2,-1)", EndPoint), point(p,2)--point(p,2)+En2, red, Arrow);

pair Ep0=dir(p, 0, 1);
pair Ep1=dir(p, 1, 1);
draw(Label("dir(p,0,1)", EndPoint), point(p,0)--point(p,0)+Ep0, blue, Arrow);
draw(Label("dir(p,1,1)", EndPoint, E), point(p,1)--point(p,1)+Ep1, blue, Arrow);

draw(p, dot);
generalities-fig139
Show generalities/fig1400.asy on Github.
Generated with Asymptote 3.00-0.
Categories : Examples 2D | Generalities
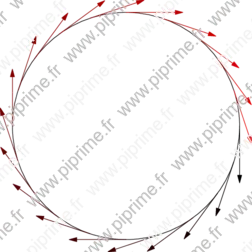
Tags : #Basis | #Path | #Circle | #Loop/for/while
size(0,0);

path cle=scale(4cm)*reverse(unitcircle);

draw(cle);

for(real i=0; i<=length(cle); i+=.2)
  draw(point(cle,i)--(1cm*I*dir(cle,i))+point(cle,i),Arrow,p=i/length(cle)*red);
generalities-fig140

Show generalities/fig1410.asy on Github.
Generated with Asymptote 3.00-0.
Categories : Examples 2D | Generalities
Tags : #Basis | #Circle | #Shading
size(6cm,0);

path cle=scale(2)*unitcircle;

radialshade(scale(2)*cle, white, (0,0), 2, yellow, (0,0), 4);
radialshade(cle, white, (1,.5), 0, 0.8*blue, (0,0), 2);

for(real i=0; i<=length(cle); i+=.2)
  draw(point(cle,i)--(-2*I*dir(cle,i)+point(cle,i)),p=2mm+yellow+linecap(0));
generalities-fig141
Show generalities/fig1420.asy on Github.
Generated with Asymptote 3.00-0.
Categories : Examples 2D | Generalities
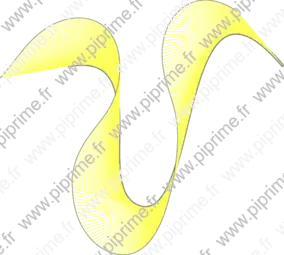
Tags : #Basis | #Path | #Loop/for/while
size(6cm,0);

path curv=reverse((0,2){dir(-60)}..(1,0)..{dir(60)}(2,2));

draw(curv);

for(real i=0; i<=length(curv); i+=.1)
  draw(point(curv,i)--dir(curv,i)+point(curv,i),grey);
generalities-fig142
Show generalities/fig1430.asy on Github.
Generated with Asymptote 3.00-0.
Categories : Examples 2D | Generalities
Tags : #Basis | #Path | #Loop/for/while
size(10cm,0);

path curv=reverse((0,2){dir(10)}..(1,0)..{dir(-50)}(3,2));
guide dirc;

draw(curv,linewidth(1mm)+grey);

for(real i=0; i<=length(curv); i+=.005)
  {
    draw(point(curv,i)--dir(curv,i)+point(curv,i),grey+yellow);
    dirc=dirc..dir(curv,i)+point(curv,i);
  }

draw(dirc,grey);
generalities-fig143
Show generalities/fig1440.asy on Github.
Generated with Asymptote 3.00-0.
Categories : Examples 2D | Generalities
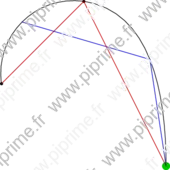
Tags : #Basis | #Path
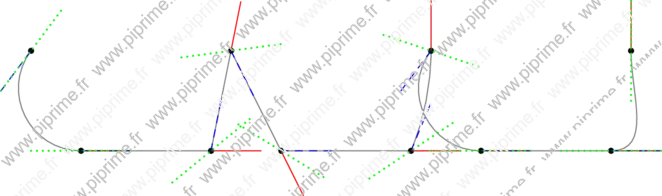
// Author: John Bowman
pair[] z=new pair[10];
z[0]=(0,100); z[1]=(50,0); z[2]=(180,0);
for(int n=3; n <= 9; ++n)
  z[n]=z[n-3]+(200,0);
path p=z[0]..z[1]---z[2]---z[3]
&z[3]..z[4]--z[5]::{up}z[6]
&z[6]::z[7]---z[8]..{up}z[9];
defaultpen(linewidth(1));
draw(p, grey);
dot(p);

real len=50;
for(int i = 0; i < z.length; ++i) {
  pair z=point(p,i);
  draw(z--z+len*dir(p,i,-1),red);
  draw(z--z+len*dir(p,i,1),blue+dashed);
  draw(z-len*dir(p,i)--z+len*dir(p,i),green+Dotted(defaultpen()));
}
generalities-fig144
Show generalities/fig1450.asy on Github.
Generated with Asymptote 3.00-0.
Categories : Examples 2D | Generalities
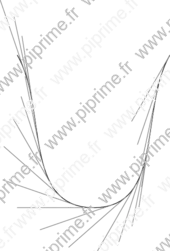
Tags : #Basis | #Path | #Full line
size(10cm,0);
import math;

path cle=unitcircle;
path curv=reverse((1.5,2){dir(-60)}..(2.5,0)..{dir(60)}(3.5,2));

draw(cle);
draw(curv);

pair pt_cle=point(cle, 1.35);
pair pt_dir_cle=dir(cle, 1.35);

drawline((pt_cle - pt_dir_cle), (pt_cle + pt_dir_cle), red);

pair pt_curv=point(curv, dirtime(curv, pt_dir_cle));

drawline((pt_curv - pt_dir_cle), (pt_curv + pt_dir_cle), blue);
generalities-fig145
Show generalities/fig1460.asy on Github.
Generated with Asymptote 3.00-0.
Categories : Examples 2D | Generalities
Tags : #Basis | #Transform/scale/shift/rotate | #Point/Dot | #Label | #Position
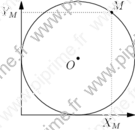
size(0,0);

pair O=(2cm,2cm);
path cle=shift(O)*scale(2cm)*unitcircle;
pair M=point(cle,.6);

dot("$O$",O,SW);
dot("$M$",M,unit(M-O));

draw(cle);
draw((0,0)--(0,4cm),Arrow);
draw((0,0)--(4cm,0),Arrow);

draw(Label("$X_M$",position=EndPoint),M--(xpart(M),0),dotted);
draw(Label("$Y_M$",position=EndPoint),M--(0,ypart(M)),dotted);
generalities-fig146
Show generalities/fig1470.asy on Github.
Generated with Asymptote 3.00-0.
Categories : Examples 2D | Generalities
Tags : #Basis | #Transform/scale/shift/rotate | #Circle
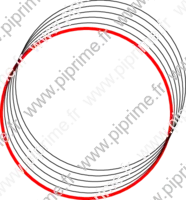
size(0,0);

path p= scale(3cm)*unitcircle;

draw(p,red+1mm);
draw(shift(1mm,2mm)*p);
draw(shift(2*(1mm,2mm))*p);
draw(shift(3*(1mm,2mm))*p);
draw(shift(4*(1mm,2mm))*p);
draw(shift(5*(1mm,2mm))*p);
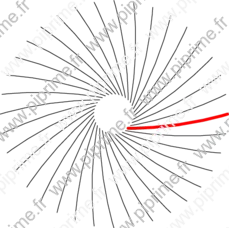
generalities-fig147
Show generalities/fig1480.asy on Github.
Generated with Asymptote 3.00-0.
Categories : Examples 2D | Generalities
Tags : #Basis | #Path | #Transform/scale/shift/rotate
size(0,0);

path p= (5mm,-5mm){right} .. (4cm,0);

for(int i=10; i<360; i+=10)
  draw(rotate(i)*p);

draw(p,red+1mm);
generalities-fig148

Show generalities/fig1490.asy on Github.
Generated with Asymptote 3.00-0.
Categories : Examples 2D | Generalities
Tags : #Basis | #Path | #Transform/scale/shift/rotate
size(6cm,0);

path p= (1,-1){right} .. (4,0);
pair O=(3,.25);

for(int i=10; i<360; i+=10)
  draw(rotate(i,O)*p);

dot(O,blue);
draw(p,red+1mm);
generalities-fig149
Show generalities/fig1500.asy on Github.
Generated with Asymptote 3.00-0.
Categories : Examples 2D | Generalities
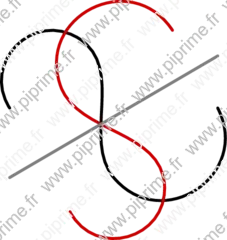
Tags : #Basis | #Path
size(8cm,0);

path curv=(0,0)..(1,1)..(1.5,-1)..(3,0);
pair A=(0,-1), B=(3,.75);

defaultpen(1mm);
draw(curv);
draw(reflect(A,B)*curv,.8red);
draw(A--B,grey);
generalities-fig150
Show generalities/fig1510.asy on Github.
Generated with Asymptote 3.00-0.
Categories : Examples 2D | Generalities
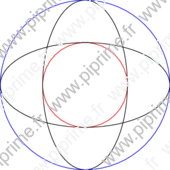
Tags : #Basis | #Path | #Transform/scale/shift/rotate
size(6cm,0);

path cle=unitcircle;

draw(cle,red);
draw(xscale(2)*cle);
draw(yscale(2)*cle);
draw(scale(2)*cle,blue);
generalities-fig151

Show generalities/fig1520.asy on Github.
Generated with Asymptote 3.00-0.
Categories : Examples 2D | Generalities
Tags : #Basis | #Path | #Transform/scale/shift/rotate | #Circle
size(8cm,0);

transform scale(pair center, real k)
{
  return shift(center)*scale(k)*shift(-center);
}

path cle=unitcircle;
pair A=(4,0);
draw(cle);

draw(scale(A,.5)*cle,red);
draw(scale(A,-.75)*cle,blue);

for (real t; t<length(cle); t+=1)
  draw(point(cle,t)--point(scale(A,-.75)*cle,t),dotted);

dot("$A$",A,N);
generalities-fig152
Show generalities/fig1530.asy on Github.
Generated with Asymptote 3.00-0.
Categories : Examples 2D | Generalities
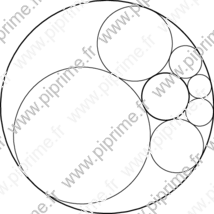
Tags : #Basis | #Path | #Transform/scale/shift/rotate | #Circle | #Function creation
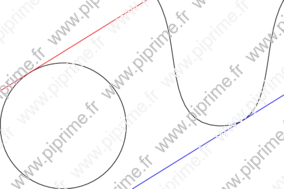
size(0,0);

pair inversion(pair O, real k, pair M)
{
  return (O + k*unit(M-O)/abs(M-O));
}

guide inversion(pair O, real k, path M)
{
  guide opath=inversion(O,k,point(M,0));
  for (real i=0; i<=length(M); i+=length(M)/100)
    opath = opath .. inversion(O,k,point(M,i));
  return opath .. cycle;
}

real u=10cm;
path [] p;
path A = scale(u)*unitcircle;
path B = scale(3)*A;
pair z = rotate(10)*(5u,0);


draw(inversion( z, 2*u^2, A ),linewidth(1pt));
draw(inversion( z, 2*u^2, B ),linewidth(1pt));

p[0] = shift(2u,0)*scale(u)*unitcircle;

for (int i=0; i<=5; ++i)
  {
    if (i!=0) p[i] = rotate(360/6)*p[i-1];
    draw(inversion( z, 2 (u^2), p[i] ));
  }
generalities-fig153
Show generalities/fig1540.asy on Github.
Generated with Asymptote 3.00-0.
Categories : Examples 2D | Generalities
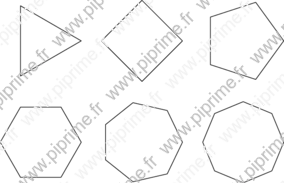
Tags : #Basis | #Path | #Function creation | #Loop/for/while
size(10cm,0);

path unitpolygon(int n)
{
  guide opath;
  for (int i=1; i<=n; ++i)
    opath=opath--rotate((i-1)*360/n)*E;
  return opath--cycle;
}

for (int i=3; i<9; ++i)
  draw(shift(2.5*(i%3),-2.5*quotient(i,3))*unitpolygon(i));
generalities-fig154
Show generalities/fig1550.asy on Github.
Generated with Asymptote 3.00-0.
Categories : Examples 2D | Generalities
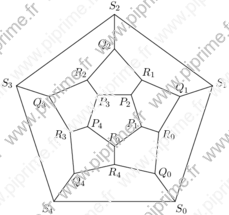
Tags : #Basis | #Array | #Path | #Loop/for/while | #Direction | #Label
size(0,0);

pair [] P, Q, R, S;
real u=1cm;

for (int i=0; i<=4; ++i)
  P[i] = rotate(i*360/5)*(0,-u);

P[5] = P[0];
for (int i=0; i<=4; ++i)
  Q[i] = 3*midpoint(P[i]--P[i+1]);

Q[5] = Q[0];
for (int i=0; i<=4; ++i)
  R[i] = 1/3*( Q[i] + Q[i+1] + P[i+1] );

R[5] = R[0];
for (int i=0; i<=5; ++i)
  S[i] = 1.5*Q[i];

for (int i=0; i<=4; ++i)
  {
    draw(P[i]   -- P[i+1]);
    draw(P[i+1] -- R[i]);
    draw(Q[i]   -- R[i]);
    draw(R[i]   -- Q[i+1]);
    draw(Q[i]   -- S[i]);
    draw(S[i]   -- S[i+1]);
    label(format("\small$P_%i$",i),P[i],-unit(P[i]));
    label(format("\small$Q_%i$",i),Q[i],rotate(60)*unit(Q[i]));
    label(format("\small$R_%i$",i),R[i],unit(R[i]));
    label(format("\small$S_%i$",i),S[i],unit(S[i]));
  }
generalities-fig155
Show generalities/fig1560.asy on Github.
Generated with Asymptote 3.00-0.
Categories : Examples 2D | Generalities
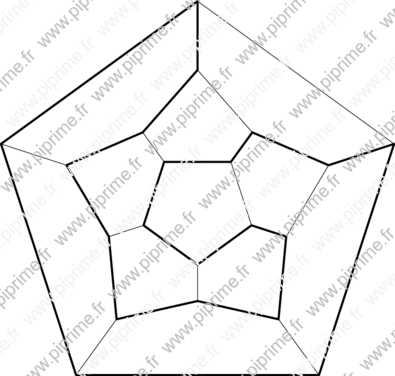
Tags : #Basis | #Array | #Path
size(0,0);

pair [] P, Q, R, S;
real u=2cm;

for (int i=0; i<=4; ++i)
  P[i] = rotate(i*360/5)*(0,-u);

P[5] = P[0];
for (int i=0; i<=4; ++i)
  Q[i] = 3*midpoint(P[i]--P[i+1]);

Q[5] = Q[0];
for (int i=0; i<=4; ++i)
  R[i] = 1/3*( Q[i] + Q[i+1] + P[i+1] );

R[5] = R[0];
for (int i=0; i<=5; ++i)
  S[i] = 1.5*Q[i];

for (int i=0; i<=4; ++i)
  {
    draw(P[i]   -- P[i+1]);
    draw(P[i+1] -- R[i]);
    draw(Q[i]   -- R[i]);
    draw(R[i]   -- Q[i+1]);
    draw(Q[i]   -- S[i]);
    draw(S[i]   -- S[i+1]);
  }

draw(P[2] -- P[3] -- P[4] -- P[0] -- P[1] --
     R[0] -- Q[0] -- R[4] -- Q[4] -- R[3]
     -- Q[3] -- R[2] -- Q[2] --
     S[2] -- S[3] -- S[4] -- S[0] -- S[1] --
     Q[1] -- R[1] -- cycle,
     linewidth(2bp));
generalities-fig156
Show generalities/fig1570.asy on Github.
Generated with Asymptote 3.00-0.
Categories : Examples 2D | Generalities
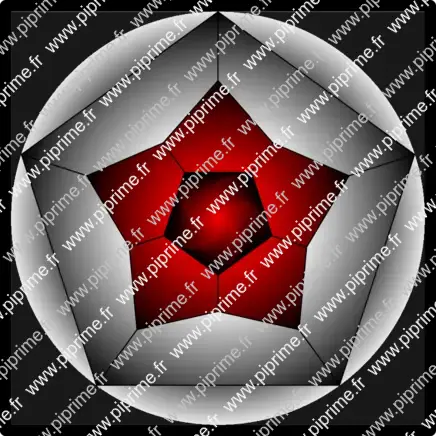
Tags : #Basis | #Array | #Loop/for/while | #Fill/Unfill | #Shading
size(0,0);

pair [] P, Q, R, S;
real u=2cm;

for (int i=0; i<=4; ++i)
  P[i] = rotate(i*360/5)*(0,-u);

P[5] = P[0];
for (int i=0; i<=4; ++i)
  Q[i] = 3*midpoint(P[i]--P[i+1]);

Q[5] = Q[0];
for (int i=0; i<=4; ++i)
  R[i] = 1/3*( Q[i] + Q[i+1] + P[i+1] );

R[5] = R[0];
for (int i=0; i<=5; ++i)
  S[i] = 1.5*Q[i];

fill(shift(-abs(S[0]),-abs(S[0]))*scale(2*abs(S[0]))*unitsquare,.2grey);

radialshade(scale(abs(S[0]))*unitcircle,lightgrey,(0,0),abs(S[0]),
            black,(0,0),abs(.85*midpoint(S[0]--S[1])));

P[6]=P[1];
for (int i=0; i<=4; ++i)
  {
    radialshade(S[i]--Q[i]--R[i]--Q[i+1]--S[i+1]--cycle,
                lightgrey,(0,0),abs(R[i]),
                black,(0,0),abs(S[i]));
    radialshade(R[i]--Q[i+1]--R[i+1]--P[i+2]--P[i+1]--cycle,
                .8red,(0,0),sqrt(1-(2-2cos(pi/5))/4)*u,
                black,(0,0),abs(Q[i+1]));
  }

for (real i=1; i>0; i-=.05)
  fill(rotate(90*(1-i))*scale(i)*(P[0]--P[1]--P[2]--P[3]--P[4]--cycle),
       (1-i)*red);

pen p=linewidth(1pt);
for (int i=0; i<=4; ++i)
  {
    draw(P[i]   -- P[i+1],p);
    draw(P[i+1] -- R[i],p);
    draw(Q[i]   -- R[i],p);
    draw(R[i]   -- Q[i+1],p);
    draw(Q[i]   -- S[i],p);
    draw(S[i]   -- S[i+1],p);
  }

shipout(bbox(0,black+4mm));
generalities-fig157
Show generalities/fig1580.asy on Github.
Generated with Asymptote 3.00-0.
Categories : Examples 2D | Generalities
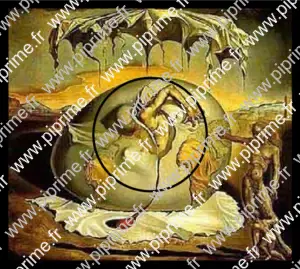
Tags : #Basis | #Graphic | #Layer | #Label
size(0,0);

label(graphic("dali.eps","width=10cm"));
layer();

draw(scale(2cm)*unitcircle,linewidth(.75mm));
shipout(bbox(.25cm,Fill));
generalities-fig158

Show generalities/fig1590.asy on Github.
Generated with Asymptote 3.00-0.
Categories : Examples 2D | Generalities
Tags : #Basis | #Graphic | #Label
size(0,0);

label(graphic("dali.eps","width=10cm, bb=60 60 235 205, clip=true"));
shipout(bbox(.25cm,Fill));
generalities-fig159
Show generalities/fig1600.asy on Github.
Generated with Asymptote 3.00-0.
Categories : Examples 2D | Generalities
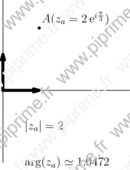
Tags : #Basis | #Number format | #Label | #Tex/latex features
size(0,6cm);

texpreamble("\usepackage{amsmath}
             \DeclareMathOperator{\e}{e}");

pair A=2*expi(pi/3);

draw((0,-2)--(0,2.5));
draw((0,0)--(1,0),linewidth(1mm),Arrow(2mm));
draw((0,0)--(3.5,0));
draw((0,0)--(0,1),linewidth(1mm),Arrow(2mm));

dot(Label("$A(z_a=2\e^{i\frac{\pi}{3}})$"),A,NE);
label(format("$\vert z_a\vert=%.1f$",length(A)),(.5,-1),E);
label(format("$\arg(z_a)\simeq%.4f$",angle(A)),(.5,-2),E);
generalities-fig160
Show generalities/fig1610.asy on Github.
Generated with Asymptote 3.00-0.
Categories : Examples 2D | Generalities
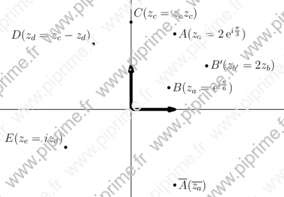
Tags : #Basis | #Number format | #Label | #Tex/latex features
size(10cm,0);

texpreamble("\usepackage{amsmath}
             \DeclareMathOperator{\e}{e}");

pair A=2*expi(pi/3);
pair B=expi(pi/6);
pair C=A*B;
pair D=C-B;
pair Bp=2*B;
pair E=I*D;

draw((0,-2)--(0,2.5));
draw((0,0)--(1,0),linewidth(1mm),Arrow(2mm));
draw((-3,0)--(3.5,0));
draw((0,0)--(0,1),linewidth(1mm),Arrow(2mm));

dot(Label("$A(z_a=2\e^{i\frac{\pi}{3}})$"),A);
dot(Label("$B(z_a=\e^{i\frac{\pi}{6}})$"),B);
dot(Label("$B'(z_{b'}=2z_b)$"),Bp);
dot(Label("$\overline{A}(\overline{z_a})$"),conj(A));
dot(Label("$C(z_c=z_a z_c)$"),C,NE);
dot(Label("$D(z_d=z_c-z_d)$"),D,NW);
dot(Label("$E(z_e=iz_d)$"),E,NW);
generalities-fig161

Show generalities/fig1620.asy on Github.
Generated with Asymptote 3.00-0.
Categories : Examples 2D | Generalities
Tags : #Basis | #Circle | #Loop/for/while | #Function creation
size(6cm,0);

pair A=2expi(pi/2);

pair homography(pair z)
{
  return (z^2+A)/(z+2);
}

guide image;
pair tpt;

draw(unitcircle);
for(real t=0; t<length(unitcircle);t+=.05)
  {
    tpt=homography(point(unitcircle,t));
    image=image..tpt;
    draw(point(unitcircle,t)--tpt,dotted);
  }
draw(image..cycle,red);
generalities-fig162
Show generalities/fig1630.asy on Github.
Generated with Asymptote 3.00-0.
Categories : Examples 2D | Generalities
Tags : #Basis
size(6cm,0);

path apath=(0,0)..(1,1)..(2,-1){dir(-90)};

draw(apath);

dot(apath);
dot(point(apath,length(apath)),.8green+8pt);
draw(point(apath,0)--point(apath,1)--point(apath,2),.8red);
draw(point(apath,0.5)--point(apath,1.5)--point(apath,2.5),.8blue);
generalities-fig163
Show generalities/fig1640.asy on Github.
Generated with Asymptote 3.00-0.
Categories : Examples 2D | Generalities
Tags : #Basis | #Path
size(8cm,0);

path apath=(0,0)..(1,1)..(2,.5){dir(0)};

draw(subpath(apath,0,length(apath)/2),1pt+.8red,EndPenMargin);
draw(subpath(apath,length(apath)/2,length(apath)),1pt+.8blue,BeginPenMargin);
generalities-fig164
Show generalities/fig1650.asy on Github.
Generated with Asymptote 3.00-0.
Categories : Examples 2D | Generalities
Tags : #Basis | #Path
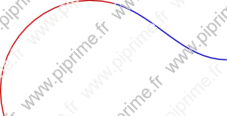
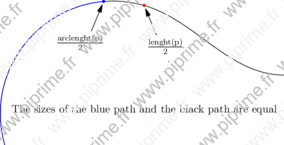
size(10cm,0);
texpreamble("\usepackage{amsmath}");

path p = (0,0)..(1,1)..(2,.5){dir(0)};
real al    = arclength(p);
real l     = length(p);
pair pt    = point(p,l/2);
pair apt   = arcpoint(p,al/2);

draw(p);
draw(subpath(p,0,arctime(p,al/2)),blue);
dot(pt,red);
dot(apt,blue);

arrow("$\frac{\text{lenght(p)}}{2}$",pt,SSE,1cm);
arrow("$\frac{\text{arclenght(p)}}{2}$",apt,SSW,1cm);
label("\small The sizes of the blue path and the black path are equal",(1,.25));
generalities-fig165
Show generalities/fig1660.asy on Github.
Generated with Asymptote 3.00-0.
Categories : Examples 2D | Generalities
Tags : #Basis | #Path | #Length
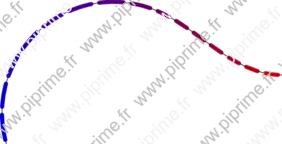
size(10cm,0);

path apath=(0,0)..(1,1)..(2,.5){dir(0)};
real l=length(apath);
real step=l/15;

for(real i=0; i<l-step; i+=step)
  draw(subpath(apath,i,i+step),4bp+(i/l*red+(l-i)/l*blue),PenMargins);
draw(apath);
generalities-fig166
Show generalities/fig1670.asy on Github.
Generated with Asymptote 3.00-0.
Categories : Examples 2D | Generalities
Tags : #Basis | #Path | #Length | #Margin
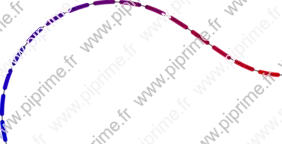
size(10cm,0);

path apath=(0,0)..(1,1)..(2,.5){dir(0)};
real l=arclength(apath);
real step=l/15;

path arcpath(path apath, real t1, real t2)
{
  return subpath(apath, arctime(apath,t1), arctime(apath,t2));
}

for(real i=0; i<l-step; i+=step)
  draw(arcpath(apath,i,i+step),4bp+(i/l*red+(l-i)/l*blue),PenMargins);
draw(apath);
generalities-fig167
Show generalities/fig1680.asy on Github.
Generated with Asymptote 3.00-0.
Categories : Examples 2D | Generalities
Tags : #Basis | #Path | #Label | #Length
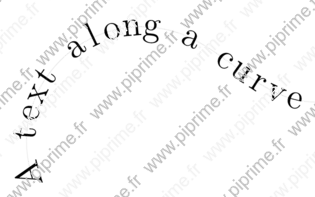
unitsize(5cm);

string text="A text along a curve";
path p=(0,0)..(1,1)..(2,0.5){dir(0)};
int n=length(text);
real at=0;
real step=arclength(p)/n;

for (int i=0; i<n; ++i){
  real t=arctime(p,at);
  label(rotate(degrees(angle(dir(p,t),false)))*scale(3)*baseline(substr(text,i,1)),point(p,t));
  at += step;
 }

draw(p,lightgrey);
generalities-fig168

Show generalities/fig1690.asy on Github.
Generated with Asymptote 3.00-0.
Categories : Examples 2D | Generalities
Tags : #Basis | #Path | #Length | #Label
import labelpath;

unitsize(5cm);
string text="\Huge A text along a curve";
path p=(0,0)..(1,1)..(2,0.5){dir(0)};

labelpath(text,p);
draw(p, lightgrey);
generalities-fig169
Show generalities/fig1700.asy on Github.
Generated with Asymptote 3.00-0.
Categories : Examples 2D | Generalities
Tags : #Basis | #Path
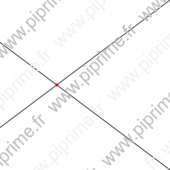
size(6cm,0);

path pth1=(0,-0.5)--(2,1);
path pth2=(0,0.5)--(2,-1);

draw(pth1^^pth2);

dot(intersectionpoint(pth1,pth2),red);
generalities-fig170
Show generalities/fig1710.asy on Github.
Generated with Asymptote 3.00-0.
Categories : Examples 2D | Generalities
Tags : #Basis | #Path
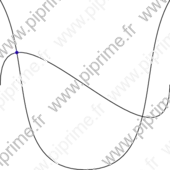
size(6cm,0);

path p = (0,0){up} .. (2cm,0){up};
path q = (0,1cm){dir(-60)}..(1cm,-1cm)..{dir(60)}(2cm,1cm);

draw(p^^q);
dot(intersectionpoint(p,q) , red);
dot(intersectionpoint(p,reverse(q)) , blue);
generalities-fig171
Show generalities/fig1720.asy on Github.
Generated with Asymptote 3.00-0.
Categories : Examples 2D | Generalities
Tags : #Basis | #Path
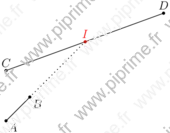
size(6cm,0);
import math;

pair A=(0,-.5), B=A+dir(45);
pair C=(0,1), D=C+5dir(20);

pair I=extension(A,B,C,D);

path AB=A--B;
path CD=C--D;

draw(AB^^CD);
dot("$I$",I,N,red);
draw(B--I,1pt+dotted);
dot("$A$",A,SE);
dot("$B$",B,SE);
dot("$C$",C,N);
dot("$D$",D,N);
generalities-fig172
Show generalities/fig1730.asy on Github.
Generated with Asymptote 3.00-0.
Categories : Examples 2D | Generalities
Tags : #Basis | #Path
size(6cm,0);
import math;

pair A=(0,-.5), B=A+dir(45);
pair C=(0,1)+2dir(20);
path cle=shift(C)*scale(1)*unitcircle;

pair I1=intersectionpoint(A--interp(A,B,2),cle);
pair I2=intersectionpoint(A--interp(A,B,10),cle);

path AB=A--B;

draw(AB^^cle);
dot(I1^^I2,red);
draw(B--I2,1pt+dotted);
generalities-fig173
Show generalities/fig1740.asy on Github.
Generated with Asymptote 3.00-0.
Categories : Examples 2D | Generalities
Tags : #Basis | #Path
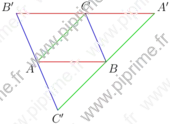
size(6cm,0);

path Line(pair A, pair B)
{
  return interp(A,B,-100000/arclength(A--B))--interp(A,B,100000/arclength(A--B));
}

path Parallel(pair A, pair dir)
{
  return Line(A,A+dir);
}

pair A=0, B=(1,0), C=(.7,.7);
draw(A--B, .8red);
draw(A--C, .8green);
draw(B--C, .8blue);

label("$A$",A,SW);
label("$B$",B,SE);
label("$C$",C,N);

pair Ap=intersectionpoint(Parallel(B, A-C), Parallel(C, A-B));
pair Bp=intersectionpoint(Parallel(A, B-C), Parallel(C, A-B));
pair Cp=intersectionpoint(Parallel(A, B-C), Parallel(B, A-C));

draw(Ap--Bp, .8red);
draw(Ap--Cp, .8green);
draw(Bp--Cp, .8blue);

label("$A'$",Ap,NE);
label("$B'$",Bp,NW);
label("$C'$",Cp,S);
generalities-fig174
Show generalities/fig1750.asy on Github.
Generated with Asymptote 3.00-0.
Categories : Examples 2D | Generalities
Tags : #Basis | #Path | #Intersection
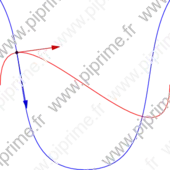
size(6cm,0);

path p = (0,0){up} .. (2cm,0){up};
path q = (0,1cm){dir(-60)}..(1cm,-1cm)..{dir(60)}(2cm,1cm);

draw(p, red);
draw(q, blue);
dot(intersectionpoint(p,q));
draw(point(p, intersect(p,q)[0])--postcontrol(p, intersect(p,q)[0]), .8red,Arrow);
draw(point(q, intersect(p,q)[1])--postcontrol(q, intersect(p,q)[1]), .8blue,Arrow);
generalities-fig175

Show generalities/fig1760.asy on Github.
Generated with Asymptote 3.00-0.
Categories : Examples 2D | Generalities
Tags : #Basis | #Graph | #Direction | #Path | #Fill/Unfill | #Shipout
import graph;
size(8cm,0);

path a = polargraph(new real(real t){return t;}, 0, 3pi, operator ..);
path b = polargraph(new real(real t){return 2t;}, 0, 3.75pi, operator ..);

real sharp=40;
path c=relpoint(a,1){relpoint(a,1)-postcontrol(a,length(a)-1)}..{dir(sharp)}relpoint(b,1);

fill(a..c..reverse(b)&cycle,0.8*red);
shipout(bbox(2mm, Fill(0.15*blue)));
generalities-fig176

Show generalities/fig1770.asy on Github.
Generated with Asymptote 3.00-0.
Categories : Examples 2D | Generalities
Tags : #Basis | #Circle | #Intersection | #Function creation
size(6cm,0);

import math;

pair A=(0,0), B=(1,.5);
path cle=shift(1.75,2.5)*unitcircle;
pair pt, ptp;

pair project(pair pt, pair A, pair B)
  {
    return extension(pt,pt-dir(90+degrees(A-B,false)),A,B);
  }

draw(A--B);
draw(cle);

for (real t=0; t<=4; t+=.01)
  {
    pt=point(cle,t);
    ptp=project(pt,A,B);
    dot(ptp, red);
    draw(pt--ptp,dotted);

  }
generalities-fig177
Show generalities/fig1780.asy on Github.
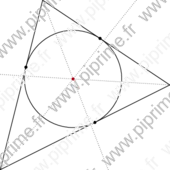
Generated with Asymptote 3.00-0.
Categories : Examples 2D | Generalities
Tags : #Basis | #Geometry | #Intersection
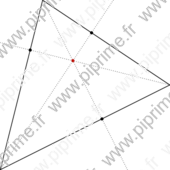
size(6cm,0);

import math;

pair A=(0,0), B=(1,.5), C=(.25,1);

pair project(pair pt, pair A, pair B)
  {
    return extension(pt,pt-dir(90+degrees(A-B,false)),A,B);
  }

pair ocenter(pair A, pair B, pair C)
  {
    return extension(A, project(A,B,C), B, project(B,A,C));
  }

draw(A--B--C--cycle);

pair orth=ocenter(A,B,C);
pair Ap=project(A,B,C);
pair Bp=project(B,A,C);
pair Cp=project(C,A,B);

dot(orth, red);
dot(Ap^^Bp^^Cp);
drawline(A, orth, dotted);
drawline(B, orth, dotted);
drawline(C, orth, dotted);
generalities-fig178
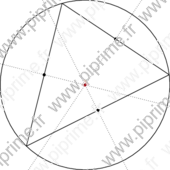
Show generalities/fig1790.asy on Github.
Generated with Asymptote 3.00-0.
Categories : Examples 2D | Generalities
Tags : #Basis | #Circle | #Geometry | #Intersection
size(6cm,0);

import math;

pair A=(0,0), B=(1,.5), C=(.25,1);

pair ccenter(pair A, pair B, pair C)
  {
    pair mAB=midpoint(A--B);
    pair mAC=midpoint(A--C);
    return extension(mAB, rotate(90,mAB)*A, mAC, rotate(90,mAC)*A);
  }

draw(A--B--C--cycle);

pair circ=ccenter(A,B,C);
pair mAB=midpoint(A--B);
pair mAC=midpoint(A--C);
pair mBC=midpoint(B--C);

dot(circ, red);
dot(mAB^^mAC^^mBC);
drawline(mAB, circ, dotted);
drawline(mAC, circ, dotted);
drawline(mBC, circ, dotted);
draw(shift(circ)*scale(abs(circ-A))*unitcircle);
generalities-fig179
Show generalities/fig1800.asy on Github.
Generated with Asymptote 3.00-0.
Categories : Examples 2D | Generalities
Tags : #Basis | #Circle | #Geometry | #Intersection
size(6cm,0);

import math;

pair A=(0,0), B=(1,.5), C=(.25,1);

pair project(pair pt, pair A, pair B)
  {
    return extension(pt,pt-dir(90+degrees(A-B,false)),A,B);
  }

pair icenter(pair A, pair B, pair C)
  {
    return extension(A, A+dir(A--B,A--C), B, B+dir(B--A,B--C));
  }

draw(A--B--C--cycle);

pair ins=icenter(A,B,C);
pair iAB=project(ins,A,B);
pair iAC=project(ins,A,C);
pair iBC=project(ins,B,C);

dot(ins, red);
dot(iAB^^iAC^^iBC);
drawline(A, ins, dotted);
drawline(B, ins, dotted);
drawline(C, ins, dotted);
draw(shift(ins)*scale(abs(ins-iAB))*unitcircle);
generalities-fig180
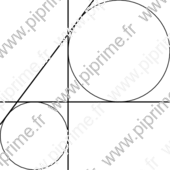
Show generalities/fig1810.asy on Github.
Generated with Asymptote 3.00-0.
Categories : Examples 2D | Generalities
Tags : #Basis | #Circle | #Geometry | #Intersection | #Function creation
size(6cm,0);
import math;

pair project(pair pt, pair A, pair B)
  {
    return extension(pt,pt-dir(90+degrees(A-B,false)),A,B);
  }


pair ecenter(pair A, pair B, pair C)
  {
    return extension(A, A+rotate(90)*dir(A--B,A--C), B, B+rotate(90)*dir(B--A,B--C));
  }

path ecircle(pair A, pair B, pair C)
  {
    return shift(ecenter(A,B,C))*scale(abs(ecenter(A,B,C)-project(ecenter(A,B,C),B,C)))*unitcircle;
  }

pair A=(0,0), B=(3,0), C=(3,4);
path tr=A--B--C--cycle;

draw(ecircle(A,B,C));
draw(ecircle(B,C,A));

pen p=linewidth(1pt);
drawline(A,B, p);
drawline(A,C, p);
drawline(B,C, p);
generalities-fig181
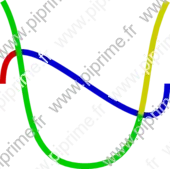
Show generalities/fig1830.asy on Github.
Generated with Asymptote 3.00-0.
Categories : Examples 2D | Generalities
Tags : #Basis | #Path
size(6cm,0);
defaultpen(2mm+linecap(0));

path p = (0,0){up} .. (2cm,0){up};
path q = (0,1cm){dir(-60)}..(1cm,-1cm)..{dir(60)}(2cm,1cm);


draw(firstcut(p,q).before, .8red);
draw(firstcut(p,q).after, .8blue);

draw(lastcut(q,p).before, .8green);
draw(lastcut(q,p).after, .8yellow);
generalities-fig182
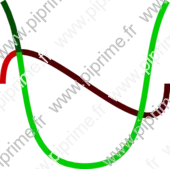
Show generalities/fig1840.asy on Github.
Generated with Asymptote 3.00-0.
Categories : Examples 2D | Generalities
Tags : #Basis | #Path
size(6cm,0);

defaultpen(2mm+linecap(0));

path p = (0,0){up} .. (2cm,0){up};
path q = (0,1cm){dir(-60)}..(1cm,-1cm)..{dir(60)}(2cm,1cm);

real[] ipq=intersect(p,q);
real[] iprq=intersect(p,reverse(q));

draw(subpath(p, 0, ipq[0]), .8red);
draw(subpath(p, ipq[0], iprq[0]), .5red);
draw(subpath(p, iprq[0], length(p)), .3red);

draw(subpath(reverse(q), 0, iprq[1]), .8green);
draw(subpath(reverse(q), iprq[1], length(q)-ipq[1]), .5green);
draw(subpath(reverse(q), length(q)-ipq[1], length(q)), .3green);
generalities-fig183
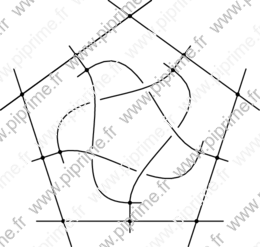
Show generalities/fig1850.asy on Github.
Generated with Asymptote 3.00-0.
Categories : Examples 2D | Generalities
Tags : #Basis | #Path
size(0,0);

defaultpen(linewidth(1bp));
real u=4cm;
pair A, B, C, D, E;
path p, q, r;

A = u*up;
p = interp(A, rotate(72)*A, -.2) -- interp(A, rotate(72)*A,1.2);
for(int i=0; i<=5; ++i)
  draw(rotate(72i)*p);

B = midpoint(A--rotate(72)*A );
C = .8*B;

p = B --- C .. (rotate(2*72)*C){right};
// On allonge le chemin p
p = (point(p,0) - 4mm*dir(p,0.001))
  --
  point(p,0)
  & p &
  point(p,2)
  --
  (point(p,2) + 4mm*dir(p,2));

E = intersectionpoint(p, rotate(72)*p);
q = firstcut(p,shift(E)*scale(2mm)*unitcircle).before;
r = lastcut(p,shift(E)*scale(2mm)*unitcircle).after;

for(int i=0; i<=4; ++i)
  {
    draw(rotate(72i)*q);
    draw( rotate(72i)*r);
    draw(rotate(72i)*A,linewidth(4bp));
    draw(rotate(72i)*B,linewidth(4bp));
    draw(rotate(72i)*C,linewidth(4bp));
  }
generalities-fig184
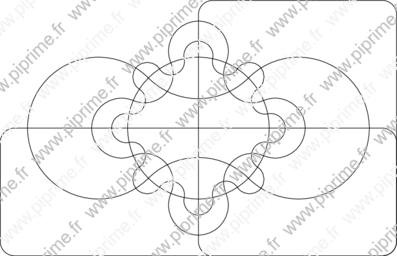
Show generalities/fig1860.asy on Github.
Generated with Asymptote 3.00-0.
Categories : Examples 2D | Generalities
Tags : #Basis | #Venn diagram | #Path | #Array
// Venn diagram // Diagramme de Venn
// Edwards' construction // Construction d'Edwards
import roundedpath;
size(14cm,0);

path [] EdVenn(int n)
{
  path [] opath;
  if (n>=1)
    opath.push(shift(-1.4,-.9)*roundedpath(xscale(2.8)*yscale(.9)*unitsquare,.1));
  if (n>=2)
    opath.push(shift(0,-.9)*roundedpath(xscale(1.4)*yscale(1.8)*unitsquare,.1));
  if (n>=3)
    opath.push(scale(.5)*unitcircle);
  for (int i=1; i<=n-3; ++i)
    {
      pair pcle=point(opath[2],1/(2^i)),
        ccle=intersectionpoint(pcle--(pcle-dir(opath[2],1/(2^i))), (0,0)--(1,0));
      path cle=shift(ccle)*scale(abs(pcle-ccle))*unitcircle;
      real[] p1=intersect(cle, opath[2]);
      path ocle=subpath(cle,-p1[0],p1[0]);
      guide tpath;
      real step=360/(2^i), a=0;
      for (int j=0; j<2^i; ++j)
        {
          tpath=tpath..rotate(a)*ocle;
          a+=step;
        }
      opath.push(tpath..cycle);
    }
    return opath;
}

draw(EdVenn(6));
generalities-fig185
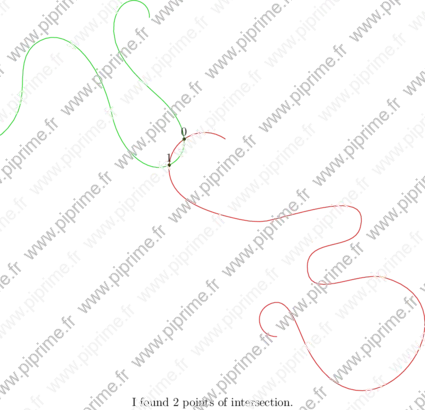
Show generalities/fig1870.asy on Github.
Generated with Asymptote 3.00-0.
Categories : Examples 2D | Generalities
Tags : #Basis | #Path | #Intersection
size(15cm,0);

srand(rand());
path p1 = randompath(9);
path p2 = randompath(8);
real Minx=min(min(p1).x,min(p2).x);
real Maxx=max(max(p1).x,max(p2).x);
real Miny=min(min(p1).y,min(p2).y);

pair[] inter=intersectionpoints(p1,p2);
int nb=inter.length;
for (int i=0 ; i<nb; ++i)
  {
    dot(inter[i]);
    label("$" + (string) i +"$", inter[i],N);
  }

draw(p1,.8red);
draw(p2,.8green);
label("I found " + (string) nb + " points of intersection.",((Maxx+Minx)/2,Miny),2S);
generalities-fig186
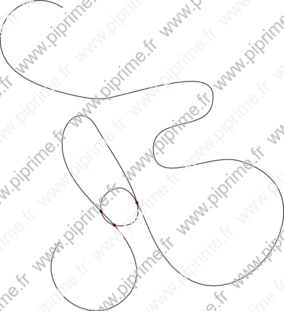
Show generalities/fig1880.asy on Github.
Generated with Asymptote 3.00-0.
Categories : Examples 2D | Generalities
Tags : #Basis | #Path | #Intersection
size(10cm,0);

pair[] self_intersection(path p, int n=100)
{
  pair[] rpair=new pair[];
  path tpath;
  real [] tpoint;
  real l=length(p);
  int i=1;
  for (real t1=0; t1<l ; t1+=l/n)
    {
      for (real t2=t1+2*l/n; t2<l; t2+=l/n)
        {
          tpoint=intersect(subpath(p,t1,t1+l/n),
                           subpath(p,t2,t2+l/n));
          if (tpoint.length == 2)
            {
              rpair[i]=point(subpath(p,t1,t1+l/n),tpoint[0]);
              ++i;
            }
        }
    }
  return rpair;
}

void dott(pair[] pt, pen p)
{
  for (int i=1 ; i<pt.length; ++i)
    {
      dot(pt[i], p);
    }
}

srand(rand());
path p = randompath(15);

pair[] inter=self_intersection(p);
dott(inter, .8red);
draw(p);
generalities-fig187
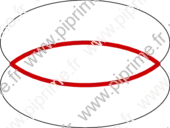
Show generalities/fig1890.asy on Github.
Generated with Asymptote 3.00-0.
Categories : Examples 2D | Generalities
Tags : #Basis | #Path | #Intersection | #Buildcycle | #Transform/scale/shift/rotate | #Circle
size(6cm,0);
path [] c;

c[1] = xscale(2)*unitcircle;
c[2] = shift((0,1))*c[1];
draw(c[1]^^c[2]);
draw(buildcycle(c[1],c[2]), .8red+4bp);
generalities-fig188
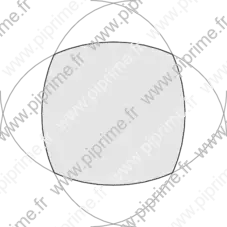
Show generalities/fig1900.asy on Github.
Generated with Asymptote 3.00-0.
Categories : Examples 2D | Generalities
Tags : #Basis | #Path | #Intersection | #Buildcycle | #Transform/scale/shift/rotate | #Array
size(8cm,0);

path a,b,c,d;
a = (-1,-.2){up} .. tension 1.2 .. (1,-.2){down};
transform r90=rotate(90);
b = r90*a;
c = r90*b;
d = r90*c;
path bound=buildcycle(a,b,c,d);
fill(bound, lightgrey);
draw(a^^b^^c^^d,grey);
draw(bound);
generalities-fig189
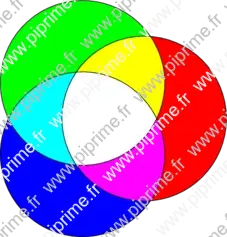
Show generalities/fig1910.asy on Github.
Generated with Asymptote 3.00-0.
Categories : Examples 2D | Generalities
Tags : #Basis | #Path | #Intersection | #Buildcycle | #Transform/scale/shift/rotate | #Circle | #Fill/Unfill
size(8cm,0);

path a,b,c;
a = shift(1,0)*scale(2)*unitcircle;
b = rotate(120)*a;
c = rotate(120)*b;

fill(a, red);
fill(b, green);
fill(c, blue);
fill(buildcycle(a,b), red + green);
fill(buildcycle(b,c), green + blue);
fill(buildcycle(c,a), blue + red);
fill(buildcycle(a,b,c), white);

draw(a^^b^^c);
generalities-fig190
Show generalities/fig1920.asy on Github.
Generated with Asymptote 3.00-0.
Categories : Examples 2D | Generalities
Tags : #Basis | #Path | #Circle | #Fill/Unfill
size(0,0);

path pt1=scale(2cm)*unitcircle;
path pt2=scale(1cm)*unitcircle;

filldraw(pt1^^pt2,yellow+.9white);
generalities-fig191
Show generalities/fig1930.asy on Github.
Generated with Asymptote 3.00-0.
Categories : Examples 2D | Generalities
Tags : #Basis | #Path | #Intersection | #Transform/scale/shift/rotate | #Circle
size(0,0);

path pt1=scale(2cm)*unitcircle;
path pt2=scale(1cm)*unitcircle;

filldraw(pt1^^pt2,evenodd+yellow+.9white);
generalities-fig192

Show generalities/fig1940.asy on Github.
Generated with Asymptote 3.00-0.
Categories : Examples 2D | Generalities
Tags : #Basis | #Path | #Intersection | #Transform/scale/shift/rotate | #Circle
size(0,0);

path pt1=scale(2cm)*unitcircle;
path pt2=scale(1cm)*unitcircle;
path pt3=shift(0,.5cm)*pt2;

filldraw(pt1^^pt2^^pt3,evenodd+yellow+.9white);
generalities-fig193

Show generalities/fig1950.asy on Github.
Generated with Asymptote 3.00-0.
Categories : Examples 2D | Generalities
Tags : #Basis | #Path | #Intersection | #Transform/scale/shift/rotate | #Circle
size(0,0);

path pt1=scale(2cm)*unitcircle;
path pt2=scale(1cm)*unitcircle;
path pt3=shift(0,1.5cm)*pt2;

filldraw(pt1^^pt2^^pt3,evenodd+yellow+.9white);
generalities-fig194

Show generalities/fig1960.asy on Github.
Generated with Asymptote 3.00-0.
Categories : Examples 2D | Generalities
Tags : #Basis | #Atexit
size(6cm);

void extra()
{
  label("Read the code to understand...",(0,0),white);
  plain.exitfunction();
}

atexit(extra);
fill(xscale(2)*unitcircle);
generalities-fig195
Show generalities/fig1970.asy on Github.
Generated with Asymptote 3.00-0.
Categories : Examples 2D | Generalities
Tags : #Basis | #Pattern
size(8cm,0);
import patterns;

add("hatchback",hatch(NW));
filldraw(xscale(2)*unitsquare,pattern("hatchback"));

add("r_hatchback",hatch(2.5mm,NW,.8red));
filldraw(shift(0,-2)*yscale(2)*unitsquare,pattern("r_hatchback"));

add("b_hatchback",hatch(NW,2.5mm+.8blue));
filldraw(shift(1,-2)*yscale(2)*unitsquare,pattern("b_hatchback"));
generalities-fig196
Show generalities/fig1980.asy on Github.
Generated with Asymptote 3.00-0.
Categories : Examples 2D | Generalities
Tags : #Label | #Object | #Picture
void enclose(picture pic=currentpicture, envelope e,
             Label[] L=new Label[],
             real xmargin=0, real ymargin=xmargin, pen p=currentpen,
             filltype filltype=NoFill, bool above=true)
{

  real H;
  real[] h;
  pic.add(new void (frame f, transform t) {
      frame[] d=new frame[];
      for (int i=0; i<L.length; ++i) {
        d[i]=newframe;
        Label LL=L[i].copy();
        add(d[i],t,LL);
        add(f,d[i]);
        h[i]=ypart(max(d[i])-min(d[i]));
        if(H < h[i]) H=h[i];
      }
      for (int i=0; i<L.length; ++i) {
        real emy=(H-h[i])/2;
        e(f,d[i],xmargin,ymargin+emy,p,filltype,above);
      }
    });
}

void box(picture pic=currentpicture, Label[] L=new Label[],
         real xmargin=0, real ymargin=xmargin, pen p=currentpen,
         filltype filltype=NoFill, bool above=true)
{
  enclose(pic,box,L,xmargin,ymargin,p,filltype,above);
}

box(new Label[] {
    Label("\begin{minipage}{3cm}Some text some text some text.\end{minipage}",(2.2cm,0)),
    Label("Hello.",0),
    Label("\begin{minipage}{3cm}Some text some text some
text some text some text some text some text.\end{minipage}",(5.4cm,0)),
    Label("Bye.\rule{0pt}{1.5cm}",(1cm,-3cm))
      });
geometry-fig001
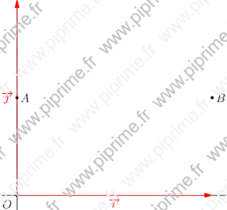
Show geometry/fig0010.asy on Github.
Generated with Asymptote 3.00-0.
Categories : Examples 2D | Geometry.asy
Tags : #Geometry | #Coords system | #Point | #Pair
size(8cm,0);
import geometry;

/*<asyxml><view file="modules/geometry.asy" type="" signature="struct coordsys"/></asyxml>*/
show(currentcoordsys);

pair a=(0,0.5), b=(1,0.5);
/*<asyxml><view file="modules/geometry.asy" type="" signature="struct point"/></asyxml>*/
point A=a, B=b;

dot("$A$",A);
dot("$B$",B);
geometry-fig002
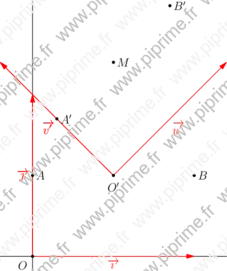
Show geometry/fig0020.asy on Github.
Generated with Asymptote 3.00-0.
Categories : Examples 2D | Geometry.asy
Tags : #Geometry | #Coords system | #Point | #Pair
size(8cm,0);
import geometry;

show(currentcoordsys);

pair a=(0,0.5), b=(1,0.5);
point A=a, B=b;

dot("$A$",A);
dot("$B$",B);

/*<asyxml><view file="modules/geometry.asy" type="coordsys" signature="cartesiansystem(pair,pair,pair)"/></asyxml>*/
currentcoordsys=cartesiansystem((0.5,0.5), i=(0.7,0.7), j=(-0.7,0.7));
show("$O'$", "$\vec{u'}$", "$\vec{v'}$", currentcoordsys, xpen=invisible);

point Ap=a;
/*<asyxml><view file="modules/geometry.asy" type="point" signature="point(coordsys,explicit point)"/></asyxml>*/
point Bp=point(currentcoordsys,B); // same as 'point Bp=b;'

dot("$A'$",Ap);
dot("$B'$",Bp);
dot("$M$",(Ap+Bp)/2);
geometry-fig003
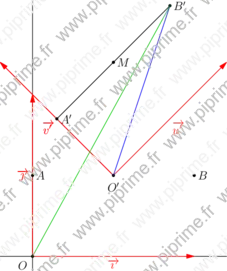
Show geometry/fig0030.asy on Github.
Generated with Asymptote 3.00-0.
Categories : Examples 2D | Geometry.asy
Tags : #Geometry | #Coords system | #Point | #Pair
size(8cm,0);
import geometry;

show(currentcoordsys);

pair a=(0,0.5), b=(1,0.5);
point A=a, B=b;

dot("$A$",A);
dot("$B$",B);

/*<asyxml><view file="modules/geometry.asy" type="coordsys" signature="cartesiansystem(pair,pair,pair)"/></asyxml>*/
currentcoordsys=cartesiansystem((0.5,0.5), i=(0.7,0.7), j=(-0.7,0.7));
show("$O'$", "$\vec{u'}$", "$\vec{v'}$", currentcoordsys, xpen=invisible);

point Ap=a;
/*<asyxml><view file="modules/geometry.asy" type="point" signature="point(coordsys,explicit point,real)"/></asyxml>*/
point Bp=point(currentcoordsys,B); // same as 'point Bp=b;'

dot("$A'$",Ap);
dot("$B'$",Bp);
dot("$M$",(Ap+Bp)/2);

draw(Ap--Bp);

/*<asyxml><view file="modules/geometry.asy" type="point" signature="locate(pair)"/></asyxml>*/
draw(locate((0,0))--Bp,blue);

/*<asyxml><view file="modules/geometry.asy" type="pair" signature="locate(point)"/></asyxml>*/
draw((0,0)--locate(Bp),0.8*green);
geometry-fig004
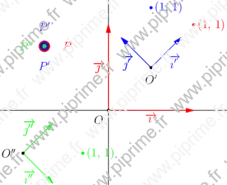
Show geometry/fig0040.asy on Github.
Generated with Asymptote 3.00-0.
Categories : Examples 2D | Geometry.asy
Tags : #Geometry | #Coords system | #Point | #Pair | #Point/Dot
size(8cm,0);
import geometry;

coordsys R=defaultcoordsys;
show(R);

coordsys Rp=cartesiansystem((0.5,0.5), i=(0.35,0.35), j=(-0.35,0.35));
show("$O'$", "$\vec{\imath'}$", "$\vec{\jmath'}$", Rp, ipen=blue, xpen=invisible);

coordsys Rpp=cartesiansystem((-1,-0.5),
                                      i=rotate(-90)*(0.35,0.35),
                                      j=rotate(-90)*(-0.35,0.35));
show("$O''$", "$\vec{\imath''}$", "$\vec{\jmath''}$", Rpp, ipen=green, xpen=invisible);


pair m=(1,1);

/*<asyxml><view file="modules/geometry.asy" type="point" signature="point(coordsys,pair,real)"/></asyxml>*/
dot("",point(R,m),red); // Same as 'dot("",m,red);'
dot("",point(Rp,m),blue);

point M=m;
/*<asyxml><view file="modules/geometry.asy" type="point" signature="point(coordsys,explicit point,real)"/></asyxml>*/
dot("",point(Rpp,M),green); // Works also with 'point'

pair p=(-0.75,0.75);
point P=point(R,(-0.75,0.75));

dot("$P$",P,2E,4mm+red);

// There are two methods for changing
// the coordinate system of a point (or a pair)

/*<asyxml><view file="modules/geometry.asy" type="pair" signature="/(pair,coordsys)"/></asyxml>*/
dot("$P'$",point(Rp,p/Rp),2S,3mm+blue); // Necessary for 'pair'
dot("$P'$",point(Rp,P/Rp),2N,3mm+blue); // but works with 'point' by casting.

/*<asyxml><view file="modules/geometry.asy" type="point" signature="changecoordsys(coordsys,point)"/></asyxml>*/
dot("$P''$",changecoordsys(Rpp,P),2W,1.5mm+green); // Useful for 'point'.
geometry-fig005
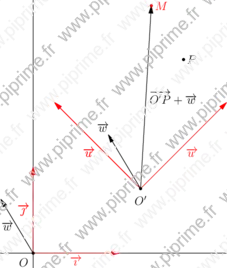
Show geometry/fig0050.asy on Github.
Generated with Asymptote 3.00-0.
Categories : Examples 2D | Geometry.asy
Tags : #Geometry | #Coords system | #Point | #Pair
import geometry;
size(8cm,0);

currentcoordsys=cartesiansystem((1.25,0.75),i=(1,1),j=(-1,1));
coordsys Rp=currentcoordsys;
coordsys R=defaultcoordsys;

show("$O$", "$\vec{\imath}$", "$\vec{\jmath}$", R);
show("$O'$","$\vec{u}$","$\vec{u}$", Rp, xpen=invisible);

vector w=(0.125,0.5);
point P=(1,0.5);

dot("$P$",P);
draw(Label("$\overrightarrow{w}$",EndPoint), origin()--origin()+w, Arrow);
draw("$\overrightarrow{O'P}+\overrightarrow{w}$",
     origin()--P+w, Arrow);

dot("$M$",P+w,red);

/*<asyxml><view file="modules/geometry.asy" type="pair" signature="locate(explicit vector)"/></asyxml>*/
draw("$\overrightarrow{w}$", (0,0)--locate(w), W,Arrow);
geometry-fig006
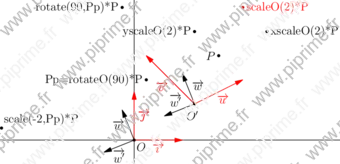
Show geometry/fig0060.asy on Github.
Generated with Asymptote 3.00-0.
Categories : Examples 2D | Geometry.asy
Tags : #Geometry | #Coords system | #Point | #Transform/scale/shift/rotate
import geometry;
size(12cm,0);

currentcoordsys=cartesiansystem((1.25,0.75),i=(1,0.5),j=(-1,1));
coordsys Rp=currentcoordsys;
coordsys R=defaultcoordsys;

show(Label("$O$",align=SE), "$\vec{\imath}$", Label("$\vec{\jmath}$",align=E), R);
show("$O'$", "$\vec{u}$", "$\vec{v}$", Rp, xpen=invisible);

vector w=(0.25,0.5);
point P=(1,0.5);

dot("$P$",P,W);
show("$\overrightarrow{w}$", w);

/*<asyxml><view file="modules/geometry.asy" type="transform" signature="rotateO(real)"/></asyxml>*/
point Pp=rotateO(90)*P;

dot("Pp=rotateO(90)*P", Pp, W);

dot("rotate(90,Pp)*P", rotate(90,Pp)*P, W);
/*<asyxml><view file="modules/geometry.asy" type="transform" signature="scale(real,point)"/></asyxml>*/
dot("scale(-2,Pp)*P", scale(-2,Pp)*P, NE);

/*<asyxml><view file="modules/geometry.asy" type="transform" signature="scaleO(real)"/></asyxml>*/
dot("scaleO(2)*P", scaleO(2)*P,red);
/*<asyxml><view file="modules/geometry.asy" type="transform" signature="xscaleO(real)"/></asyxml>*/
dot("xscaleO(2)*P", xscaleO(2)*P);
/*<asyxml><view file="modules/geometry.asy" type="transform" signature="yscaleO(real)"/></asyxml>*/
dot("yscaleO(2)*P", yscaleO(2)*P,W);

vector wp=rotateO(90)*w;

show("$\overrightarrow{w'}$", wp);

draw("$\overrightarrow{w}$", (0,0)--locate(w), W, Arrow);
draw("$\overrightarrow{w'}$", (0,0)--locate(wp), S, Arrow);
geometry-fig007
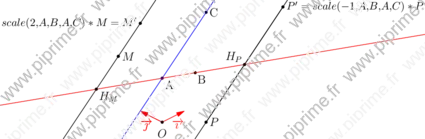
Show geometry/fig0070.asy on Github.
Generated with Asymptote 3.00-0.
Categories : Examples 2D | Geometry.asy
Tags : #Geometry | #Coords system | #Point | #Pair | #Transform/scale/shift/rotate
import geometry;
size(15cm);

currentcoordsys=cartesiansystem((0,0),i=(1,0.5),j=(-1,0.5));
coordsys R=currentcoordsys;
show(R, xpen=invisible);

point A=(2,2);
dot("A",A,SE);

point B=(3,1.5);
dot("B",B,SE);

point C=A+(4,2);
dot("C",C);

drawline(A,B,red);
drawline(A,C,blue);

/*<asyxml><view file="modules/geometry.asy" type="transform" signature="scale(real,point,point,point,point,bool)"/></asyxml>*/
transform t=scale(2,A,B,A,C);
/*<asyxml><view file="modules/geometry.asy" type="transform" signature="projection(point,point,point,point,bool)"/></asyxml>*/
transform proj=projection(A,B,A,C);

point M=(2,4);
point Mh=proj*M;
dot("$H_M$",Mh,SE);
dot("$M$",M);
point Mp=t*M;
dot("\small$scale(2,A,B,A,C)*M=M'$",Mp,W);
drawline(M,Mh);

point P=(1,-1);
point Ph=proj*P;
dot("$H_P$",Ph,NW);
drawline(P,Ph);
dot("$P$",P);

transform t=scale(-1,A,B,A,C);
point Pp=t*P;
dot("\small$P'=scale(-1,A,B,A,C)*P$",Pp);
draw(P--Pp);
geometry-fig008
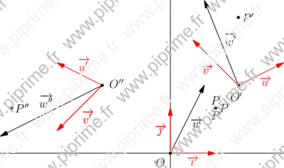
Show geometry/fig0080.asy on Github.
Generated with Asymptote 3.00-0.
Categories : Examples 2D | Geometry.asy
Tags : #Geometry | #Coords system | #Point | #Pair | #Vector
import geometry;
size(10cm,0);

currentcoordsys=cartesiansystem((1.5,1.5),i=(1,0.5),j=(-1,1));
coordsys Rp=currentcoordsys;
coordsys Rs=cartesiansystem((-1.5,1.5),i=(-1,0.5),j=(-1,-1));
coordsys R=defaultcoordsys;

show("$O$","$\vec{\imath}$", "$\vec{\jmath}$", R);
show("$O'$","$\vec{u}$","$\vec{v}$", Rp, xpen=invisible);
show("$O''$","$\vec{u'}$","$\vec{v'}$", Rs, xpen=invisible);

pair w=(0.75,1.5);
draw("$\overrightarrow{w}$",(0,0)--w,Arrow);

pair P=(1,1);
dot("$P$",P);
dot("$P$",point(Rp,P/Rp),N);
dot("$P$",point(Rs,P/Rs),S);

show("$\overrightarrow{w'}$", vector(w));
show("$\overrightarrow{w''}$", vector(Rs,w));

dot("$P'$",point(Rp,P));
dot("$P''$",point(Rs,P));
geometry-fig009
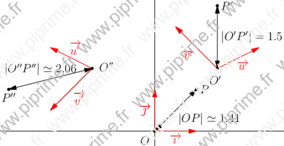
Show geometry/fig0090.asy on Github.
Generated with Asymptote 3.00-0.
Categories : Examples 2D | Geometry.asy
Tags : #Geometry | #Coords system | #Point | #Pair | #Vector
import geometry;
size(10cm,0);

currentcoordsys=cartesiansystem((1.5,1.5),i=(1,0.5),j=(-1,1));
coordsys Rp=currentcoordsys;
coordsys Rs=cartesiansystem((-1.5,1.5),i=(-1,0.5),j=(-1,-1));
coordsys R=defaultcoordsys;

show("$O$","$\vec{\imath}$", "$\vec{\jmath}$", R);
show("$O'$","$\vec{u}$","$\vec{v}$", Rp, xpen=invisible);
show("$O''$","$\vec{u'}$","$\vec{v'}$", Rs, xpen=invisible);

pair P=(1,1);
dot("$P$",P);

draw(format("$\vert OP\vert\simeq %.2f$",abs(P)),(0,0)--P,Arrows);

point Pp=P;
dot("$P'$",Pp);
vector wp=Pp;
show(format("$\vert O'P'\vert= %.2f$",abs(Pp)), wp, Arrows);

point Ps=point(Rs,P);
dot("$P''$",Ps,S);
vector ws=Ps;
show(format("$\vert O''P''\vert\simeq %.2f$",abs(Ps)), ws, Arrows);
geometry-fig010
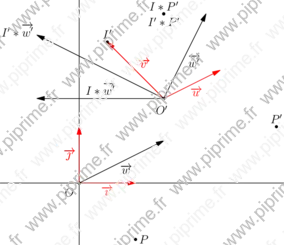
Show geometry/fig0100.asy on Github.
Generated with Asymptote 3.00-0.
Categories : Examples 2D | Geometry.asy
Tags : #Geometry | #Coords system | #Point | #Pair | #Vector
import geometry;
size(10cm,0);

currentcoordsys=cartesiansystem((1.5,1.5),i=(1,0.5),j=(-1,1));
coordsys Rp=currentcoordsys;
coordsys R=defaultcoordsys;

show("$O$","$\vec{\imath}$", "$\vec{\jmath}$", R);
show("$O'$", "$\vec{u}$", Label("$\vec{v}$",align=NE), Rp, xpen=invisible);

pair w=(1.5,0.75);
draw("$\overrightarrow{w}$",(0,0)--w,Arrow);

pair P=(1,-1);
dot("$P$",P);

show("$\overrightarrow{w'}$", vector(w));

dot("$P'$",point(Rp,P),N);

point Ip=I;
dot("$I'$",Ip,N);
dot("$I'*P'$",Ip*point(Rp,P),S);
dot("$I*P'$",I*point(Rp,P),N);

vector wp=Ip*vector(w);
show(Label("$I'*\overrightarrow{w'}$",EndPoint), wp);

vector foo=I*vector(w);
show("$I*\overrightarrow{w'}$", foo);
geometry-fig011
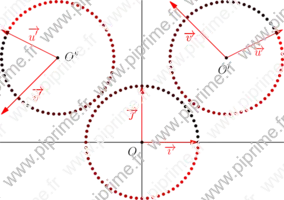
Show geometry/fig0110.asy on Github.
Generated with Asymptote 3.00-0.
Categories : Examples 2D | Geometry.asy
Tags : #Geometry | #Coords system | #Point
import geometry;
size(10cm,0);

currentcoordsys=cartesiansystem((1.5,1.5),i=(1,0.5),j=(-1,1));
coordsys Rp=currentcoordsys;
coordsys Rs=cartesiansystem((-1.5,1.5),i=(-1,0.5),j=(-1,-1));
coordsys R=defaultcoordsys;

show("$O$","$\vec{\imath}$", "$\vec{\jmath}$", R);
show("$O'$","$\vec{u}$","$\vec{v}$", Rp, xpen=invisible);
show("$O''$","$\vec{u'}$","$\vec{v'}$", Rs, xpen=invisible);

int n=64;
real step=2pi/n;

for (int i=0; i<n; ++i) {
  pen p=(i/n)*red;
  dot(point(R,R.polar(1,step*i)),p);
  dot(point(Rp,Rp.polar(1,step*i)),p);
  dot(point(Rs,Rs.polar(1,step*i)),p);
}
geometry-fig012
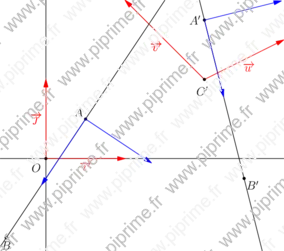
Show geometry/fig0120.asy on Github.
Generated with Asymptote 3.00-0.
Categories : Examples 2D | Geometry.asy
Tags : #Geometry | #Coords system | #Point | #Vector | #Line
import geometry;
size(10cm,0);

currentcoordsys=cartesiansystem((2,1),i=(1,0.5),j=(-1,1));
coordsys Rp=currentcoordsys;
coordsys R=defaultcoordsys;

show("$O$","$\vec{\imath}$", "$\vec{\jmath}$", R);
show("$O'$", "$\vec{u}$", "$\vec{v}$", Rp, xpen=invisible);

pair a=(0.5,0.5);
pair b=(-0.5,-1);

point A=point(R,a), B=point(R,b);
dot("$A$",A,NW); dot("$B$",B,S);
line l=line(A,B);

point Ap=a, Bp=b;
dot("$A'$",Ap,W); dot("$B'$",Bp,SE);
line lp=line(Ap,Bp);

draw(l^^lp);

draw(l.A--l.A+l.u,blue,Arrow);
draw(l.A--l.A+l.v,blue,Arrow);
draw(lp.A--lp.A+lp.u,blue,Arrow);
draw(lp.A--lp.A+lp.v,blue,Arrow);
geometry-fig013
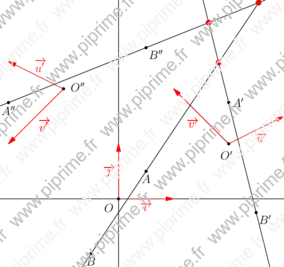
Show geometry/fig0130.asy on Github.
Generated with Asymptote 3.00-0.
Categories : Examples 2D | Geometry.asy
Tags : #Geometry | #Coords system | #Point | #Vector | #Line | #Intersection
import geometry; size(10cm,0); currentcoordsys=cartesiansystem((2,1),i=(1,0.5),j=(-1,1)); coordsys Rp=currentcoordsys; coordsys Rs=cartesiansystem((-1,2),i=(-1,0.5),j=(-1,-1)); coordsys R=defaultcoordsys; show("$O$","$\vec{\imath}$", "$\vec{\jmath}$", R); show("$O'$","$\vec{u}$","$\vec{v}$", Rp, xpen=invisible); show("$O''$", "$\vec{u'}$", "$\vec{v'}$", Rs, xpen=invisible); pair a=(0.5,0.5); pair b=(-0.5,-1); point A=point(R,a), B=point(R,b); dot("$A$",A,S); dot("$B$",B,S); line l=line(A,B); point Ap=a, Bp=b; dot("$A'$",Ap); dot("$B'$",Bp,SE); line lp=line(Ap,Bp); point As=point(Rs,a), Bs=point(Rs,b); dot("$A''$",As,S); dot("$B''$",Bs,SE); line ls=line(As,Bs); draw(l^^lp^^ls); dot(intersectionpoint(l,lp),2mm+red); dot(intersectionpoint(l,ls),2mm+red); dot(intersectionpoint(lp,ls),2mm+red);
geometry-fig014
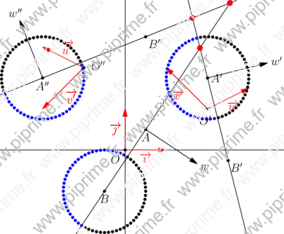
Show geometry/fig0140.asy on Github.
Generated with Asymptote 3.00-0.
Categories : Examples 2D | Geometry.asy
Tags : #Geometry | #Coords system | #Point | #Vector | #Line | #Intersection
include fig0130; point w=l.A+1.5*l.v; draw(Label("$w$",EndPoint),l.A--w,Arrow); point wp=lp.A+1.5*lp.v; draw(Label("$w'$",EndPoint),lp.A--wp,Arrow); point ws=ls.A+1.5*ls.v; draw(Label("$w''$",EndPoint),ls.A--ws,Arrow); int n=64; real step=2pi/n; for (int i=0; i<n; ++i) { point p=B+point(R,R.polar(1,step*i)); dot(p,sameside(p,w,l) ? black : blue); point p=Ap+point(Rp,Rp.polar(1,step*i)); dot(p,sameside(p,wp,lp) ? black : blue); point p=As+point(Rs,Rs.polar(1,step*i)); dot(p,sameside(p,ws,ls) ? black : blue); }
geometry-fig015
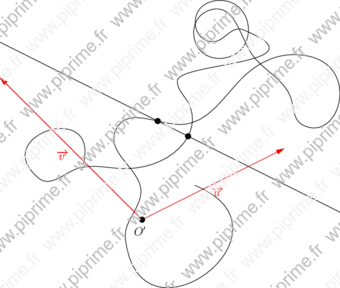
Show geometry/fig0150.asy on Github.
Generated with Asymptote 3.00-0.
Categories : Examples 2D | Geometry.asy
Tags : #Geometry | #Line | #Intersection | #Path
size(12cm,0); import geometry; import base_pi; dotfactor*=2; currentcoordsys=cartesiansystem((0,0),i=(1,0.5),j=(-1,1)); coordsys Rp=currentcoordsys; show("$O'$","$\vec{u}$","$\vec{v}$", Rp, xpen=invisible); path cle=randompath(20); draw(cle); point A=(0,1.5), B=(1,-0.5); line l=line(A,B); draw(l); /*<asyxml><view file="modules/geometry.asy" type="pair[]" signature="intersectionpoints(line,path)"/></asyxml>*/ dot(intersectionpoints(l,cle));
geometry-fig016
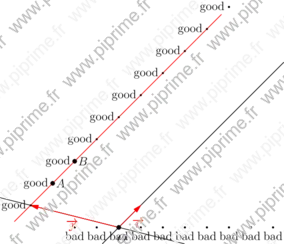
Show geometry/fig0160.asy on Github.
Generated with Asymptote 3.00-0.
Categories : Examples 2D | Geometry.asy
Tags : #Geometry | #Coords system | #Point | #Line | #Draw (2D)
size(10cm); import geometry; dotfactor*=1.5; linemargin = 5mm; currentcoordsys=cartesiansystem((2,1),i=(1,1),j=(-4,1)); show(currentcoordsys); point A=(1,1), B=(2,1); /*<asyxml><view file="modules/geometry.asy" type="" signature="struct line"/></asyxml>*/ line l1=line(A,B);/*<asyxml><view file="modules/geometry.asy" type="line" signature="line(point,bool,point,bool)"/></asyxml>*/ /*<asyxml><view file="modules/geometry.asy" type="void" signature="draw(picture,Label,line,bool,bool,align,pen,arrowbar,Label,marker)"/></asyxml>*/ draw(l1,red); dot("$A$",A); dot("$B$",B); for (int i=0; i<10; ++i){ pair bad=(i,l1.slope*i+l1.origin); point good=bad; draw(Label("bad",align=S),bad,linewidth(2bp)); draw(Label(good @ l1 ? "good":"bad",align=W),good,linewidth(2bp)); }
geometry-fig017
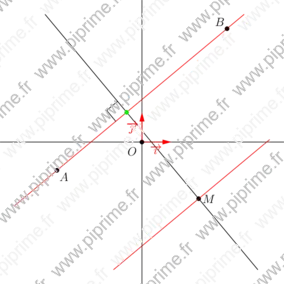
Show geometry/fig0170.asy on Github.
Generated with Asymptote 3.00-0.
Categories : Examples 2D | Geometry.asy
Tags : #Geometry | #Coords system | #Point | #Line | #Parallel | #Perpendicular | #Intersection | #Markers
unitsize(1cm); import geometry; dotfactor*=1.5; linemargin=5mm; // currentcoordsys=cartesiansystem((2,1),i=(1,0.5),j=(-1,1)); show(currentcoordsys); point A=(-3,-1), B=(3,4); line l1=line(A,B); draw(l1,red); dot("$A$",A,SE); dot("$B$",B,NW); point M=(2,-2); dot("$M$",M); /*<asyxml><view file="modules/geometry.asy" type="line" signature="parallel(point,line)"/></asyxml>*/ draw(parallel(M,l1),red); /*<asyxml><view file="modules/geometry.asy" type="line" signature="perpendicular(point,line)"/></asyxml>*/ line perp=perpendicular(M,l1); draw(perp); /*<asyxml><view file="modules/geometry.asy" type="point" signature="intersectionpoint(line,line)"/></asyxml>*/ point interp=intersectionpoint(l1,perp); dot(interp,green); /*<asyxml><view file="modules/geometry.asy" type="void" signature="markrightangle(picture,point,point,point,real,pen,margin,filltype)"/></asyxml>*/ markrightangle(l1.A,interp,rotate(180,interp)*M,size=5mm); draw(box((-5,-5),(5,5)),invisible);
geometry-fig018
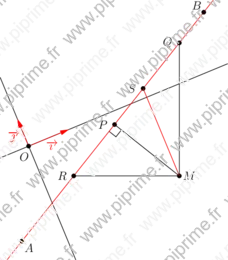
Show geometry/fig0180.asy on Github.
Generated with Asymptote 3.00-0.
Categories : Examples 2D | Geometry.asy
Tags : #Geometry | #Coords system | #Point | #Line | #Parallel | #Perpendicular | #Transform/scale/shift/rotate
unitsize(1cm); import geometry; dotfactor*=1.5; currentcoordsys=cartesiansystem((0,0),i=expi(pi/8)*(1.5,0),j=expi(pi/8)*(0,1)); show(currentcoordsys); point A=(-1,-3), B=(5,2); line l1=line(A,B); draw(l1,red); dot("$A$",A,SE); dot("$B$",B,NW); point M=(3,-3); dot("$M$",M); /*<asyxml><view file="modules/geometry.asy" type="transform" signature="projection(line)"/></asyxml>*/ point P=projection(l1)*M; dot("$P$",P,2W); draw(M--P); markrightangle(l1.A,P,M); /*<asyxml><view file="modules/geometry.asy" type="transform" signature="vprojection(line,bool)"/></asyxml>*/ point Q=vprojection(l1)*M; dot("$Q$",Q,2W); draw(M--Q); /*<asyxml><view file="modules/geometry.asy" type="transform" signature="hprojection(line,bool)"/></asyxml>*/ point R=hprojection(l1)*M; dot("$R$",R,2W); draw(M--R); /*<asyxml><view file="modules/geometry.asy" type="transform" signature="projection(line,line,bool)"/></asyxml>*/ point S=projection(l1,line((0,0),(0,1)))*M; dot("$S$",S,2W); draw(M--S,red); draw(box((-1,-4),(7,5)),invisible);
geometry-fig019
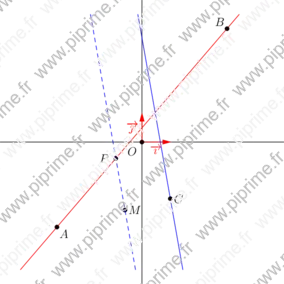
Show geometry/fig0190.asy on Github.
Generated with Asymptote 3.00-0.
Categories : Examples 2D | Geometry.asy
Tags : #Geometry | #Point | #Line | #Parallel | #Transform/scale/shift/rotate
unitsize(1cm); import geometry; dotfactor*=1.5; linemargin=5mm; // currentcoordsys=cartesiansystem((2,1),i=(1,0.5),j=(-1,1)); show(currentcoordsys); point A=(-3,-3), B=(3,4), C=(1,-2); line l1=line(A,B); draw(l1,red); dot("$A$",A,SE); dot("$B$",B,NW); /*<asyxml><view file="modules/geometry.asy" type="line" signature="line(real,point)"/></asyxml>*/ line l2=line(100,C); draw(l2,blue); dot("$C$",C); point M=relpoint(A--C,0.6); dot("$M$",M); /*<asyxml><view file="modules/geometry.asy" type="transform" signature="projection(line,line,bool)"/></asyxml>*/ point P=projection(l1,l2)*M; dot("$P$",P,2W); draw(line(M,P),blue+dashed); draw(box((-5,-5),(5,5)),invisible);
geometry-fig020
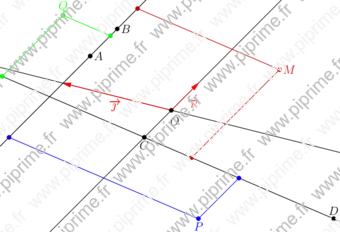
Show geometry/fig0200.asy on Github.
Generated with Asymptote 3.00-0.
Categories : Examples 2D | Geometry.asy
Tags : #Geometry | #Coords system | #Point | #Line | #Parallel
size(12cm); import geometry; dotfactor*=1.5; currentcoordsys=cartesiansystem((2,1),i=(1,1),j=(-4,1)); show(currentcoordsys); point A=(1,1), B=(2,1); line l1=line(A,B); draw(l1); dot("$A$",A); dot("$B$",B); point C=(-1,0), D=(-2,-2); line l2=line(C,D); draw(l2); dot("$C$",C,S); dot("$D$",D,N); point M=(2,-0.5); dot("$M$",M,0.8*red); /*<asyxml><view file="modules/geometry.asy" type="point[]" signature="sameside(point,line,line)"/></asyxml>*/ point[] Ms=sameside(M,l1,l2); draw(M--Ms[0]^^M--Ms[1],0.8red); dot(Ms[0]^^Ms[1],0.8red); point P=(-3,-1); dot("$P$",P,S,blue); point[] Ps=sameside(P,l1,l2); draw(P--Ps[0]^^P--Ps[1],blue); dot(Ps[0]^^Ps[1],blue); point Q=(2,1.5); dot("$Q$",Q,N,green); point[] Qs=sameside(Q,l1,l2); draw(Q--Qs[0]^^Q--Qs[1],green); dot(Qs[0]^^Qs[1],green);
geometry-fig021
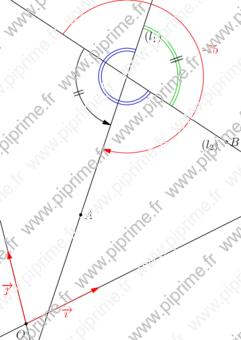
Show geometry/fig0210.asy on Github.
Generated with Asymptote 3.00-0.
Categories : Examples 2D | Geometry.asy
Tags : #Geometry | #Coords system | #Line | #Markers
size(12cm); import geometry; currentcoordsys=cartesiansystem((2,1),i=(1,0.5),j=(-0.25,1)); show(currentcoordsys); point A=(1,1); line l1=line(45,A); draw("$(l_1)$",l1); dot("$A$",A); point B=(3,1); line l2=line(-60,B); draw("$(l_2)$",l2); dot("$B$",B); markangleradiusfactor*=5; /*<asyxml><view file="modules/geometry.asy" type="void" signature="markangle(picture,Label,int,real,real,line,line,arrowbar,pen,filltype,margin,marker)"/></asyxml>*/ markangle(2,l2,l1,0.8*green,StickIntervalMarker(i=1,n=2)); markangle(2,radius=-0.5*markangleradius(), l2,l1,0.8*blue); markangle(reverse(l2),reverse(l1),Arrow,StickIntervalMarker(i=1,n=2)); /*<asyxml><view file="modules/geometry.asy" type="real" signature="sharpdegrees(line,line)"/></asyxml>*/ markangle((string) sharpdegrees(l2,l1), radius=-1.5*markangleradius(), reverse(l2),l1,Arrow,red);
geometry-fig022
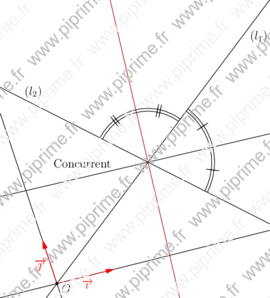
Show geometry/fig0220.asy on Github.
Generated with Asymptote 3.00-0.
Categories : Examples 2D | Geometry.asy
Tags : #Geometry | #Coords system | #Line | #Markers | #Intersection
unitsize(2cm); import geometry; currentcoordsys=cartesiansystem((2,1),i=(1,0.25),j=(-0.25,.75)); show(lo=Label("$O$",align=SE+0.5E), currentcoordsys); pair A=(1,1), B=(2,2); line l1=line(A,B); draw("$(l_1)$",l1); line l2=rotate(100,(3,3))*l1; draw("$(l_2)$",l2); write(locate(intersectionpoint(l1,l2))); /*<asyxml><view file="modules/geometry.asy" type="line" signature="bisector(line,line,real,bool)"/></asyxml>*/ line bis=bisector(l1,l2); draw(bis); line Bis=bisector(l1,l2,90); draw(Bis,0.8*red); markangleradiusfactor*=5; /*<asyxml><view file="modules/geometry.asy" type="void" signature="markangle(picture,Label,int,real,real,line,line,arrowbar,pen,filltype,margin,marker)"/></asyxml>*/ markangle(2, l1, l2, StickIntervalMarker(2,2,true)); markangle(2, reverse(l2), l1, radius=1.25*markangleradius(), StickIntervalMarker(2,1,true)); /*<asyxml><view file="modules/geometry.asy" type="bool" signature="concurrent(...line[])"/></asyxml>*/ if (concurrent(bis,l1,l2,Bis)) label("Concurrent",(3,3), dir(135)); draw(box(locate((-1,0)),locate((5,5))),invisible);
geometry-fig023
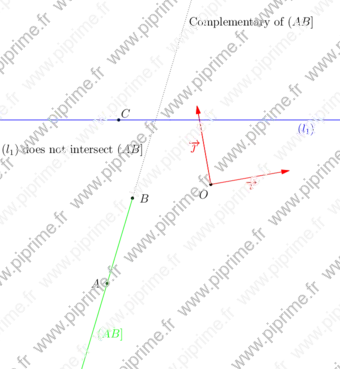
Show geometry/fig0230.asy on Github.
Generated with Asymptote 3.00-0.
Categories : Examples 2D | Geometry.asy
Tags : #Geometry | #Coords system | #Line | #Intersection
import geometry; size(12cm,0); currentcoordsys=cartesiansystem((2,1),i=expi(pi/18)*(1,0),j=expi(pi/18)*(0,1)); show(currentcoordsys,xpen=invisible); point A=(-1.5,-1); point C=(-1,1); point B=(-1,0); dot("$A$", A, 2W); dot("$B$", B, 2E); line l1=hline()+C; draw("$(l_1)$", l1, blue); dot("$C$", C, NE); line l2=line(A, B, false); draw(Label("$(AB]$",Relative(.25),SE), l2, green); /*<asyxml><view file="modules/geometry.asy" type="line" signature="complementary(explicit line)"/></asyxml>*/ draw("Complementary of $(AB]$", complementary(l2), dotted+roundcap); point p=intersectionpoint(l1,l2); /*<asyxml><view file="modules/geometry.asy" type="bool" signature="defined(pair)"/></asyxml>*/ string s="$(l_1)$" + (defined(p) ? " intersects " : " does not intersect ") + "$(AB]$"; label(s, A+1.75*l2.u,W); draw(box(locate((-2,-2)),locate((2,2))), invisible);
geometry-fig024
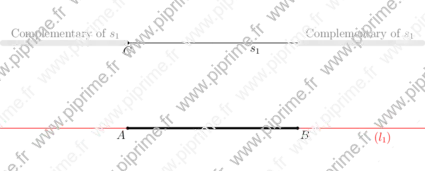
Show geometry/fig0240.asy on Github.
Generated with Asymptote 3.00-0.
Categories : Examples 2D | Geometry.asy
Tags : #Geometry | #Coords system | #Line | #Segment | #Draw (2D)
import geometry; size(15cm,0); // currentcoordsys=cartesiansystem((2,1),i=(1,0.25),j=(-0.25,.75)); // show(lj=Label("$\vec{\jmath}$",EndPoint), currentcoordsys); point A=(-1,-0.5); point B=(1,-0.5); point C=(-1,0.5); line l1=line(A,B); draw("$(l_1)$",l1,red); /*<asyxml><view file="modules/geometry.asy" type="" signature="struct segment"/></asyxml>*/ segment s=segment(A,B); draw(s, linewidth(2bp)); dot("$A$", A, SW); dot("$B$", B, SE); dot("$C$", C, S); segment s1=parallel(C,s); draw(Label("$s_1$",Relative(0.75)),s1); Label lt=Label("Complementary of $s_1$",Relative(0.5),align=N,grey); Label[] L={lt, lt}; /*<asyxml><view file="modules/geometry.asy" type="line[]" signature="complementary(explicit segment)"/></asyxml>*/ line[] cs1=complementary(s1); /*<asyxml><view file="modules/geometry.asy" type="void" signature="draw(picture,Label[],line[],align,pen,arrowbar,Label,marker)"/></asyxml>*/ draw(L, cs1, 2mm+lightgrey); draw(box(locate((-2.5,-1)),locate((2.5,1))), invisible);
geometry-fig025
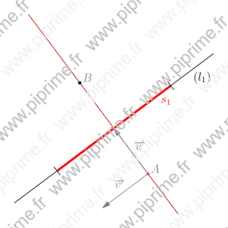
Show geometry/fig0250.asy on Github.
Generated with Asymptote 3.00-0.
Categories : Examples 2D | Geometry.asy
Tags : #Geometry | #Line | #Segment | #Perpendicular
unitsize(2cm); import geometry; linemargin=5mm; // currentcoordsys=cartesiansystem((2,1),i=(1,0.25),j=(-0.25,.75)); // show(li=Label("$\vec{\imath}$",align=S,EndPoint), currentcoordsys); point A=(-1,-1), B=(1,0.5); line l1=line(A,B); draw("$(l_1)$",l1); draw("$s_1$",(segment) l1, 2pt+red, marker(stickframe,markuniform(2,true))); /*<asyxml><view file="modules/geometry.asy" type="line" signature="bisector(segment,real)"/></asyxml>*/ line bis=bisector((segment) l1); draw(bis,red); /*<asyxml><view file="modules/geometry.asy" type="void" signature="show(picture,line,pen)"/></asyxml>*/ show(bis,grey); /*<asyxml><view file="modules/geometry.asy" type="point" signature="point(line,real)"/></asyxml>*/ dot(point(bis,1.5)); draw(box(locate((-2,-2)),locate((2,2))),invisible);
geometry-fig026
Show geometry/fig0260.asy on Github.
Generated with Asymptote 3.00-0.
Categories : Examples 2D | Geometry.asy
Tags : #Geometry | #Path | #Point | #Pair
import geometry; size(5cm,0); point M=(1,1); point N=(0.25,0.28); point P=(0.75,0.66); path g=origin--M; line l=line(origin,M); pen p=linewidth(5mm); draw(l,p); dot(N,p+red); dot(N,blue); dot(P,p+red); dot(P,blue); draw(box(origin,(1,1)),invisible); /*<asyxml><view file="modules/geometry.asy" type="bool" signature="@(point,line)"/></asyxml>*/ write(N@l);// Return 'false' /*<asyxml><view file="modules/geometry.asy" type="bool" signature="onpath(picture,path,point,pen)"/></asyxml>*/ write(onpath(g,N,p));// Return 'true' write(onpath(g,P,p));// Return 'false'
geometry-fig027
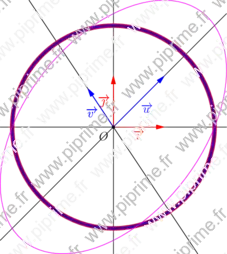
Show geometry/fig0270.asy on Github.
Generated with Asymptote 3.00-0.
Categories : Examples 2D | Geometry.asy
Tags : #Geometry | #Coords system | #Circle | #Ellipse | #Path
import geometry; size(8cm,0); currentcoordsys=cartesiansystem((0,0),i=(1,1),j=(-0.5,.75)); show("","$\vec{u}$", "$\vec{v}$", currentcoordsys, ipen=blue); show(defaultcoordsys); point A=(0,0); real R=2; /*<asyxml><view file="modules/geometry.asy" type="" signature="struct circle"/></asyxml>*/ circle C=circle(A,R); draw(C,1.5mm+red); circle Cp=circle(point(defaultcoordsys,A),R); draw(Cp,0.75mm+blue); // One can draw in the 'currentcoordsys' a circle definided in // the 'defaultcoordsys' /*<asyxml><view file="modules/geometry.asy" type="path" signature="*(coordsys,path)"/></asyxml>*/ draw(currentcoordsys*Cp, red+blue);
geometry-fig028
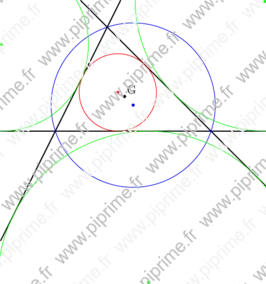
Show geometry/fig0280.asy on Github.
Generated with Asymptote 3.00-0.
Categories : Examples 2D | Geometry.asy
Tags : #Geometry | #Point | #Clip | #Circle
import geometry; size(10cm); // currentcoordsys=cartesiansystem((2,1),i=(1,0.5),j=(-0.25,0.75)); // show(currentcoordsys); point A=(-1,0), B=(2,0), C=(0,2); draw(line(A,B), linewidth(bp)); draw(line(A,C), linewidth(bp)); draw(line(B,C), linewidth(bp)); /*<asyxml><view file="modules/geometry.asy" type="circle" signature="circle(point,point,point)"/></asyxml>*/ circle cc=circle(A,B,C); draw(cc, blue); dot(cc.C, blue); /*<asyxml><view file="modules/geometry.asy" type="circle" signature="incircle(point,point,point)"/></asyxml>*/ circle ic=incircle(A,B,C); draw(ic, red); dot(ic.C, red); /*<asyxml><view file="modules/geometry.asy" type="circle" signature="excircle(point,point,point)"/></asyxml>*/ circle ec=excircle(A,B,C); /*<asyxml><view file="modules/geometry.asy" type="void" signature="clipdraw(picture,Label,path,align,pen,arrowbar,arrowbar,real,real,Label,marker)"/></asyxml>*/ clipdraw(ec, green); dot(ec.C, green); ec=excircle(A,C,B); clipdraw(ec, green); dot(ec.C, green); ec=excircle(C,B,A); clipdraw(ec, green); dot(ec.C, green); dot("G",centroid(A,B,C),NE); // Enlarge the bounding box of the current picture // draw(box((-2.5,-3), (3.5,3.5)));
geometry-fig029
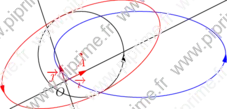
Show geometry/fig0290.asy on Github.
Generated with Asymptote 3.00-0.
Categories : Examples 2D | Geometry.asy
Tags : #Geometry | #Coords system | #Transform/scale/shift/rotate | #Ellipse | #Circle
import geometry; size(8cm,0); currentcoordsys=cartesiansystem((2,1),i=(1,0.5),j=(-0.25,.75)); show(currentcoordsys); point A=(1,1); dot("$A$",A,S,red); real R=2; circle C=circle(A,R); draw(C,Arrow); /*<asyxml><view file="modules/geometry.asy" type="ellipse" signature="*(transform,circle)"/></asyxml>*/ ellipse el=xscale(2)*C; draw(el,blue,Arrow); // /*<asyxml><view file="modules/geometry.asy" type="transform" signature="xscale(real,point)"/></asyxml>*/ ellipse el=xscale(2,A)*C; draw(el,red,Arrow);
geometry-fig030
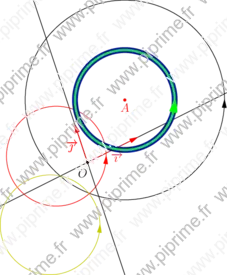
Show geometry/fig0300.asy on Github.
Generated with Asymptote 3.00-0.
Categories : Examples 2D | Geometry.asy
Tags : #Geometry | #Coords system | #Transform/scale/shift/rotate | #Ellipse | #Circle
import geometry; size(8cm,0); currentcoordsys=cartesiansystem((2,1),i=(1,0.5),j=(-0.25,.75)); show(currentcoordsys); point A=(1,1); dot("$A$",A,S,red); real R=2; circle C=circle(A,R); draw(C,Arrow); /*<asyxml><view file="modules/geometry.asy" type="ellipse" signature="*(transform,circle)"/></asyxml>*/ draw(scale(0.5)*C,red,Arrow); draw(scale(0.5,A)*C,2mm+0.8*blue); /*<asyxml><view file="modules/geometry.asy" type="circle" signature="/(explicit circle,real)"/></asyxml>*/ draw(C/2,0.75mm+green,Arrow(4mm)); // Note that the point 'point(C,0)' is always at the same place relatively to 'C'. draw(rotateO(180)*C/2,0.8*yellow,Arrow);
geometry-fig031
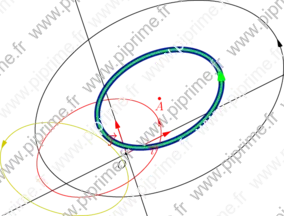
Show geometry/fig0310.asy on Github.
Generated with Asymptote 3.00-0.
Categories : Examples 2D | Geometry.asy
Tags : #Geometry | #Coords system | #Transform/scale/shift/rotate | #Ellipse | #Circle
import geometry; size(10cm,0); currentcoordsys=cartesiansystem((2,1),i=(1,0.5),j=(-0.25,.75)); show(currentcoordsys); point A=(1,1); dot("$A$",A,S,red); real a=3, b=2; ellipse el=ellipse(A,a,b,0); draw(el,Arrow); /*<asyxml><view file="modules/geometry.asy" type="ellipse" signature="*(transform,ellipse)"/></asyxml>*/ draw(scale(0.5)*el,red,Arrow); draw(scale(0.5,A)*el,2mm+0.8*blue); /*<asyxml><view file="modules/geometry.asy" type="ellipse" signature="/(ellipse,real)"/></asyxml>*/ draw(el/2,0.75mm+green,Arrow(4mm)); // Note that the point 'point(el,0)' is always at the same place relatively to 'el'. draw(rotateO(135)*el/2,0.8*yellow,Arrow);
geometry-fig032
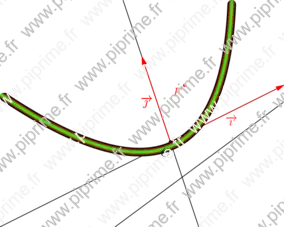
Show geometry/fig0320.asy on Github.
Generated with Asymptote 3.00-0.
Categories : Examples 2D | Geometry.asy
Tags : #Geometry | #Coords system | #Parabola
import geometry; size(10cm,0); currentcoordsys=cartesiansystem((2,1),i=(1,0.5),j=(-0.25,.75)); show(currentcoordsys); point F=(0.25,0.5); dot("$F$",F,SW,red); // Enlarge the bounding box of the current picture draw(box(locate((-1.5,0)),locate((1,1))), invisible); line l=rotateO(10)*line((0,-0.4),(1,-0.4)); draw(l); /*<asyxml><view file="modules/geometry.asy" type="parabola" signature="parabola(point,line)"/></asyxml>*/ parabola p=parabola(F,l); draw(p,linewidth(3mm)); /*<asyxml><view file="modules/geometry.asy" type="parabola" signature="parabola(point,point)"/></asyxml>*/ draw(parabola(p.F,p.V),2mm+red); /*<asyxml><view file="modules/geometry.asy" type="parabola" signature="parabola(point,real,real)"/></asyxml>*/ draw(parabola(p.F,p.a,p.angle),1mm+green);
geometry-fig033
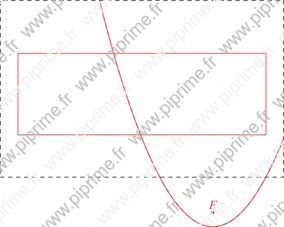
Show geometry/fig0330.asy on Github.
Generated with Asymptote 3.00-0.
Categories : Examples 2D | Geometry.asy
Tags : #Geometry | #Draw (2D) | #Clip | #Deferred drawing | #Parabola
import geometry; size(10cm); point F=(2,-1.5); dot("$F$",F,N,red); // Enlarge the bounding box of the current picture. draw(box((-1,-1),(3,1.5)),dashed);//,invisible); parabola p=parabola(F,0.2,90); // Define the bounding box to draw the parabola. // Try finalbounds(); to determine the final bounding box. p.bmin=(-0.75,-0.4); p.bmax=(2.75,0.75); draw(box(p.bmin,p.bmax),red); draw(p,dashed);/* Defered drawing to adjust the path to the final bounding box.*/ draw((path)p,red); /* The path of 'p' is restricted to the box whose the corners are p.bmin, p.bmax.*/
geometry-fig034
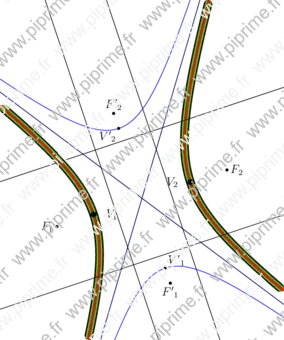
Show geometry/fig0340.asy on Github.
Generated with Asymptote 3.00-0.
Categories : Examples 2D | Geometry.asy
Tags : #Geometry | #Draw (2D) | #Clip | #Deferred drawing | #Hyperbola | #Line
import geometry; size(10cm,0); // currentcoordsys=cartesiansystem((2,1),i=(1,0.5),j=(-0.25,.75)); // show(currentcoordsys); point F1=(1,0); point F2=(4,1); dot("$F_1$",F1,W); dot("$F_2$",F2); // Enlarge the bounding box of the current picture draw(box((0,-2), (5,4)), invisible); /*<asyxml><view file="modules/geometry.asy" type="hyperbola" signature="hyperbola(point,point,real,bool)"/></asyxml>*/ hyperbola h=hyperbola(F1, F2, 0.9); draw(h, linewidth(3mm)); draw(h.A1, grey); draw(h.A2, grey); draw(h.D1); draw(h.D2); /*<asyxml><view file="modules/geometry.asy" type="hyperbola" signature="hyperbola(point,real,real,real)"/></asyxml>*/ draw(hyperbola(h.C, h.a, h.b, h.angle), 2mm+green); /*<asyxml><view file="modules/geometry.asy" type="hyperbola" signature="hyperbola(bqe)"/></asyxml>*/ draw(hyperbola(equation(h)), 1mm+red); /*<asyxml><view file="modules/geometry.asy" type="hyperbola" signature="conj(hyperbola)"/></asyxml>*/ hyperbola ch=conj(h); draw(ch, blue); draw(ch.A1, 0.5blue); draw(ch.A2, 0.5blue); draw(ch.D1); draw(ch.D2); dot("${V'}_1$", ch.V1, NE); dot("${V'}_2$", ch.V2, SW); dot("${F'}_1$", ch.F1, S); dot("${F'}_2$", ch.F2, N); dot("$V_1$", h.V1, 2E, linewidth(2mm)); dot("$V_2$", h.V2, 2W, linewidth(2mm));
geometry-fig035
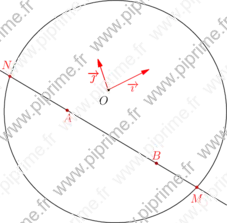
Show geometry/fig0350.asy on Github.
Generated with Asymptote 3.00-0.
Categories : Examples 2D | Geometry.asy
Tags : #Geometry | #Circle | #Line | #Intersection
import geometry; size(8cm,0); currentcoordsys=cartesiansystem((2,1),i=(1,0.5),j=(-0.25,.75)); show(currentcoordsys, xpen=invisible); point A=(-1,0); point B=(0.5,-3sin(2)); dot("$A$",A,S,red); dot("$B$",B,N,red); line l=line(A,B); circle c=circle((point)(0,-sqrt(2)/2),exp(1)); draw(l); draw(c); /*<asyxml><view file="modules/geometry.asy" type="point[]" signature="intersectionpoints(line,circle)"/></asyxml>*/ point[] inter=intersectionpoints(l,c); dot("$M$", inter[0], 2S, red); dot("$N$", inter[1], 2N+0.5W, red);
geometry-fig036
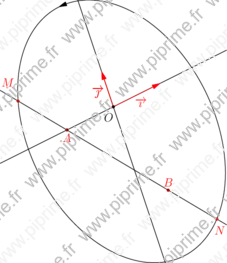
Show geometry/fig0360.asy on Github.
Generated with Asymptote 3.00-0.
Categories : Examples 2D | Geometry.asy
Tags : #Geometry | #Line | #Ellipse | #Intersection
import geometry; size(8cm,0); currentcoordsys=cartesiansystem((2,1),i=(1,0.5),j=(-0.25,.75)); show(currentcoordsys); point A=(-1,0); point B=(0.5,-3sin(2)); dot("$A$",A,S,red); dot("$B$",B,N,red); line l=line(A,B); ellipse el=ellipse((0,-sqrt(2)/2),3,2,90); draw(l); draw(el,Arrow); /*<asyxml><view file="modules/geometry.asy" type="point[]" signature="intersectionpoints(line,ellipse)"/></asyxml>*/ point[] inter=intersectionpoints(l,el); dot("$M$", inter[0], 4N+2W, red); dot("$N$", inter[1], 2S+0.5E, red);
geometry-fig037
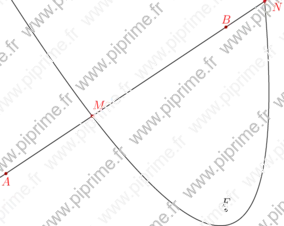
Show geometry/fig0370.asy on Github.
Generated with Asymptote 3.00-0.
Categories : Examples 2D | Geometry.asy
Tags : #Geometry | #Line | #Parabola | #Intersection
import geometry; size(10cm); // currentcoordsys=cartesiansystem((2,1),i=(1,0.5),j=(-0.25,.75)); // show(currentcoordsys); point A=(-1,-1); point B=(2,1); dot("$A$",A,S,red); dot("$B$",B,N,red); line l=line(A,B); draw(l); point F=(2,-1.5); dot("$F$",F,N); parabola p=parabola(F,0.2,110); draw(p); /*<asyxml><view file="modules/geometry.asy" type="point[]" signature="intersectionpoints(line,parabola)"/></asyxml>*/ point[] inter=intersectionpoints(l,p); dot("$M$", inter[0], 2N+E, red); dot("$N$", inter[1], S+2E, red);
geometry-fig038
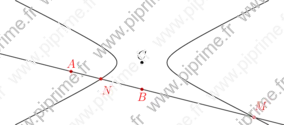
Show geometry/fig0380.asy on Github.
Generated with Asymptote 3.00-0.
Categories : Examples 2D | Geometry.asy
Tags : #Geometry | #Line | #Intersection | #Hyperbola
import geometry; size(10cm); // currentcoordsys=cartesiansystem((2,1),i=(1,0.5),j=(-0.25,.75)); // show(currentcoordsys); // Enlarge the bounding box of the current picture draw(box((-6,-5), (10,2)), invisible); point A=(-2,-2); point B=(2,-3); dot("$A$",A,N,red); dot("$B$",B,S,red); line l=line(A,B); draw(l); point C=(2,-1.5); dot("$C$",C,N); hyperbola h=hyperbola(C,sqrt(2),sqrt(2)/2,0); draw(h); /*<asyxml><view file="modules/geometry.asy" type="point[]" signature="intersectionpoints(line,hyperbola)"/></asyxml>*/ point[] inter=intersectionpoints(l,h); dot("$M$", inter[0], 2N+E, red); dot("$N$", inter[1], 2S+E, red);
geometry-fig039
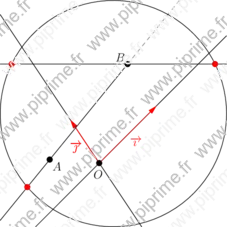
Show geometry/fig0390.asy on Github.
Generated with Asymptote 3.00-0.
Categories : Examples 2D | Geometry.asy
Tags : #Geometry | #Line | #Intersection | #Circle
import geometry; size(8cm,0); currentcoordsys=cartesiansystem((0,0),i=(1,1),j=(-0.5,.75)); show(currentcoordsys); point A=(-0.5,.75); point B=(1,1); dot("$A$",A,SE); dot("$B$",B,NW); line l=line(A,B,false); line ll=hline()+B; circle c=circle((point)(0.5,0.5),2); draw(l^^ll); draw(complementary(l),dashed+grey); draw(c); dotfactor*=2; /*<asyxml><view file="modules/geometry.asy" type="point[]" signature="intersectionpoints(line,circle)"/></asyxml>*/ dot(intersectionpoints(l,c),red); dot(intersectionpoints(ll,c),red);
geometry-fig040
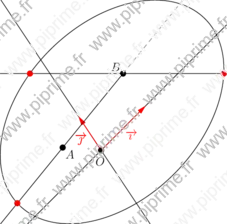
Show geometry/fig0400.asy on Github.
Generated with Asymptote 3.00-0.
Categories : Examples 2D | Geometry.asy
Tags : #Geometry | #Line | #Intersection | #Ellipse
import geometry; size(8cm,0); currentcoordsys=cartesiansystem((0,0),i=(1,1),j=(-0.5,.75)); show(currentcoordsys); point A=(-0.5,.75); point B=(1,1); dot("$A$",A,SE); dot("$B$",B,NW); line l=line(A,B,false); line ll=hline()+B; ellipse el=ellipse((point)(0.5,0.5),3,2); draw(l^^ll); draw(complementary(l),dashed+grey); draw(el); dotfactor*=2; /*<asyxml><view file="modules/geometry.asy" type="point[]" signature="intersectionpoints(line,ellipse)"/></asyxml>*/ dot(intersectionpoints(l,el),red); dot(intersectionpoints(ll,el),red);
geometry-fig041
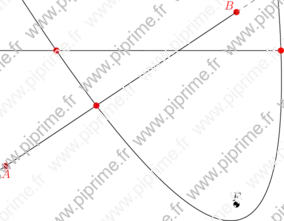
Show geometry/fig0410.asy on Github.
Generated with Asymptote 3.00-0.
Categories : Examples 2D | Geometry.asy
Tags : #Geometry | #Line | #Intersection | #Parabola
import geometry; size(10cm); // currentcoordsys=cartesiansystem((2,1),i=(1,0.5),j=(-0.25,.75)); // show(currentcoordsys); point A=(-1,-1); point B=(2,1); dot("$A$",A,S,red); dot("$B$",B,NW,red); line l=line(A,B,false); line ll=hline()+0.5*B; draw(l^^ll); draw(complementary(l),dashed+grey); point F=(2,-1.5); dot("$F$",F,N); parabola p=parabola(F,0.2,110); draw(p); dotfactor*=2; /*<asyxml><view file="modules/geometry.asy" type="point[]" signature="intersectionpoints(line,parabola)"/></asyxml>*/ dot(intersectionpoints(l,p), red); dot(intersectionpoints(ll,p), red);
geometry-fig042
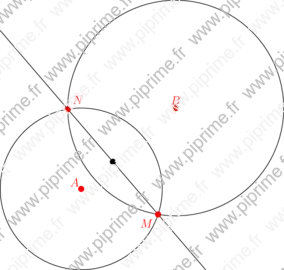
Show geometry/fig0420.asy on Github.
Generated with Asymptote 3.00-0.
Categories : Examples 2D | Geometry.asy
Tags : #Geometry | #Line | #Intersection | #Circle
import geometry; size(10cm,0); // currentcoordsys=cartesiansystem((0,0),i=(1,1),j=(-0.5,.75)); // show(currentcoordsys); point A=(-1,-1); point B=(0.75,0.5); dot("$A$",A,NW,red); dot("$B$",B,N,red); circle c1=circle(A,1.5); circle c2=circle(B,2); draw(c1^^c2); /*<asyxml><view file="modules/geometry.asy" type="line" signature="radicalline(circle,circle)"/></asyxml>*/ draw(radicalline(c1,c2)); /*<asyxml><view file="modules/geometry.asy" type="point" signature="radicalcenter(circle,circle)"/></asyxml>*/ dot(radicalcenter(c1,c2)); dotfactor*=2; /*<asyxml><view file="modules/geometry.asy" type="point[]" signature="intersectionpoints(circle,circle)"/></asyxml>*/ point[] inter=intersectionpoints(c1,c2); dot("$M$", inter[0], 2SW, red); dot("$N$", inter[1], 2NE, red);
geometry-fig043
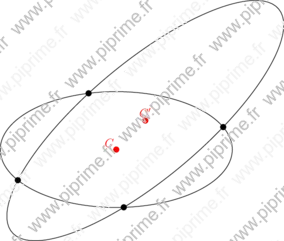
Show geometry/fig0430.asy on Github.
Generated with Asymptote 3.00-0.
Categories : Examples 2D | Geometry.asy
Tags : #Geometry | #Intersection | #Ellipse
import geometry; size(10cm,0); // currentcoordsys=cartesiansystem((0,0),i=(1,1),j=(-0.5,.75)); // show(currentcoordsys); point C=(0,0); point Cp=(0.5,0.5); dot("$C$",C,NW,red); dot("$C'$",Cp,N,red); ellipse el1=ellipse(C,2,1); ellipse el2=ellipse(Cp,3,1,40); draw(el1^^el2); dotfactor*=2; /*<asyxml><view file="modules/geometry.asy" type="point[]" signature="intersectionpoints(ellipse,ellipse)"/></asyxml>*/ point[] inter=intersectionpoints(el1,el2); dot(inter);
geometry-fig044
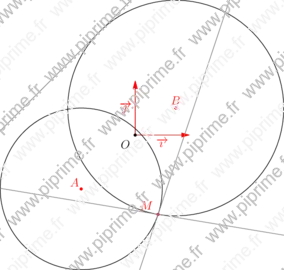
Show geometry/fig0440.asy on Github.
Generated with Asymptote 3.00-0.
Categories : Examples 2D | Geometry.asy
Tags : #Geometry | #Line | #Intersection | #Circle | #Tangent
import geometry; size(10cm,0); // currentcoordsys=cartesiansystem((0,0),i=(1,0.25),j=(-0.5,.75)); show(currentcoordsys, xpen=invisible); point A=(-1,-1); point B=(0.75,0.5); dot("$A$",A,NW,red); dot("$B$",B,N,red); circle c1=circle(A,1.5); circle c2=circle(B,2); draw(c1^^c2); point[] inter=intersectionpoints(c1,c2); dot("$M$", inter[0], 2NW, red); /*<asyxml><view file="modules/geometry.asy" type="line" signature="tangent(circle,point)"/></asyxml>*/ draw(tangent(c1,inter[0]), grey); draw(tangent(c2,inter[0]), grey); /*<asyxml><view file="modules/geometry.asy" type="line" signature="tangent(circle,abscissa)"/></asyxml>*/ draw(tangent(c2,angabscissa(135)), grey);
geometry-fig045
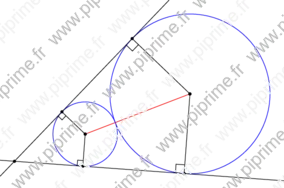
Show geometry/fig0450.asy on Github.
Generated with Asymptote 3.00-0.
Categories : Examples 2D | Geometry.asy
Tags : #Geometry | #Line | #Intersection | #Circle | #Point | #Perpendicular
import geometry; size(10cm,0); point c2=(13,5); real r=4, R=abs(c2)-r; circle[] C={circle(origin, 4), circle(c2,R)}; draw(C[0]^^C[1], blue); segment s=segment(origin, c2); draw(s, red, dot); /*<asyxml><view file="modules/geometry.asy" type="point" signature="curpoint(line,real)"/></asyxml>*/ point T=curpoint(s,r/(r-R)*abs(c2)); dot(T); /*<asyxml><view file="modules/geometry.asy" type="line" signature="tangents(circle,point)"/></asyxml>*/ line[] tgt=tangents(C[1], T); draw(tgt); point[][] t= new point[2][2]; for (int i=0; i < 2 ; ++i) for (int j=0; j < 2; ++j) { /*<asyxml><view file="modules/geometry.asy" type="point[]" signature="intersectionpoints(line,circle)"/></asyxml>*/ t[i][j]=intersectionpoints(C[i],tgt[j])[0]; draw(C[i].C--t[i][j], dot); markrightangle(T, t[i][j], C[i].C, size=(i == 0 ? 2mm : 0)); } addMargins(cm/2,cm/2);
geometry-fig046
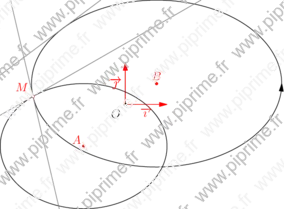
Show geometry/fig0460.asy on Github.
Generated with Asymptote 3.00-0.
Categories : Examples 2D | Geometry.asy
Tags : #Geometry | #Line | #Intersection | #Ellipse | #Abscissa | #Point | #Tangent
import geometry; size(10cm,0); // currentcoordsys=cartesiansystem((0,0),i=(1,0.5),j=(-0.5,.75)); show(currentcoordsys, xpen=invisible); point A=(-1,-1); point B=(0.75,0.5); dot("$A$",A,NW,red); dot("$B$",B,N,red); ellipse el1=ellipse(A,2,1.5); ellipse el2=ellipse(B,3,2); draw(el1); draw(el2,Arrow); point[] inter=intersectionpoints(el1,el2); dot("$M$", inter[0], 2NW, red); /*<asyxml><view file="modules/geometry.asy" type="line[]" signature="tangents(ellipse,point)"/></asyxml>*/ draw(tangents(el1,inter[0]), grey); draw(tangents(el2,inter[0]), grey); /*<asyxml><view file="modules/geometry.asy" type="line" signature="tangent(ellipse,abscissa)"/></asyxml>*/ draw(tangent(el2,angabscissa(90)), grey);
geometry-fig047
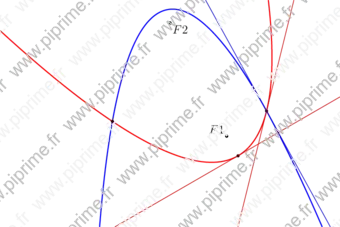
Show geometry/fig0470.asy on Github.
Generated with Asymptote 3.00-0.
Categories : Examples 2D | Geometry.asy
Tags : #Geometry | #Line | #Intersection | #Parabola | #Abscissa | #Point | #Tangent
import geometry; size(12cm); // currentcoordsys=cartesiansystem((0,0),i=(1,0.5),j=(-0.5,.75)); // show(currentcoordsys, xpen=invisible); point F1=(0,0); dot("$F1$",F1,NW); point F2=(-0.25,0.5); dot("$F2$",F2,SE); parabola p=parabola(F1, 0.1, 120); draw(p, bp+red); parabola pp=parabola(F2, 0.06, 280); draw(pp, bp+blue); abscissa x=angabscissa(180); dot(point(p,x)); /*<asyxml><view file="modules/geometry.asy" type="line" signature="tangent(parabola,abscissa)"/></asyxml>*/ draw(tangent(p,x), 0.8*red); point[] P=intersectionpoints(p,pp); dot(P); /*<asyxml><view file="modules/geometry.asy" type="line[]" signature="tangents(parabola,point)"/></asyxml>*/ draw(tangents(p,P[0]), 0.8*red); draw(tangents(pp,P[0]), 0.8*blue); // Enlarge the bounding box draw(box((-1,-0.4), (0.5,0.6)),invisible);
geometry-fig048
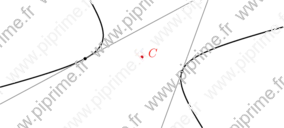
Show geometry/fig0480.asy on Github.
Generated with Asymptote 3.00-0.
Categories : Examples 2D | Geometry.asy
Tags : #Geometry | #Line | #Intersection | #Hyperbola | #Abscissa | #Point | #Tangent
import geometry; size(10cm); point C=(4,2); dot("$C$",C,E+NE,red); hyperbola h=hyperbola(C,1.5,1,-20); draw(h, linewidth(bp)); /*<asyxml><view file="modules/geometry.asy" type="line" signature="tangent(hyperbola,abscissa)"/></asyxml>*/ line l=tangent(h,angabscissa(85)); draw(l, grey); dot(intersectionpoints(h,l)); l=tangent(h,angabscissa(0,fromCenter)); draw(l, grey); dot(intersectionpoints(h,l)); // Enlarge the bounding box of the current picture. draw(box((-1,-0.5), (9,4)), invisible);
geometry-fig049
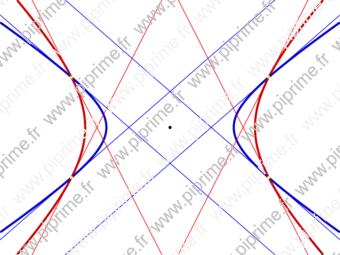
Show geometry/fig0490.asy on Github.
Generated with Asymptote 3.00-0.
Categories : Examples 2D | Geometry.asy
Tags : #Geometry | #Line | #Intersection | #Hyperbola | #Point | #Tangent
import geometry; size(12cm); point C=(0,0); dot(C); hyperbola[] h; h[0]=hyperbola(C,2,2); h[1]=hyperbola(C,1.5,1); draw(h[0], 2bp+0.8*red); draw(h[1], 2bp+0.8*blue); point[] P=intersectionpoints(h[0],h[1]); line[] l; for (int i=0; i < P.length; ++i) { for (int j=0; j < 2; ++j) { /*<asyxml><view file="modules/geometry.asy" type="line[]" signature="tangents(hyperbola,point)"/></asyxml>*/ l=tangents(h[j],P[i]); draw(l[0], j == 0 ? red : blue); } } dot(P, yellow); // Enlarge the bounding box of the current picture. draw(box((-4,-3), (4,3)), invisible);
geometry-fig050
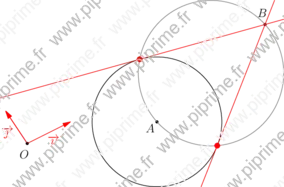
Show geometry/fig0500.asy on Github.
Generated with Asymptote 3.00-0.
Categories : Examples 2D | Geometry.asy
Tags : #Geometry | #Line | #Intersection | #Circle | #Tangent | #Point
import geometry; size(10cm,0); currentcoordsys=cartesiansystem((0,0),i=(1,0.5),j=(-0.5,.75)); show(currentcoordsys, xpen=invisible); point A=(2.5,-1); point B=A+(3,1); dot("$A$",A,SW); dot("$B$",B,2N+0.5W); circle c1=circle(A,1.5); draw(c1); /*<asyxml><view file="modules/geometry.asy" type="line[]" signature="tangents(circle,point)"/></asyxml>*/ line[] tgt=tangents(c1,B); draw(tgt,red); /*<asyxml><view file="modules/geometry.asy" type="circle" signature="circle(point,point)"/></asyxml>*/ draw(circle(B,A),grey); // dot(intersectionpoints(c1,circle(B,A)),red); for (int i=0; i<tgt.length; ++i) { dot(intersectionpoints(c1,tgt[i]),2mm+red); }
geometry-fig051
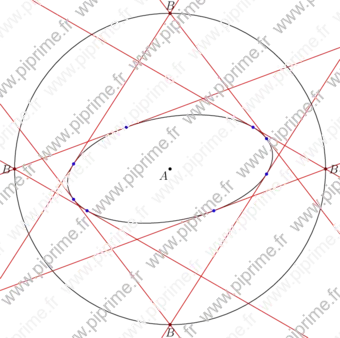
Show geometry/fig0510.asy on Github.
Generated with Asymptote 3.00-0.
Categories : Examples 2D | Geometry.asy
Tags : #Geometry | #Line | #Intersection | #Circle | #Tangent | #Ellipse | #Point
import geometry; size(12cm,0); // currentcoordsys=cartesiansystem((0,0),i=(1,0.5),j=(-0.5,.75)); // show(currentcoordsys, xpen=invisible); point A=(2.5,-1); dot("$A$",A,SW); ellipse el1=ellipse(A,2,1,10); draw(el1); circle C=circle(A,3); draw(C); for (int i=0; i < 360; i+=90) { point B=point(C,angabscissa(i)); dot("$B$",B,locate(unit(B-A))); line[] tgt=tangents(el1,B); draw(tgt,0.8*red); for (int i=0; i < tgt.length; ++i) { dot(intersectionpoints(el1,tgt[i]),blue); } }
geometry-fig052
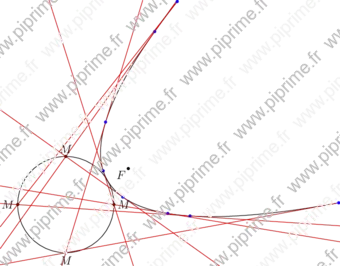
Show geometry/fig0520.asy on Github.
Generated with Asymptote 3.00-0.
Categories : Examples 2D | Geometry.asy
Tags : #Geometry | #Line | #Intersection | #Circle | #Tangent | #Ellipse | #Point
import geometry; size(12cm,0); // currentcoordsys=cartesiansystem((0,0),i=(1,0.5),j=(-0.5,.75)); // show(currentcoordsys, xpen=invisible); point F=(0,0); dot("$F$", F, SW); parabola p=parabola(F, 0.1, 30); draw(p); point C=shift(2*(p.V-p.F))*p.V; circle cle=circle(C, 0.2); draw(cle); for (int i=0; i < 360; i+=90) { point M=point(cle, angabscissa(i)); dot("$M$", M, locate(unit(M-C))); line[] tgt=tangents(p, M); draw(tgt, 0.8*red); for (int i=0; i < tgt.length; ++i) { dot(intersectionpoints(p, tgt[i]), blue); } }
geometry-fig053
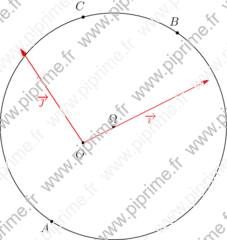
Show geometry/fig0530.asy on Github.
Generated with Asymptote 3.00-0.
Categories : Examples 2D | Geometry.asy
Tags : #Geometry | #Coords system | #Circle | #Point
import geometry; size(8cm,0); currentcoordsys=cartesiansystem((0,0),i=(1,0.5),j=(-0.5,.75)); show(currentcoordsys, xpen=invisible); point A=(-0.5,-0.5); point B=(1,0.5); point C=(0.5,1); dot("$A$",A,SW); dot("$B$",B,2N+0.5W); dot("$C$",C,2N+0.5W); /*<asyxml><view file="modules/geometry.asy" type="circle" signature="circle(point,point,point)"/></asyxml>*/ circle c1=circle(A,B,C); dot("$\Omega$",c1.C,N); draw(c1);
geometry-fig054
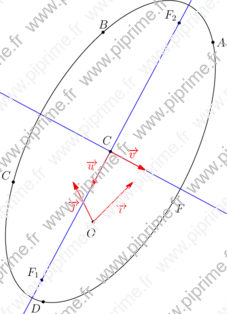
Show geometry/fig0540.asy on Github.
Generated with Asymptote 3.00-0.
Categories : Examples 2D | Geometry.asy
Tags : #Geometry | #Coords system | #Ellipse | #Point
import geometry; size(8cm,0); currentcoordsys=cartesiansystem((2,1),i=(1,1),j=(-0.5,1)); show(currentcoordsys, xpen=invisible); point A=(3.5,1), B=(1.75,3), C=(-1,2), D=(-1.5,-0.5), F=(1.5,-1); dot("$A$",A); dot("$B$",B,N); dot("$C$",C,NW); dot("$D$",D,SW); dot("$F$",F,SE); /*<asyxml><view file="modules/geometry.asy" type="ellipse" signature="ellipse(point,point,point,point,point)"/></asyxml>*/ ellipse el=ellipse(A,B,C,D,F); draw(el); dot("$F_1$",el.F1,NW); dot("$F_2$",el.F2,NW); /*<asyxml><view file="modules/geometry.asy" type="coordsys" signature="canonicalcartesiansystem(ellipse)"/></asyxml>*/ coordsys R=canonicalcartesiansystem(el); show("$C$", "$\vec{u}$", "$\vec{v}$", R, xpen=blue);
geometry-fig055
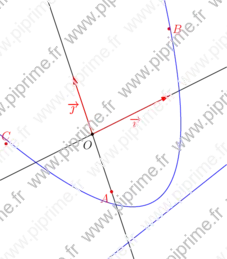
Show geometry/fig0550.asy on Github.
Generated with Asymptote 3.00-0.
Categories : Examples 2D | Geometry.asy
Tags : #Geometry | #Coords system | #Parabola | #Point
import geometry; size(8cm,0); currentcoordsys=cartesiansystem((2,1),i=(1,0.5),j=(-0.25,.75)); show(currentcoordsys); // Enlarge the bounding box of the current picture draw(box(locate((-1,-1.5)),locate((2,1))),invisible); point A=(0,-1); point B=(1.25,1); point C=(-1,0.5); dot("$A$",A,SW,red); dot("$B$",B,E,red); dot("$C$",C,N,red); line l=rotateO(20)*line((0,0),(1,0)); /*<asyxml><view file="modules/geometry.asy" type="parabola" signature="parabola(point,point,point,line)"/></asyxml>*/ parabola p=parabola(A,B,C,l); draw(p,blue); draw(p.D,blue);
geometry-fig056
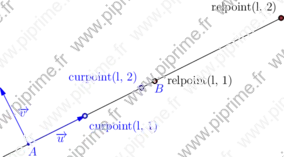
Show geometry/fig0560.asy on Github.
Generated with Asymptote 3.00-0.
Categories : Examples 2D | Geometry.asy
Tags : #Geometry | #Line | #Abscissa | #Point
import geometry; size(10cm,0); // currentcoordsys=cartesiansystem((0,0),i=(1,0.5),j=(-0.5,.75)); // show(currentcoordsys, xpen=invisible); point A=(0,0), B=(2,1); line l=line(A,B); draw(l); show(l, blue); /*<asyxml><view file="modules/geometry.asy" type="point" signature="relpoint(line,real)"/></asyxml>*/ point P=relpoint(l, 1); dot("relpoint(l, 1)", P, 2E,linewidth(2mm)); /*<asyxml><view file="modules/geometry.asy" type="abscissa" signature="relabscissa(line,point)"/></asyxml>*/ dot(point(l,relabscissa(l,P)), red); /*<asyxml><view file="modules/geometry.asy" type="point" signature="curpoint(line,real)"/></asyxml>*/ point P=curpoint(l, 1); dot("curpoint(l, 1)", P, SE, blue+2mm); /*<asyxml><view file="modules/geometry.asy" type="abscissa" signature="curabscissa(line,point)"/></asyxml>*/ dot(point(l,curabscissa(l,P)), yellow); point P=relpoint(l, 2); dot("relpoint(l, 2)", P, NW,linewidth(2mm)); dot(point(l,relabscissa(l,P)), red); point P=curpoint(l, 2); dot("curpoint(l, 2)", P, NW, blue+2mm); dot(point(l,curabscissa(l,P)), yellow);
geometry-fig057
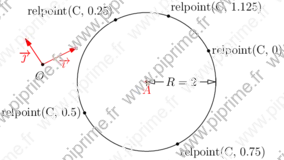
Show geometry/fig0570.asy on Github.
Generated with Asymptote 3.00-0.
Categories : Examples 2D | Geometry.asy
Tags : #Geometry | #Distance | #Circle | #Abscissa | #Point
import geometry; size(10cm,0); currentcoordsys=cartesiansystem((0,0),i=(1,0.5),j=(-0.5,.75)); show(currentcoordsys, xpen=invisible); point A=(2,-2); dot("$A$",A,S,red); circle C=circle(A,2); draw(C); /*<asyxml><view file="modules/geometry.asy" type="void" signature="distance(picture pic,Label,point,point,bool,real,pen,pen,arrow)"/></asyxml>*/ distance("$R=2$",A,point(C,0),0); /*<asyxml><view file="modules/geometry.asy" type="point" signature="relpoint(explicit circle,real)"/></asyxml>*/ dot("relpoint(C, 0)",relpoint(C,0),E); /*<asyxml><view file="modules/geometry.asy" type="point" signature="point(circle,abscissa)"/></asyxml>*/ dot("relpoint(C, 0.25)",point(C,Relative(0.25)),NW); // point(C,Relative(0.25)) can be replaced by relpoint(C,0.25) OR point(C,relabscissa(0.25)) dot("relpoint(C, 0.5)",relpoint(C,0.5),W); dot("relpoint(C, 0.75)",relpoint(C,0.75),SE); dot("relpoint(C, 1.125)",relpoint(C,1.125),NE);
geometry-fig058
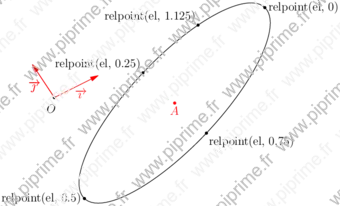
Show geometry/fig0580.asy on Github.
Generated with Asymptote 3.00-0.
Categories : Examples 2D | Geometry.asy
Tags : #Geometry | #Ellipse | #Abscissa | #Point
import geometry; size(12cm,0); currentcoordsys=cartesiansystem((0,0),i=(1,0.5),j=(-0.5,.75)); show(currentcoordsys, xpen=invisible); point A=(2,-1.5); dot("$A$",A,S,red); ellipse el=ellipse(A,3,1,20); draw(el); /*<asyxml><view file="modules/geometry.asy" type="point" signature="relpoint(explicit ellipse,real)"/></asyxml>*/ dot("relpoint(el, 0)",relpoint(el,0),E); /*<asyxml><view file="modules/geometry.asy" type="point" signature="point(ellipse,abscissa)"/></asyxml>*/ dot("relpoint(el, 0.25)",point(el,Relative(0.25)),NW); // point(el,Relative(0.25)) can be replaced by relpoint(el,0.25) OR point(el,relabscissa(0.25)) dot("relpoint(el, 0.5)",relpoint(el,0.5),W); dot("relpoint(el, 0.75)",relpoint(el,0.75),SE); dot("relpoint(el, 1.125)",relpoint(el,1.125),NW);
geometry-fig059
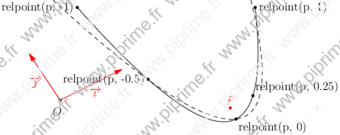
Show geometry/fig0590.asy on Github.
Generated with Asymptote 3.00-0.
Categories : Examples 2D | Geometry.asy
Tags : #Geometry | #Parabola | #Abscissa | #Point
import geometry; size(12cm,0); currentcoordsys=cartesiansystem((0,0),i=(1,0.5),j=(-0.5,.75)); show(currentcoordsys, xpen=invisible); point F=(2,-1.5); dot("$F$",F,N,red); // Enlarge the bounding box of the current picture. draw(box((-0.5,-0.4),(4,1.5)),invisible); parabola p=parabola(F,0.2,90); // Define the bounding box to draw the parabola. // Try finalbounds(); to determine the final bounding box. p.bmin=(-0.5,-0.4); p.bmax=(3.7,0.75); draw(p,dashed); /* Defered drawing to adjust the path to the final bounding box.*/ draw((path)p); /* The path of 'p' is restricted to the box whose the corners are p.bmin, p.bmax.*/ /*<asyxml><view file="modules/geometry.asy" type="point" signature="relpoint(explicit parabola,real)"/></asyxml>*/ dot("relpoint(p, 0)",relpoint(p,0),SE); /*<asyxml><view file="modules/geometry.asy" type="point" signature="point(parabola,abscissa)"/></asyxml>*/ dot("relpoint(p, 0.25)",point(p,Relative(0.25)),NE); // point(p,Relative(0.25)) can be replaced by relpoint(p,0.25) OR point(p,relabscissa(0.25)) dot("relpoint(p, -0.5)",relpoint(p,-0.5),W); dot("relpoint(p, -1)",relpoint(p,-1),W); dot("relpoint(p, 1)",relpoint(p,1),E);
geometry-fig060
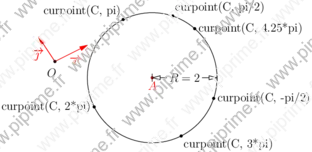
Show geometry/fig0600.asy on Github.
Generated with Asymptote 3.00-0.
Categories : Examples 2D | Geometry.asy
Tags : #Geometry | #Circle | #Abscissa | #Point
import geometry; size(11cm,0); currentcoordsys=cartesiansystem((0,0),i=(1,0.5),j=(-0.5,.75)); show(currentcoordsys, xpen=invisible); point A=(2,-2); dot("$A$",A,S,red); circle C=circle(A,2); draw(C); distance("$R=2$",A,point(C,0),0); /*<asyxml><view file="modules/geometry.asy" type="pair" signature="curpoint(explicit circle,real)"/></asyxml>*/ dot("curpoint(C, pi/2)", curpoint(C,pi/2),NE); dot("curpoint(C, -pi/2)", curpoint(C,-pi/2)); /*<asyxml><view file="modules/geometry.asy" type="abscissa" signature="curabscissa(real)"/></asyxml>*/ dot("curpoint(C, pi)", point(C,curabscissa(pi)),NW); // point(C,curabscissa(pi)) can be replaced by curpoint(C,pi) dot("curpoint(C, 2*pi)", curpoint(C,2*pi),W); dot("curpoint(C, 3*pi)", curpoint(C,3*pi),SE); dot("curpoint(C, 4.25*pi)", curpoint(C,4.25*pi),E);
geometry-fig061
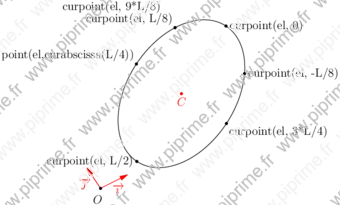
Show geometry/fig0610.asy on Github.
Generated with Asymptote 3.00-0.
Categories : Examples 2D | Geometry.asy
Tags : #Geometry | #Ellipse | #Abscissa | #Point
import geometry; size(12cm,0); currentcoordsys=cartesiansystem((0,0),i=(1,0.5),j=(-0.5,.75)); show(currentcoordsys, xpen=invisible); point A=(4,2); ellipse el=ellipse(A,3,2,30); draw(el); dot("$C$",el.C,S,red); /*<asyxml><view file="modules/geometry.asy" type="pair" signature="curpoint(explicit ellipse,real)"/></asyxml>*/ dot("curpoint(el, 0)", curpoint(el,0), E); real L=arclength(el); dot("curpoint(el, L/8)", curpoint(el,L/8),NW); dot("curpoint(el, -L/8)", curpoint(el,-L/8)); /*<asyxml><view file="modules/geometry.asy" type="abscissa" signature="curabscissa(real)"/></asyxml>*/ dot("point(el,curabscissa(L/4))", point(el,curabscissa(L/4)),NW); // point(el,curabscissa(pi)) can be replaced by curpoint(el,pi) dot("curpoint(el, L/2)", curpoint(el,L/2),W); dot("curpoint(el, 3*L/4)", curpoint(el,3*L/4),SE); dot("curpoint(el, 9*L/8)", curpoint(el,9*L/8),4N+4W);
geometry-fig062
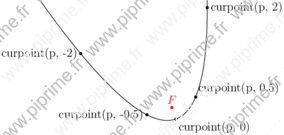
Show geometry/fig0620.asy on Github.
Generated with Asymptote 3.00-0.
Categories : Examples 2D | Geometry.asy
Tags : #Geometry | #Parabola | #Abscissa | #Point
import geometry; size(10cm); point F=(1,-1.5); dot("$F$",F,N,red); parabola p=parabola(F,0.2,110); draw(p); /*<asyxml><view file="modules/geometry.asy" type="point" signature="curpoint(explicit parabola,real)"/></asyxml>*/ dot("curpoint(p, 0)",curpoint(p,0),SE); /*<asyxml><view file="modules/geometry.asy" type="point" signature="point(parabola,abscissa)"/></asyxml>*/ dot("curpoint(p, 0.5)",point(p,curabscissa(0.5)),NE); // point(p,curabscissa(0.5)) can be replaced by curpoint(p,0.5) dot("curpoint(p, -0.5)",curpoint(p,-0.5),W); dot("curpoint(p, -2)",curpoint(p,-2),W); dot("curpoint(p, 2)",curpoint(p,2),E);
geometry-fig063
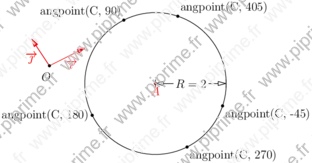
Show geometry/fig0630.asy on Github.
Generated with Asymptote 3.00-0.
Categories : Examples 2D | Geometry.asy
Tags : #Geometry | #Circle | #Abscissa | #Point
import geometry; size(11cm,0); currentcoordsys=cartesiansystem((0,0),i=(1,0.5),j=(-0.5,.75)); show(currentcoordsys, xpen=invisible); point A=(2,-2); dot("$A$",A,S,red); circle C=circle(A,2); draw(C); distance("$R=2$",A,point(C,0),0); /*<asyxml><view file="modules/geometry.asy" type="point" signature="angpoint(explicit circle,real)"/></asyxml>*/ dot("angpoint(C, 90)", angpoint(C,90),NW); /*<asyxml><view file="modules/geometry.asy" type="abscissa" signature="angabscissa(real,polarconicroutine)"/></asyxml>*/ dot("angpoint(C, 180)", point(C,angabscissa(180)), W); // point(C,angabscissa(180)) can be replaced by angpoint(C,180) dot("angpoint(C, 270)", angpoint(C,270),SE); dot("angpoint(C, 405)", angpoint(C,405),NE); dot("angpoint(C, -45)", angpoint(C,-45),SE);
geometry-fig064
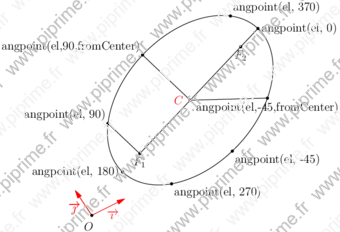
Show geometry/fig0640.asy on Github.
Generated with Asymptote 3.00-0.
Categories : Examples 2D | Geometry.asy
Tags : #Geometry | #Ellipse | #Abscissa | #Point
import geometry; size(12cm,0); currentcoordsys=cartesiansystem((0,0),i=(1,0.5),j=(-0.5,.75)); show(currentcoordsys, xpen=invisible); point A=(4,2); ellipse el=ellipse(A,3,2,20); draw(el); dot("$C$",el.C,2W,red); dot("$F_1$",el.F1,S); dot("$F_2$",el.F2,S); /*<asyxml><view file="modules/geometry.asy" type="point" signature="angpoint(explicit ellipse,real,polarconicroutine)"/></asyxml>*/ point P=angpoint(el, 0); dot("angpoint(el, 0)", P,E); draw(el.F1--P); point P=angpoint(el, 90); dot("angpoint(el, 90)", P,NW); draw(el.F1--P); point P=angpoint(el, 90, fromCenter); dot("angpoint(el,90,fromCenter)", P,NW); draw(el.C--P); /*<asyxml><view file="modules/geometry.asy" type="abscissa" signature="angabscissa(real,polarconicroutine)"/></asyxml>*/ dot("angpoint(el, 180)", point(el,angabscissa(180)), W); // point(el,angabscissa(180)) can be replaced by angpoint(el,180) dot("angpoint(el, 270)", angpoint(el,270),SE); dot("angpoint(el, 370)", angpoint(el,370),NE); dot("angpoint(el, -45)", angpoint(el,-45),SE); point P=angpoint(el, -45, fromCenter); dot("angpoint(el,-45,fromCenter)", P,S); draw(el.C--P);
geometry-fig065
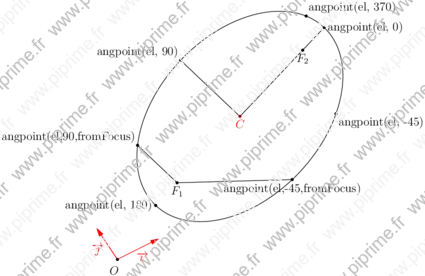
Show geometry/fig0650.asy on Github.
Generated with Asymptote 3.00-0.
Categories : Examples 2D | Geometry.asy
Tags : #Geometry | #Ellipse | #Abscissa | #Point
import geometry; size(15cm,0); currentcoordsys=cartesiansystem((0,0),i=(1,0.5),j=(-0.5,.75)); show(currentcoordsys, xpen=invisible); point A=(4,2); ellipse el=ellipse(A,3,2,20); draw(el); dot("$C$",el.C,S,red); dot("$F_1$",el.F1,S); dot("$F_2$",el.F2,S); /////////////////////////////////////// currentpolarconicroutine=fromCenter;// ///////////////////////////////////// /*<asyxml><view file="modules/geometry.asy" type="point" signature="angpoint(explicit ellipse,real,polarconicroutine)"/></asyxml>*/ point P=angpoint(el, 0); dot("angpoint(el, 0)", P,E); draw(el.C--P); point P=angpoint(el, 90); dot("angpoint(el, 90)", P,NW); draw(el.C--P); point P=angpoint(el, 90, fromFocus); dot("angpoint(el,90,fromFocus)", P,NW); draw(el.F1--P); /*<asyxml><view file="modules/geometry.asy" type="abscissa" signature="angabscissa(real,polarconicroutine)"/></asyxml>*/ dot("angpoint(el, 180)", point(el,angabscissa(180)), W); dot("angpoint(el, 370)", angpoint(el,370),NE); dot("angpoint(el, -45)", angpoint(el,-45),SE); point P=angpoint(el, -45, fromFocus); dot("angpoint(el,-45,fromFocus)", P,S); draw(el.F1--P);
geometry-fig066
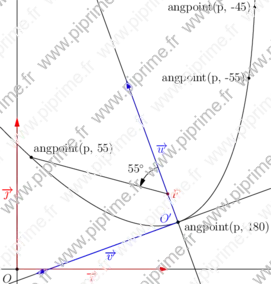
Show geometry/fig0660.asy on Github.
Generated with Asymptote 3.00-0.
Categories : Examples 2D | Geometry.asy
Tags : #Geometry | #Abscissa | #Parabola | #Point
import geometry; size(10cm); point F=(1,0.5); dot("$F$",F,E,red); parabola p=parabola(F,0.2,110); draw(p); coordsys R=currentcoordsys; show(R); coordsys Rp=canonicalcartesiansystem(p); show(Label("$O'$",align=NW+W,blue), Label("$\vec{u}$",blue), Label("$\vec{v}$",blue), Rp, ipen=blue); /*<asyxml><view file="modules/geometry.asy" type="point" signature="angpoint(explicit parabola,real)"/></asyxml>*/ dot("angpoint(p, 180)",angpoint(p,180),SE+E); /*<asyxml><view file="modules/geometry.asy" type="point" signature="point(parabola,abscissa)"/></asyxml>*/ point P=point(p,angabscissa(55)); // point(p,angbscissa(0.5)) can be replaced by angpoint(p,0.5) dot("angpoint(p, 55)",P,NE); segment s=segment(F,P); draw(s); line l=line(F,F+Rp.i); markangle("$"+(string)degrees(l,s)+"^\circ$",l,(line)s,Arrow); dot("angpoint(p, -45)",angpoint(p,-45),W); dot("angpoint(p, -55)",angpoint(p,-55),W);
geometry-fig067
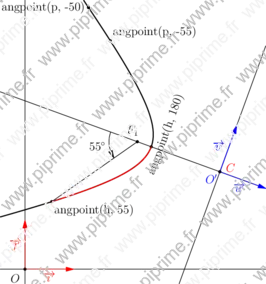
Show geometry/fig0670.asy on Github.
Generated with Asymptote 3.00-0.
Categories : Examples 2D | Geometry.asy
Tags : #Geometry | #Abscissa | #Parabola | #Point | #Arc
import geometry; size(10cm); point C=(4,2); dot("$C$",C,E+NE,red); hyperbola h=hyperbola(C,1.5,1,-20); draw(h, linewidth(bp)); coordsys R=currentcoordsys; show(R); coordsys Rp=canonicalcartesiansystem(h); show(Label("$O'$",align=SW,blue), Label("$\vec{u}$",blue), Label("$\vec{v}$",blue), Rp, ipen=blue); /*<asyxml><view file="modules/geometry.asy" type="point" signature="angpoint(explicit hyperbola,real,polarconicroutine)"/></asyxml>*/ dot(rotate(70)*"angpoint(h, 180)",angpoint(h,180),E); /*<asyxml><view file="modules/geometry.asy" type="point" signature="point(hyperbola,abscissa)"/></asyxml>*/ point P=point(h,angabscissa(55)); // point(h,angbscissa(0.5)) can be replaced by angpoint(h,0.5) dot("angpoint(h, 55)",P,SE); /*<asyxml><view file="modules/geometry.asy" type="path" signature="arcfromfocus(conic,real,real,int,bool)"/></asyxml>*/ draw(arcfromfocus(h,55,180), bp+red); segment s=segment(h.F1,P); draw(s); dot("$F_1$",h.F1,N+NW); line l=line(h.F1,h.F1-Rp.i); markangle("$55^\circ$",l,(line)s,Arrow); dot("angpoint(p, -50)",angpoint(h,-50),W); dot("angpoint(p, -55)",angpoint(h,-55),NE);
geometry-fig068
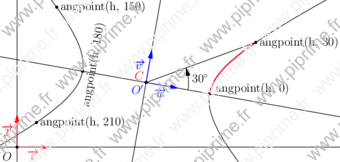
Show geometry/fig0680.asy on Github.
Generated with Asymptote 3.00-0.
Categories : Examples 2D | Geometry.asy
Tags : #Geometry | #Abscissa | #Hyperbola | #Point | #Arc
import geometry; size(12cm); // currentcoordsys=cartesiansystem((0,0),i=(1,0.5),j=(-0.5,.75)); coordsys R=currentcoordsys; show(R); point C=(4,2); dot("$C$", C, NW, red); hyperbola h=hyperbola(C, 2, 1.5, -10); draw(h); /////////////////////////////////////// currentpolarconicroutine=fromCenter;// ///////////////////////////////////// coordsys Rp=canonicalcartesiansystem(h); show(Label("$O'$", align=SW,blue), Label("$\vec{u}$",blue), Label("$\vec{v}$",blue), Rp, ipen=blue); /*<asyxml><view file="modules/geometry.asy" type="point" signature="angpoint(explicit hyperbola,real,polarconicroutine)"/></asyxml>*/ dot("angpoint(h, 0)", angpoint(h,0), E+NE); dot(rotate(80)*"angpoint(h, 180)", angpoint(h,180),E); draw(arcfromcenter(h,0,30), bp+red); // point(p,angbscissa(150)) can be replaced by angpoint(p,150) dot("angpoint(h, 150)", point(h, angabscissa(150)), E); point P=point(h, angabscissa(210)); dot("angpoint(h, 210)", P, E); point P=angpoint(h, 30); dot("angpoint(h, 30)", P, E); segment s=segment(C, P); draw(s); markangle("$30^\circ$", Ox(Rp),(line) s, radius=1.5cm, Arrow);
geometry-fig069
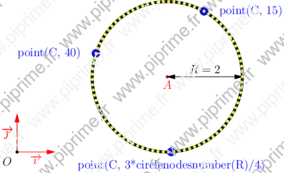
Show geometry/fig0690.asy on Github.
Generated with Asymptote 3.00-0.
Categories : Examples 2D | Geometry.asy
Tags : #Geometry | #Abscissa | #Circle | #Point
import geometry; size(10cm,0); // currentcoordsys=cartesiansystem((0,0),i=(1,0.5),j=(-0.5,.75)); show(currentcoordsys, xpen=invisible); point A=(4,2); dot("$A$",A,S,red); real R=2; circle C=circle(A,R); draw(C,linewidth(1mm)); draw("$R="+(string)R+"$", A--point(C,0), N, Arrows); /*<asyxml><view file="modules/geometry.asy" type="point" signature="point(explicit circle,explicit real)"/></asyxml>*/ dot("point(C, 15)", point(C,15),2E,3mm+blue); /*<asyxml><view file="modules/geometry.asy" type="abscissa" signature="nodabscissa(real)"/></asyxml>*/ dot("point(C, 40)", point(C,nodabscissa(40)), 2W,3mm+blue); // point(C,nodabscissa(40)) can be replaced by point(C,40) /*<asyxml><view file="modules/geometry.asy" type="int" signature="circlenodesnumber(real)"/></asyxml>*/ dot("point(C, 3*circlenodesnumber(R)/4)", point(C, 3*circlenodesnumber(R)/4), S, 3mm+blue); dot((path)C, yellow); write(length((path)C));
geometry-fig070
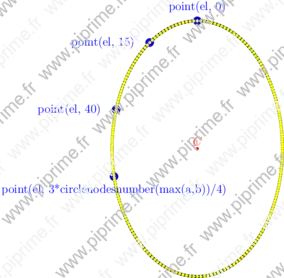
Show geometry/fig0700.asy on Github.
Generated with Asymptote 3.00-0.
Categories : Examples 2D | Geometry.asy
Tags : #Geometry | #Abscissa | #Ellipse | #Point
import geometry; size(10cm,0); // currentcoordsys=cartesiansystem((0,0),i=(1,0.5),j=(-0.5,.75)); // show(currentcoordsys, xpen=invisible); point A=(4,2); real a=2, b=3; ellipse el=ellipse(A,a,b); dot("$C$",el.C,N,red); draw(el,linewidth(1mm)); /*<asyxml><view file="modules/geometry.asy" type="point" signature="point(explicit ellipse,explicit real)"/></asyxml>*/ dot("point(el, 0)", point(el,0),N,3mm+blue); dot("point(el, 15)", point(el,15),2W,3mm+blue); /*<asyxml><view file="modules/geometry.asy" type="abscissa" signature="nodabscissa(real)"/></asyxml>*/ dot("point(el, 40)", point(el,nodabscissa(40)), 2W,3mm+blue); // point(el,nodabscissa(40)) can be replaced by point(el,40) /*<asyxml><view file="modules/geometry.asy" type="int" signature="circlenodesnumber(real)"/></asyxml>*/ dot("point(el, 3*circlenodesnumber(max(a,b))/4)", point(el, 3*circlenodesnumber(max(a,b))/4), S, 3mm+blue); dot((path)el, yellow);
geometry-fig071
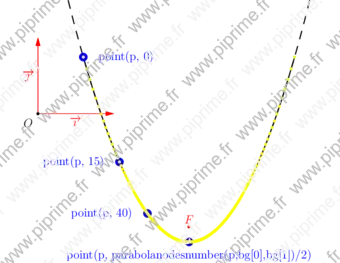
Show geometry/fig0710.asy on Github.
Generated with Asymptote 3.00-0.
Categories : Examples 2D | Geometry.asy
Tags : #Geometry | #Abscissa | #Parabola | #Point
import geometry; size(12cm); // currentcoordsys=cartesiansystem((0,0),i=(1,0.5),j=(-0.5,.75)); show(currentcoordsys, xpen=invisible); point F=(2,-1.5); dot("$F$",F,N,red); // Enlarge the bounding box of the current picture. draw(box((-0.5,-0.4),(4,1.5)),invisible); parabola p=parabola(F,0.2,90); draw(p,bp+dashed); /* Defered drawing to adjust the path to the final bounding box.*/ // Define the bounding box to draw the parabola. // Try finalbounds(); to determine the final bounding box. p.bmin=(-0.5,-0.4); p.bmax=(3.7,0.75); draw((path)p, linewidth(bp)); /* The path of 'p' is restricted to the box whose the corners are p.bmin, p.bmax.*/ /*<asyxml><view file="modules/geometry.asy" type="point" signature="point(explicit parabola,explicit real)"/></asyxml>*/ dot("point(p, 0)", point(p,0),2E,3mm+blue); dot("point(p, 15)", point(p,15),2W,3mm+blue); /*<asyxml><view file="modules/geometry.asy" type="abscissa" signature="nodabscissa(real)"/></asyxml>*/ dot("point(p, 40)", point(p,nodabscissa(40)), 2W,3mm+blue); // point(p,nodabscissa(40)) can be replaced by point(p,40) /*<asyxml><view file="modules/geometry.asy" type="real[]" signature="bangles(picture,parabola)"/></asyxml>*/ real[] bg=bangles(p); /*<asyxml><view file="modules/geometry.asy" type="int" signature="parabolanodesnumber(parabola,real,real)"/></asyxml>*/ dot("point(p, parabolanodesnumber(p,bg[0],bg[1])/2)", point(p, parabolanodesnumber(p,bg[0],bg[1])/2), S, 3mm+blue); dot((path)p, yellow);
geometry-fig072
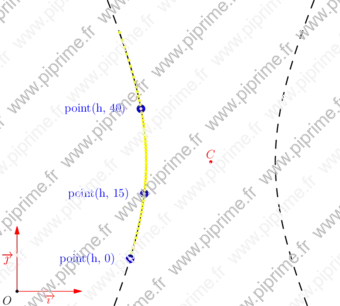
Show geometry/fig0720.asy on Github.
Generated with Asymptote 3.00-0.
Categories : Examples 2D | Geometry.asy
Tags : #Geometry | #Abscissa | #Hyperbola | #Point
import geometry; size(12cm); // currentcoordsys=cartesiansystem((0,0),i=(1,0.5),j=(-0.5,.75)); show(currentcoordsys, xpen=invisible); point C=(3,2); dot("$C$", C, N, red); // Enlarge the bounding box of the current picture. draw(box((0,0),(5,4.5)), invisible); hyperbola h=hyperbola(C, 1, 2); draw(h, bp+dashed); /* Defered drawing to adjust the path to the final bounding box.*/ // Define the bounding box to draw the hyperbola. // Try finalbounds(); to determine the final bounding box. h.bmin=(0,0.5); h.bmax=(5,4); draw((path)h, linewidth(bp)); /* The path of 'p' is restricted to the box whose the corners are p.bmin, p.bmax.*/ /*<asyxml><view file="modules/geometry.asy" type="point" signature="point(explicit hyperbola,explicit real)"/></asyxml>*/ dot("point(h, 0)", point(h,0), 2W, 3mm+blue); dot("point(h, 15)", point(h,15), 2W, 3mm+blue); /*<asyxml><view file="modules/geometry.asy" type="abscissa" signature="nodabscissa(real)"/></asyxml>*/ dot("point(h, 40)", point(h,nodabscissa(40)), 2W,3mm+blue); // point(h,nodabscissa(40)) can be replaced by point(h,40) /*<asyxml><view file="modules/geometry.asy" type="real[]" signature="bangles(picture,hyperbola)"/></asyxml>*/ real[][] bg=bangles(h); dot((path)h, yellow);
geometry-fig073
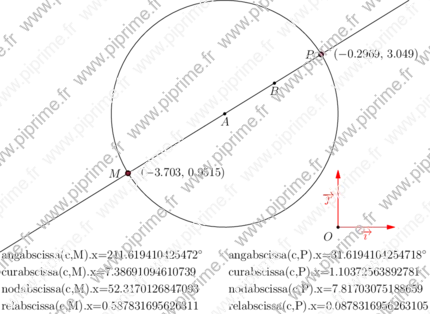
Show geometry/fig0730.asy on Github.
Generated with Asymptote 3.00-0.
Categories : Examples 2D | Geometry.asy
Tags : #Geometry | #Abscissa | #Circle | #Point
import geometry; unitsize(2cm); // currentcoordsys=cartesiansystem((0,0),i=(1,0.5),j=(-0.5,.75)); show(currentcoordsys, xpen=invisible); point A=(-2,2); dot("$A$",A,S); point B=A+(cos(0.5),cos(1)); dot("$B$",B,S); circle c=circle(A,2); draw(c); line l=line(A,B); draw(l); point M=intersectionpoints(l,c)[0]; point P=intersectionpoints(l,c)[1]; /*<asyxml><view file="modules/geometry.asy" type="void" signature="dot(picture,Label,explicit point,align,string,pen)"/></asyxml>*/ dot("",M,2E,linewidth(2mm)); dot("$M$",M,2W); dot("",P,2E,linewidth(2mm)); dot("$P$",P,2W); pair p=A-(4,2.5); transform t=shift((0,-0.3)); transform T=shift((4,0)); real x; /*<asyxml><view file="modules/geometry.asy" type="abscissa" signature="angabscissa(circle,point)"/></asyxml>*/ x=angabscissa(c,M).x; label("angabscissa(c,M).x=$"+(string)x+"^\circ$",p,E); dot(angpoint(c,x),1mm+red); x=angabscissa(c,P).x; label("angabscissa(c,P).x=$"+(string)x+"^\circ$",T*p,E); dot(angpoint(c,x),1mm+red); p=t*p; /*<asyxml><view file="modules/geometry.asy" type="abscissa" signature="curabscissa(circle,point)"/></asyxml>*/ x=curabscissa(c,M).x; dot(curpoint(c,x),1mm+red); label("curabscissa(c,M).x="+(string)x,p,E); x=curabscissa(c,P).x; label("curabscissa(c,P).x="+(string)x,T*p,E); dot(curpoint(c,x),1mm+red); p=t*p; /*<asyxml><view file="modules/geometry.asy" type="abscissa" signature="nodabscissa(circle,point)"/></asyxml>*/ x=nodabscissa(c,M).x; label("nodabscissa(c,M).x="+(string)x,p,E); dot(point(c,x),1mm+red); x=nodabscissa(c,P).x; label("nodabscissa(c,P).x="+(string)x,T*p,E); dot(point(c,x),1mm+red); p=t*p; /*<asyxml><view file="modules/geometry.asy" type="abscissa" signature="relabscissa(circle,point)"/></asyxml>*/ x=relabscissa(c,M).x; label("relabscissa(c,M).x="+(string)x,p,E); dot(relpoint(c,x),1mm+red); x=relabscissa(c,P).x; label("relabscissa(c,P).x="+(string)x,T*p,E); dot(relpoint(c,x),1mm+red);
geometry-fig074
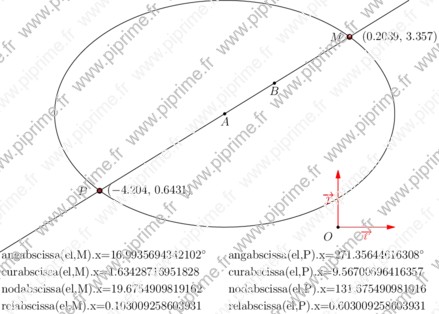
Show geometry/fig0740.asy on Github.
Generated with Asymptote 3.00-0.
Categories : Examples 2D | Geometry.asy
Tags : #Geometry | #Abscissa | #Ellipse | #Point
import geometry; unitsize(2cm); // currentcoordsys=cartesiansystem((0,0),i=(1,0.5),j=(-0.5,.75)); show(currentcoordsys, xpen=invisible); point A=(-2,2); dot("$A$",A,S); point B=A+(cos(0.5),cos(1)); dot("$B$",B,S); ellipse el=ellipse(A,3,2,0); draw(el); line l=line(A,B); draw(l); point M=intersectionpoints(l,el)[0]; point P=intersectionpoints(l,el)[1]; /*<asyxml><view file="modules/geometry.asy" type="void" signature="dot(picture,Label,explicit point,align,string,pen)"/></asyxml>*/ dot("",M,2E,linewidth(2mm)); dot("$M$",M,2W); dot("",P,2E); dot("$P$",P,2W,linewidth(2mm)); pair p=A-(4,2.5); transform t=shift((0,-0.3)); transform T=shift((4,0)); real x; /*<asyxml><view file="modules/geometry.asy" type="abscissa" signature="angabscissa(ellipse,point,polarconicroutine)"/></asyxml>*/ x=angabscissa(el,M).x; label("angabscissa(el,M).x=$"+(string)x+"^\circ$",p,E); dot(angpoint(el,x),1mm+red); x=angabscissa(el,P).x; label("angabscissa(el,P).x=$"+(string)x+"^\circ$",T*p,E); dot(angpoint(el,x),1mm+red); p=t*p; /*<asyxml><view file="modules/geometry.asy" type="abscissa" signature="curabscissa(ellipse,point)"/></asyxml>*/ x=curabscissa(el,M).x; dot(curpoint(el,x),1mm+red); label("curabscissa(el,M).x="+(string)x,p,E); x=curabscissa(el,P).x; label("curabscissa(el,P).x="+(string)x,T*p,E); dot(curpoint(el,x),1mm+red); p=t*p; /*<asyxml><view file="modules/geometry.asy" type="abscissa" signature="nodabscissa(ellipse,point)"/></asyxml>*/ x=nodabscissa(el,M).x; label("nodabscissa(el,M).x="+(string)x,p,E); dot(point(el,x),1mm+red); x=nodabscissa(el,P).x; label("nodabscissa(el,P).x="+(string)x,T*p,E); dot(point(el,x),1mm+red); p=t*p; /*<asyxml><view file="modules/geometry.asy" type="abscissa" signature="relabscissa(ellipse,point)"/></asyxml>*/ x=relabscissa(el,M).x; label("relabscissa(el,M).x="+(string)x,p,E); dot(relpoint(el,x),1mm+red); x=relabscissa(el,P).x; label("relabscissa(el,P).x="+(string)x,T*p,E); dot(relpoint(el,x),1mm+red);
geometry-fig075
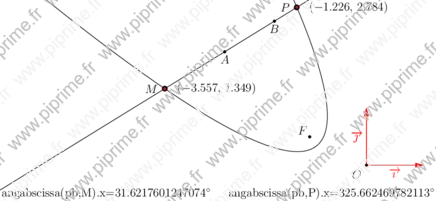
Show geometry/fig0750.asy on Github.
Generated with Asymptote 3.00-0.
Categories : Examples 2D | Geometry.asy
Tags : #Geometry | #Abscissa | #Parabola | #Point/Dot | #Point
import geometry; unitsize(2cm); // currentcoordsys=cartesiansystem((0,0),i=(1,0.5),j=(-0.5,.75)); show(currentcoordsys, xpen=invisible); point A=(-2.5,2); dot("$A$",A,S); point B=A+(cos(0.5),cos(1)); dot("$B$",B,S); point F=(-1,0.5); dot("$F$",F,NW); parabola pb=parabola(F,0.2,130); draw(pb); line l=line(A,B); draw(l); point M=intersectionpoints(l,pb)[0]; point P=intersectionpoints(l,pb)[1]; /*<asyxml><view file="modules/geometry.asy" type="void" signature="dot(picture,Label,explicit point,align,string,pen)"/></asyxml>*/ dot("",M,2E,linewidth(2mm)); dot("$M$",M,2W); dot("",P,2E,linewidth(2mm)); dot("$P$",P,2W); pair p=A-(4,2.5); transform t=shift((0,-0.3)); transform T=shift((4,0)); real x; /*<asyxml><view file="modules/geometry.asy" type="abscissa" signature="angabscissa(parabola,point)"/></asyxml>*/ x=angabscissa(pb,M).x; label("angabscissa(pb,M).x=$"+(string)x+"^\circ$",p,E); dot(angpoint(pb,x),1mm+red); x=angabscissa(pb,P).x; label("angabscissa(pb,P).x=$"+(string)x+"^\circ$",T*p,E); dot(angpoint(pb,x),1mm+red); // p=t*p; // /*<asyxml><view file="modules/geometry.asy" type="abscissa" signature="curabscissa(parabola,point)"/></asyxml>*/ // x=curabscissa(pb,M).x; // dot(curpoint(pb,x),1mm+red); // label("curabscissa(pb,M).x="+(string)x,p,E); // x=curabscissa(pb,P).x; // label("curabscissa(pb,P).x="+(string)x,T*p,E); // dot(curpoint(pb,x),1mm+red); // p=t*p; // /*<asyxml><view file="modules/geometry.asy" type="abscissa" signature="nodabscissa(parabola,point)"/></asyxml>*/ // x=nodabscissa(pb,M).x; // label("nodabscissa(pb,M).x="+(string)x,p,E); // dot(point(pb,x),1mm+red); // x=nodabscissa(pb,P).x; // label("nodabscissa(pb,P).x="+(string)x,T*p,E); // dot(point(pb,x),1mm+red);
geometry-fig076
Show geometry/fig0760.asy on Github.
Generated with Asymptote 3.00-0.
Categories : Examples 2D | Geometry.asy
Tags : #Geometry | #Ellipse | #Draw (2D) | #Circle | #Parabola | #Hyperbola | #Conic | #Intersection
import geometry; size(12cm); // currentcoordsys=cartesiansystem((2,1),i=(1,0.5),j=(-0.25,0.75)); // currentcoordsys=cartesiansystem((2,1),i=rotate(45)*(1,0),j=rotate(45)*(0,1)); // show(currentcoordsys); conic co[]; co[0]=circle((point)(0,0),1); /*<asyxml><view file="modules/geometry.asy" type="void" signature="draw(picture,Label,explicit conic,align,pen,arrowbar,arrowbar,margin,Label,marker)"/></asyxml>*/ draw(co[0]); co[1]=ellipse((point)(0,0),4,1); draw(co[1]); co[2]=parabola((0,0),1,90); draw(co[2]); hyperbola h=hyperbola((-1,0),(1,0),1.2,byvertices); co[3]=h; draw(co[3]); draw(h.A1,grey); draw(h.A2,grey); dotfactor *= 1; for (int i=0; i < 4; ++i) { dot(intersectionpoints(h.A1,co[i]),blue); dot(intersectionpoints(h.A2,co[i]),blue); for (int j=i+1; j < 4; ++j) /*<asyxml><view file="modules/geometry.asy" type="point[]" signature="intersectionpoints(conic,conic)"/></asyxml>*/ dot(intersectionpoints(co[i],co[j]), red); }
geometry-fig077
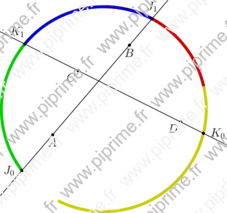
Show geometry/fig0770.asy on Github.
Generated with Asymptote 3.00-0.
Categories : Examples 2D | Geometry.asy
Tags : #Geometry | #Arc | #Circle | #Ellipse
import geometry; size(8cm); currentcoordsys=cartesiansystem((1,2),i=(1,0.5),j=(-0.5,.75)); // show(currentcoordsys, xpen=invisible); point A=(-1,0) ; dot("$A$",A,S); point B=(1,1) ; dot("$B$",B,S); point C=(0,1) ; dot("$C$",C,SW); point D=(1,-1) ; dot("$D$",D,SW); circle c=circle(origin(),2); line l1=line(A,B); draw(l1); line l2=line(C,D); draw(l2); point[] J=intersectionpoints(l1,c); point[] K=intersectionpoints(l2,c); /*<asyxml><view file="modules/geometry.asy" type="arc" signature="arc(ellipse,point,point,bool)"/></asyxml>*/ draw(arc(c,J[0],K[0]),1mm+0.8yellow); draw(arc(c,K[0],J[1]),1mm+0.8red); /*<asyxml><view file="modules/geometry.asy" type="arc" signature="arc(ellipse,abscissa,abscissa,bool)"/></asyxml>*/ draw(arc(c,angabscissa(c,J[1]),angabscissa(c,K[1])),1mm+0.8blue); draw(arc(c,angabscissa(c,K[1]),angabscissa(c,J[0])),1mm+0.8green); dot("$J_0$",J[0],2W); dot("$J_1$",J[1],2N); dot("$K_0$",K[0],2E) ; dot("$K_1$",K[1],2N+W);
geometry-fig078
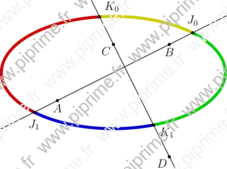
Show geometry/fig0780.asy on Github.
Generated with Asymptote 3.00-0.
Categories : Examples 2D | Geometry.asy
Tags : #Geometry | #Arc | #Circle | #Ellipse
import geometry; size(8cm); // currentcoordsys=cartesiansystem((1,2),i=(1,0.5),j=(-0.5,.75)); // show(currentcoordsys, xpen=invisible); point A=(-1,0) ; dot("$A$",A,S); point B=(1,1) ; dot("$B$",B,S); point C=(0,1) ; dot("$C$",C,SW); point D=(1,-1) ; dot("$D$",D,SW); ellipse el=ellipse((point)(0,0.5),2,1); line l1=line(A,B); draw(l1); line l2=line(C,D); draw(l2); point[] J=intersectionpoints(l1,el); point[] K=intersectionpoints(l2,el); /*<asyxml><view file="modules/geometry.asy" type="arc" signature="arc(ellipse,point,point,bool)"/></asyxml>*/ draw(arc(el, J[0],K[0]), 1mm+0.8yellow); draw(arc(el, K[0],J[1]), 1mm+0.8red); /*<asyxml><view file="modules/geometry.asy" type="arc" signature="arc(ellipse,abscissa,abscissa,bool)"/></asyxml>*/ draw(arc(el,angabscissa(el,J[1]), angabscissa(el,K[1])), 1mm+0.8blue); draw(arc(el,angabscissa(el,K[1]), angabscissa(el,J[0])), 1mm+0.8green); dot("$J_0$", J[0], 2N); dot("$J_1$", J[1], 2S); dot("$K_0$", K[0], 2NE) ; dot("$K_1$", K[1], 2dir(-35));
geometry-fig079
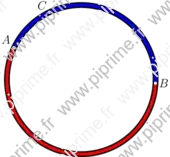
Show geometry/fig0790.asy on Github.
Generated with Asymptote 3.00-0.
Categories : Examples 2D | Geometry.asy
Tags : #Geometry | #Arc | #Circle
import geometry; size(6cm); // currentcoordsys=cartesiansystem((1,2),i=(1,0.5),j=(-0.5,.75)); // show(currentcoordsys, xpen=invisible); point A=(-1,0); point B=(3,-1); point C=(0,1); circle cle=circle(A,C,B); draw(cle,linewidth(2mm)); draw(arc(cle,A,B), dotsize()+red); draw(arc(cle,A,B,CW), dotsize()+blue); dot(Label("$A$", black), A, 1.5NW, white); dot(Label("$B$", black), B, E, white); dot(Label("$C$", black), C, NW, white);
geometry-fig080
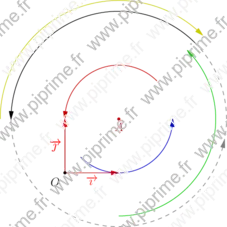
Show geometry/fig0800.asy on Github.
Generated with Asymptote 3.00-0.
Categories : Examples 2D | Geometry.asy
Tags : #Geometry | #Arc | #Circle | #Ellipse | #Transform/scale/shift/rotate
import geometry; size(8cm,0); // currentcoordsys=cartesiansystem((1,2),i=(1,0.5),j=(-0.5,.75)); show(currentcoordsys, xpen=invisible); point A=(1,1); dot("$A$",A,S,0.8red); real R=2; /*<asyxml><view file="modules/geometry.asy" type="" signature="struct arc"/></asyxml>*/ arc C=arc(circle(A,R),45,180);/*<asyxml><view file="modules/geometry.asy" type="arc" signature="arc(ellipse,real,real,polarconicroutine,bool)"/></asyxml>*/ draw(C,Arrow); /*<asyxml><view file="modules/geometry.asy" type="arc" signature="complementary(arc)"/></asyxml>*/ draw(complementary(C),dashed+grey,Arrow(position=Relative(0.75))); /*<asyxml><view file="modules/geometry.asy" type="arc" signature="*(transform,explicit arc)"/></asyxml>*/ arc Cp=scale(0.5,A)*C; draw(Cp,0.8red,Arrow); arc Cp=scale(-0.5,A)*C; draw(Cp,0.8blue,Arrow); arc Cp=scale(1.1,A)*C; /*<asyxml><view file="modules/geometry.asy" type="arc" signature="reverse(arc)"/></asyxml>*/ draw(reverse(Cp),0.8*yellow,Arrow); arc Cp=scale(0.9,A)*C; draw(rotate(225,A)*Cp,0.8green,Arrow);
geometry-fig081
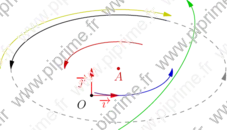
Show geometry/fig0810.asy on Github.
Generated with Asymptote 3.00-0.
Categories : Examples 2D | Geometry.asy
Tags : #Geometry | #Arc | #Circle | #Ellipse | #Transform/scale/shift/rotate
import geometry; size(8cm,0); // currentcoordsys=cartesiansystem((1,2),i=(1,0.5),j=(-0.5,.75)); show(currentcoordsys, xpen=invisible); point A=(1,1); dot("$A$",A,S,0.8red); real R=2; /*<asyxml><view file="modules/geometry.asy" type="" signature="struct arc"/></asyxml>*/ arc C=arc(ellipse(A,2R,R),45,180,fromCenter); draw(C,Arrow); /*<asyxml><view file="modules/geometry.asy" type="arc" signature="complementary(arc)"/></asyxml>*/ draw(complementary(C),dashed+grey,Arrow(position=Relative(0.75))); /*<asyxml><view file="modules/geometry.asy" type="arc" signature="*(transform,explicit arc)"/></asyxml>*/ arc Cp=scale(0.5,A)*C; draw(Cp,0.8red,Arrow); arc Cp=scale(-0.5,A)*C; draw(Cp,0.8blue,Arrow); arc Cp=scale(1.1,A)*C; /*<asyxml><view file="modules/geometry.asy" type="arc" signature="reverse(arc)"/></asyxml>*/ draw(reverse(Cp),0.8*yellow,Arrow); arc Cp=scale(0.9,A)*C; draw(rotate(225,A)*Cp,0.8green,Arrow);
geometry-fig082
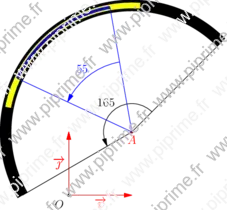
Show geometry/fig0820.asy on Github.
Generated with Asymptote 3.00-0.
Categories : Examples 2D | Geometry.asy
Tags : #Geometry | #Arc | #Circle | #Transform/scale/shift/rotate | #Markers
import geometry; size(8cm,0); // currentcoordsys=cartesiansystem((1,2),i=(1,0.5),j=(-0.5,.75)); show(currentcoordsys, xpen=invisible); point A=(1,1); dot("$A$",A,S,red); real R=2; arc C=arc(circle(A,R), 45, 210); draw(C,linewidth(4mm)); /*<asyxml><view file="modules/geometry.asy" type="void" signature="markarc(picture,Label,int,real,real,arc,arrowbar,pen,pen,margin,marker)"/></asyxml>*/ markarc(format("%0g",degrees(C)), C, Arrow); /*<asyxml><view file="modules/geometry.asy" type="arc" signature="*(real, explicit arc)"/></asyxml>*/ draw(0.5*C,2mm+yellow); arc Cp=C/3; draw(Cp,1mm+blue); markarc(format("%0g",degrees(Cp)), radius=25mm, Cp, blue, Arrow);
geometry-fig083
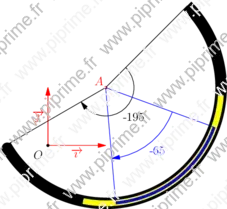
Show geometry/fig0830.asy on Github.
Generated with Asymptote 3.00-0.
Categories : Examples 2D | Geometry.asy
Tags : #Geometry | #Arc | #Circle | #Transform/scale/shift/rotate | #Markers
import geometry; size(8cm,0); // currentcoordsys=cartesiansystem((1,2),i=(1,0.5),j=(-0.5,.75)); show(currentcoordsys, xpen=invisible); point A=(1,1); dot("$A$", A, NW, red); real R=2; arc C=arc(circle(A,R), 45, 210, CW); draw(C,linewidth(4mm)); /*<asyxml><view file="modules/geometry.asy" type="void" signature="markarc(picture,Label,int,real,real,arc,arrowbar,pen,pen,margin,marker)"/></asyxml>*/ markarc(format("%0g",degrees(C)), C, radius=markangleradius(), Arrow); /*<asyxml><view file="modules/geometry.asy" type="arc" signature="*(real, explicit arc)"/></asyxml>*/ draw(0.5*C, 2mm+yellow); arc Cp=C/3; draw(Cp, 1mm+blue); markarc(format("%0g",degrees(Cp)), radius=-25mm, Cp, blue, Arrow);
geometry-fig084
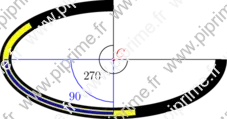
Show geometry/fig0840.asy on Github.
Generated with Asymptote 3.00-0.
Categories : Examples 2D | Geometry.asy
Tags : #Geometry | #Arc | #Ellipse | #Transform/scale/shift/rotate | #Markers
import geometry; size(8cm,0); // currentcoordsys=cartesiansystem((1,2),i=(1,0.5),j=(-0.5,.75)); // show(currentcoordsys, xpen=invisible); point C=(1,1); dot("$C$", C, NE, red); real R=2; arc a=arc(ellipse(C,R,R/2), 90, 0, fromCenter); draw(a, linewidth(4mm)); /*<asyxml><view file="modules/geometry.asy" type="void" signature="markarc(picture,Label,int,real,real,arc,arrowbar,pen,pen,margin,marker)"/></asyxml>*/ markarc(format("%0g", degrees(a)), radius=-0.5*markangleradius(), a); /*<asyxml><view file="modules/geometry.asy" type="arc" signature="*(real, explicit arc)"/></asyxml>*/ draw(0.5*a, 2mm+yellow); arc ap=a/3; draw(ap, 1mm+blue); markarc(format("%0g", degrees(ap)), radius=1.5*markangleradius(), ap, blue);
geometry-fig085
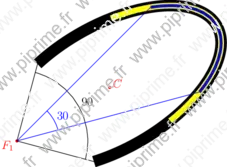
Show geometry/fig0850.asy on Github.
Generated with Asymptote 3.00-0.
Categories : Examples 2D | Geometry.asy
Tags : #Geometry | #Arc | #Circle | #Transform/scale/shift/rotate | #Markers
import geometry; size(8cm,0); // currentcoordsys=cartesiansystem((1,2),i=(1,0.5),j=(-0.5,.75)); // show(currentcoordsys, xpen=invisible); point C=(1,1); dot("$C$", C, dir(30), red); arc a=arc(ellipse(C,2,1,30), -45, 45); draw(a, linewidth(4mm)); dot("$F_1$", a.el.F1, dir(210), red); /*<asyxml><view file="modules/geometry.asy" type="void" signature="markarc(picture,Label,int,real,real,arc,arrowbar,pen,pen,margin,marker)"/></asyxml>*/ markarc(format("%0g", degrees(a)), radius=2.5*markangleradius(), a); /*<asyxml><view file="modules/geometry.asy" type="arc" signature="*(real, explicit arc)"/></asyxml>*/ draw(0.5*a, 2mm+yellow); arc ap=a/3; draw(ap, 1mm+blue); markarc(format("%0g", degrees(ap)), radius=1.5*markangleradius(), ap, blue);
geometry-fig086
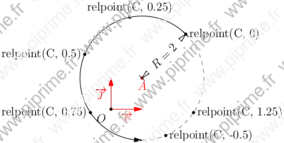
Show geometry/fig0860.asy on Github.
Generated with Asymptote 3.00-0.
Categories : Examples 2D | Geometry.asy
Tags : #Geometry | #Arc | #Circle | #Abscissa | #Point
import geometry; size(10cm,0); // currentcoordsys=cartesiansystem((1,2), i=(1,0.5), j=(-0.5,.75)); show(currentcoordsys, xpen=invisible); point A=(1,1); dot("$A$", A, S, red); arc C=arc(circle(A,2), 45, 270); draw(C, Arrow); /*<asyxml><view file="modules/geometry.asy" type="real" signature="degrees(arc)"/></asyxml>*/ write(degrees(C)); // Output is 225 draw(complementary(C), grey+dashed); distance("$R=2$",A,point(C,0),0); /*<asyxml><view file="modules/geometry.asy" type="point" signature="relpoint(arc,real)"/></asyxml>*/ dot("relpoint(C, 0)", relpoint(C,0),E); /*<asyxml><view file="modules/geometry.asy" type="point" signature="point(arc,abscissa)"/></asyxml>*/ dot("relpoint(C, 0.25)", point(C,Relative(0.25)),N);// point(C,Relative(0.25)) is similar to relpoint(C,0.25) dot("relpoint(C, -0.5)", relpoint(C,-0.5),E); dot("relpoint(C, 0.5)", relpoint(C,0.5),W); dot("relpoint(C, 0.75)", relpoint(C,0.75),W); dot("relpoint(C, 1.25)", relpoint(C,1.25),E);
geometry-fig087
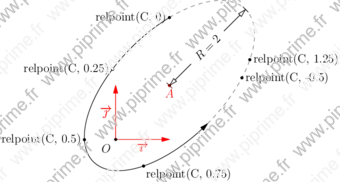
Show geometry/fig0870.asy on Github.
Generated with Asymptote 3.00-0.
Categories : Examples 2D | Geometry.asy
Tags : #Geometry | #Arc | #Ellipse | #Abscissa | #Point
import geometry; size(12cm,0); // currentcoordsys=cartesiansystem((1,2), i=(1,0.5), j=(-0.5,.75)); show(currentcoordsys, xpen=invisible); point A=(1,1); dot("$A$", A, S, red); arc C=arc(ellipse(A,2,1,45), 45, 270, fromCenter); // arc C=arc(ellipse(A,2,1), 45, -45); draw(C, Arrow); draw(complementary(C), grey+dashed); distance("$R=2$",A,point(C.el,0),0); /*<asyxml><view file="modules/geometry.asy" type="point" signature="relpoint(arc,real)"/></asyxml>*/ dot("relpoint(C, 0)", relpoint(C,0),W); /*<asyxml><view file="modules/geometry.asy" type="point" signature="point(arc,abscissa)"/></asyxml>*/ dot("relpoint(C, 0.25)", point(C,Relative(0.25)),W);// point(C,Relative(0.25)) is similar to relpoint(C,0.25) dot("relpoint(C, -0.5)", relpoint(C,-0.5),E); dot("relpoint(C, 0.5)", relpoint(C,0.5),W); dot("relpoint(C, 0.75)", relpoint(C,0.75),SE); dot("relpoint(C, 1.25)", relpoint(C,1.25),E);
geometry-fig088
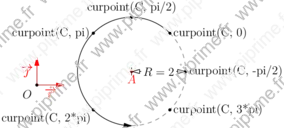
Show geometry/fig0880.asy on Github.
Generated with Asymptote 3.00-0.
Categories : Examples 2D | Geometry.asy
Tags : #Geometry | #Arc | #Circle | #Abscissa | #Point
import geometry; size(10cm,0); // currentcoordsys=cartesiansystem((1,2),i=(1,0.5),j=(-0.5,.75)); show(currentcoordsys, xpen=invisible); point A=(3.5,0.5); dot("$A$",A,S,red); arc C=arc(circle(A,2),45,270,CCW); draw(C,Arrow); draw(complementary(C),grey+dashed); /*<asyxml><view file="modules/geometry.asy" type="void" signature="distance(picture pic,Label,point,point,bool,real,pen,pen,arrow)"/></asyxml>*/ distance("$R=2$",A,point(C.el,0),0); /*<asyxml><view file="modules/geometry.asy" type="point" signature="curpoint(arc,real)"/></asyxml>*/ dot("curpoint(C, 0)", curpoint(C,0),E); dot("curpoint(C, pi/2)", curpoint(C,pi/2),N); dot("curpoint(C, -pi/2)", curpoint(C,-pi/2)); // dot("curpoint(C, pi)", point(C,curabscissa(pi)),W); // OR curpoint(C,pi) dot("curpoint(C, pi)", curpoint(C,pi),W); dot("curpoint(C, 2*pi)", curpoint(C,2*pi),SW); dot("curpoint(C, 3*pi)", curpoint(C,3*pi),E);
geometry-fig089
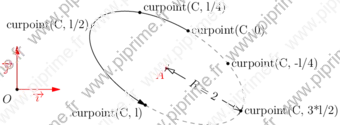
Show geometry/fig0890.asy on Github.
Generated with Asymptote 3.00-0.
Categories : Examples 2D | Geometry.asy
Tags : #Geometry | #Arc | #Ellipse | #Abscissa | #Point
import geometry; size(12cm,0); // currentcoordsys=cartesiansystem((1,2),i=(1,0.5),j=(-0.5,.75)); show(currentcoordsys, xpen=invisible); point A=(3.5,0.5); dot("$A$",A,SW,red); arc C=arc(ellipse(A,2,1,-30),90,270,fromCenter,CCW); real l=arclength(C); draw(C,Arrow); draw(complementary(C),grey+dashed); distance("$R=2$",A,point(C.el,0),0); /*<asyxml><view file="modules/geometry.asy" type="point" signature="curpoint(arc,real)"/></asyxml>*/ dot("curpoint(C, 0)", curpoint(C,0),E); dot("curpoint(C, l/4)", curpoint(C,l/4),0.5N+E); dot("curpoint(C, -l/4)", curpoint(C,-l/4)); dot("curpoint(C, l/2)", point(C,curabscissa(l/2)),W); // point(C,curabscissa(l/2)) is similar to curpoint(C,pi) dot("curpoint(C, l)", curpoint(C,l), SW); dot("curpoint(C, 3*l/2)", curpoint(C,3*l/2),E);
geometry-fig090
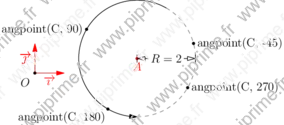
Show geometry/fig0900.asy on Github.
Generated with Asymptote 3.00-0.
Categories : Examples 2D | Geometry.asy
Tags : #Geometry | #Arc | #Circle | #Abscissa | #Point
import geometry; size(10cm,0); // currentcoordsys=cartesiansystem((1,2),i=(1,0.5),j=(-0.5,.75)); show(currentcoordsys, xpen=invisible); point A=(3.5,0.5); dot("$A$", A, S, red); arc C=arc(circle(A,2), 60, 270, CCW); draw(C,Arrow); draw(complementary(C), grey+dashed); distance("$R=2$",A,point(C.el,0),0); /*<asyxml><view file="modules/geometry.asy" type="point" signature="angpoint(arc,real)"/></asyxml>*/ dot("angpoint(C, 90)", angpoint(C,90), W); dot("angpoint(C, 180)", point(C,angabscissa(180)), SW); // point(C,angabscissa(180)) is similar to angpoint(C,180) dot("angpoint(C, 270)", angpoint(C,270), E); dot("angpoint(C, -45)", angpoint(C,-45), E);
geometry-fig091
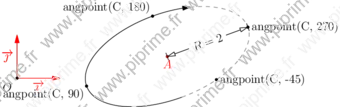
Show geometry/fig0910.asy on Github.
Generated with Asymptote 3.00-0.
Categories : Examples 2D | Geometry.asy
Tags : #Geometry | #Arc | #Ellipse | #Point | #Abscissa
import geometry; size(12cm,0); // currentcoordsys=cartesiansystem((1,2),i=(1,0.5),j=(-0.5,.75)); show(currentcoordsys, xpen=invisible); point A=(3.5,0.5); dot("$A$", A, S, red); /*<asyxml><view file="modules/geometry.asy" type="arc" signature="reverse(arc)"/></asyxml>*/ arc C=reverse(arc(ellipse(A,2,1,20), 45, 270, fromCenter)); draw(C,Arrow); draw(complementary(C), grey+dashed); distance("$R=2$",A,point(C.el,0),0); /*<asyxml><view file="modules/geometry.asy" type="point" signature="angpoint(arc,real)"/></asyxml>*/ dot("angpoint(C, 90)", angpoint(C,90), SW); dot("angpoint(C, 180)", point(C,angabscissa(180)), NW); // point(C,angabscissa(180)) is similar to angpoint(C,180) dot("angpoint(C, 270)", angpoint(C,270), E); dot("angpoint(C, -45)", angpoint(C,-45), E);
geometry-fig092
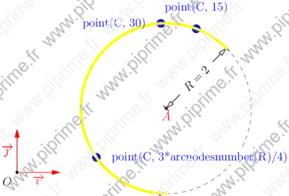
Show geometry/fig0920.asy on Github.
Generated with Asymptote 3.00-0.
Categories : Examples 2D | Geometry.asy
Tags : #Geometry | #Arc | #Circle | #Abscissa | #Point
import geometry; unitsize(1.5cm); // currentcoordsys=cartesiansystem((1,2),i=(1,0.5),j=(-0.5,.75)); show(currentcoordsys, xpen=invisible); real R=2; point A=(3.5,1.5); dot("$A$",A,S,red); arc C=arc(circle(A,2), 45, 270); draw(C,Arrow); draw(complementary(C),grey+dashed); distance("$R=2$",A,point(C,0),0); /*<asyxml><view file="modules/geometry.asy" type="point" signature="point(arc,real)"/></asyxml>*/ dot("point(C, 15)", point(C,15), 2N, 3mm+blue); dot("point(C, 30)", point(C,nodabscissa(30)), // OR point(C,40) 2W,3mm+blue); /*<asyxml><view file="modules/geometry.asy" type="int" signature="arcnodesnumber(explicit arc)"/></asyxml>*/ dot(Label("point(C, 3*arcnodesnumber(R)/4)",UnFill), point(C, 3*arcnodesnumber(C)/4), 2E, 3mm+blue); dot((path)C, yellow);
geometry-fig093
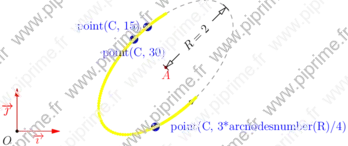
Show geometry/fig0930.asy on Github.
Generated with Asymptote 3.00-0.
Categories : Examples 2D | Geometry.asy
Tags : #Geometry | #Arc | #Ellipse | #Abscissa | #Point
import geometry; unitsize(1.5cm); // currentcoordsys=cartesiansystem((1,2),i=(1,0.5),j=(-0.5,.75)); show(currentcoordsys, xpen=invisible); real R=2; point A=(3.5,1.5); dot("$A$",A,S,red); arc C=arc(ellipse(A,2,1,45), 45, 270, fromCenter); draw(C,Arrow); draw(complementary(C),grey+dashed); distance("$R=2$",A,point(C.el,0),0); /*<asyxml><view file="modules/geometry.asy" type="point" signature="point(arc,real)"/></asyxml>*/ dot("point(C, 15)", point(C,15), W, 3mm+blue); dot("point(C, 30)", point(C,nodabscissa(30)), // OR point(C,40) S,3mm+blue); /*<asyxml><view file="modules/geometry.asy" type="int" signature="arcnodesnumber(explicit arc)"/></asyxml>*/ dot(Label("point(C, 3*arcnodesnumber(R)/4)",UnFill), point(C, 3*arcnodesnumber(C)/4), 2E, 3mm+blue); dot((path)C, yellow);
geometry-fig094
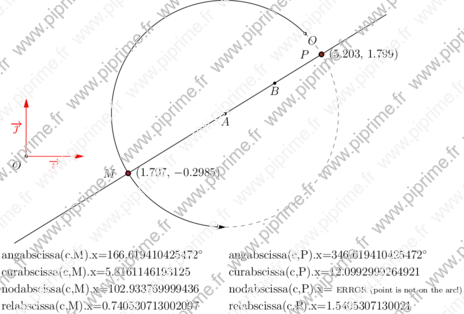
Show geometry/fig0940.asy on Github.
Generated with Asymptote 3.00-0.
Categories : Examples 2D | Geometry.asy
Tags : #Geometry | #Arc | #Circle | #Abscissa | #Point
import geometry; unitsize(2cm); linemargin=0.5cm; // currentcoordsys=cartesiansystem((1,2),i=(1,0.5),j=(-0.5,.75)); show(currentcoordsys, xpen=invisible); point A=(3.5,0.75); dot("$A$",A,S); point B=A+(cos(0.5),cos(1)); dot("$B$",B,S); arc c=arc(circle(A,2), 45, 270, CCW); arc cc=complementary(c); draw(c,Arrow); draw(cc,dashed+grey); line l=line(A,B); draw(l); point M=intersectionpoints(l,c)[0]; point P=intersectionpoints(l,cc)[0]; dot("", M, 2E); dot("$M$", M, 2W, linewidth(2mm)); dot("", P, 2E); dot("$P$", P, 2W, linewidth(2mm)); dot("$O$", point(c,0), SE); point p=A-(4,2.5); transform t=shift((0,-0.3)); transform T=shift((4,0)); real x; /*<asyxml><view file="modules/geometry.asy" type="abscissa" signature="angabscissa(arc,point)"/></asyxml>*/ x=angabscissa(c,M).x; label("angabscissa(c,M).x=$"+(string)x+"^\circ$",p,E); dot(angpoint(c,x),1mm+red); x=angabscissa(c,P).x; label("angabscissa(c,P).x=$"+(string)x+"^\circ$",T*p,E); dot(angpoint(c,x),1mm+red); p=t*p; /*<asyxml><view file="modules/geometry.asy" type="abscissa" signature="curabscissa(arc,point)"/></asyxml>*/ x=curabscissa(c,M).x; dot(curpoint(c,x),1mm+red); label("curabscissa(c,M).x="+(string)x,p,E); x=curabscissa(c,P).x; label("curabscissa(c,P).x="+(string)x,T*p,E); dot(curpoint(c,x),1mm+red); p=t*p; /*<asyxml><view file="modules/geometry.asy" type="abscissa" signature="nodabscissa(arc,point)"/></asyxml>*/ x=nodabscissa(c,M).x; label("nodabscissa(c,M).x="+(string)x,p,E); dot(point(c,x),1mm+red); label("nodabscissa(c,P).x= \scriptsize{ERROR (point is not on the arc!)}",T*p,E); p=t*p; /*<asyxml><view file="modules/geometry.asy" type="abscissa" signature="relabscissa(arc,point)"/></asyxml>*/ x=relabscissa(c,M).x; label("relabscissa(c,M).x="+(string)x,p,E); dot(relpoint(c,x),1mm+red); x=relabscissa(c,P).x; label("relabscissa(c,P).x="+(string)x,T*p,E); dot(relpoint(c,x),1mm+red);
geometry-fig095
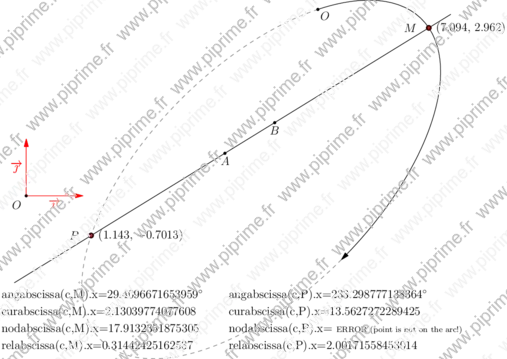
Show geometry/fig0950.asy on Github.
Generated with Asymptote 3.00-0.
Categories : Examples 2D | Geometry.asy
Tags : #Geometry | #Arc | #Ellipse | #Abscissa | #Point
import geometry; unitsize(2cm); linemargin=0.5cm; // currentcoordsys=cartesiansystem((1,2),i=(1,0.5),j=(-0.5,.75)); show(currentcoordsys, xpen=invisible); point A=(3.5,0.75); dot("$A$",A,S); point B=A+(cos(0.5),cos(1)); dot("$B$",B,S); arc c=rotate(45,B)*xscale(2,A)*arc(circle(A,2), 45, 270, CCW); arc cc=complementary(c); draw(c,Arrow); draw(cc,dashed+grey); line l=line(A,B); draw(l); point M=intersectionpoints(l,c)[0]; point P=intersectionpoints(l,cc)[0]; dot("", M, 2E); dot("$M$", M, 2W, linewidth(2mm)); dot("", P, 2E); dot("$P$", P, 2W, linewidth(2mm)); dot("$O$", point(c,0), SE); point p=A-(4,2.5); transform t=shift((0,-0.3)); transform T=shift((4,0)); real x; /*<asyxml><view file="modules/geometry.asy" type="abscissa" signature="angabscissa(arc,point)"/></asyxml>*/ x=angabscissa(c,M).x; label("angabscissa(c,M).x=$"+(string)x+"^\circ$",p,E); dot(angpoint(c,x),1mm+red); x=angabscissa(c,P).x; label("angabscissa(c,P).x=$"+(string)x+"^\circ$",T*p,E); dot(angpoint(c,x),1mm+red); p=t*p; /*<asyxml><view file="modules/geometry.asy" type="abscissa" signature="curabscissa(arc,point)"/></asyxml>*/ x=curabscissa(c,M).x; dot(curpoint(c,x),1mm+red); label("curabscissa(c,M).x="+(string)x,p,E); x=curabscissa(c,P).x; label("curabscissa(c,P).x="+(string)x,T*p,E); dot(curpoint(c,x),1mm+red); p=t*p; /*<asyxml><view file="modules/geometry.asy" type="abscissa" signature="nodabscissa(arc,point)"/></asyxml>*/ x=nodabscissa(c,M).x; label("nodabscissa(c,M).x="+(string)x,p,E); dot(point(c,x),1mm+red); label("nodabscissa(c,P).x= \scriptsize{ERROR (point is not on the arc!)}",T*p,E); p=t*p; /*<asyxml><view file="modules/geometry.asy" type="abscissa" signature="relabscissa(arc,point)"/></asyxml>*/ x=relabscissa(c,M).x; label("relabscissa(c,M).x="+(string)x,p,E); dot(relpoint(c,x),1mm+red); x=relabscissa(c,P).x; label("relabscissa(c,P).x="+(string)x,T*p,E); dot(relpoint(c,x),1mm+red);
geometry-fig096
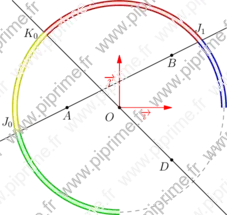
Show geometry/fig0960.asy on Github.
Generated with Asymptote 3.00-0.
Categories : Examples 2D | Geometry.asy
Tags : #Geometry | #Arc | #Circle | #Line | #Abscissa | #Intersection | #Point
import geometry; size(8cm); // currentcoordsys=cartesiansystem((1,2),i=(1,0.5),j=(-0.5,.75)); show(currentcoordsys, xpen=invisible); point A=(-1,0) ; dot("$A$",A,S); point B=(1,1) ; dot("$B$",B,S); point C=(0,0) ; point D=(1,-1) ; dot("$D$",D,SW); arc c=arc(circle(C,2), 0, 270); draw(complementary(c),dashed+grey); line l1=line(A,B); draw(l1); line l2=line(C,D); draw(l2); point[] J=intersectionpoints(l1,c); point[] K=intersectionpoints(l2,c); /*<asyxml><view file="modules/geometry.asy" type="arc" signature="arc(explicit arc,point,point)"/></asyxml>*/ draw(arc(c,K[0],J[0]),2mm+0.8yellow); draw(arc(c,J[1],K[0]),2mm+0.8red); /*<asyxml><view file="modules/geometry.asy" type="arc" signature="arc(explicit arc,abscissa,abscissa)"/></asyxml>*/ draw(arc(c,relabscissa(c,J[0]),relabscissa(1)),2mm+0.8green); draw(arc(c,relabscissa(0),relabscissa(c,J[1])),2mm+0.8blue); dot("$J_0$",J[0],2NW); dot("$J_1$",J[1],2N); dot("$K_0$",K[0],2W); draw(c, 1mm+white);
geometry-fig097
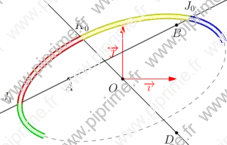
Show geometry/fig0970.asy on Github.
Generated with Asymptote 3.00-0.
Categories : Examples 2D | Geometry.asy
Tags : #Geometry | #Arc | #Ellipse | #Line | #Abscissa | #Intersection | #Point
import geometry; size(8cm); // currentcoordsys=cartesiansystem((1,2),i=(1,0.5),j=(-0.5,.75)); show(currentcoordsys, xpen=invisible); point A=(-1,0) ; dot("$A$",A,S); point B=(1,1) ; dot("$B$",B,S); point C=(0,0) ; point D=(1,-1) ; dot("$D$",D,SW); arc c=arc(ellipse(C,2,1,20), 0, 270); draw(complementary(c),dashed+grey); line l1=line(A,B); draw(l1); line l2=line(C,D); draw(l2); point[] J=intersectionpoints(l1,c); point[] K=intersectionpoints(l2,c); /*<asyxml><view file="modules/geometry.asy" type="arc" signature="arc(explicit arc,point,point)"/></asyxml>*/ draw(arc(c,J[0],K[0]),2mm+0.8yellow); draw(arc(c,K[0],J[1]),2mm+0.8red); /*<asyxml><view file="modules/geometry.asy" type="arc" signature="arc(explicit arc,abscissa,abscissa)"/></asyxml>*/ draw(arc(c,relabscissa(c,J[1]),relabscissa(1)),2mm+0.8green); draw(arc(c,relabscissa(0),relabscissa(c,J[0])),2mm+0.8blue); dot("$J_0$",J[0],2N); dot("$J_1$",J[1],N+2W); dot("$K_0$",K[0],2N); draw(c, 1mm+white);
geometry-fig098
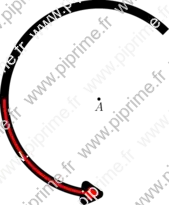
Show geometry/fig0980.asy on Github.
Generated with Asymptote 3.00-0.
Categories : Examples 2D | Geometry.asy
Tags : #Geometry | #Arc | #Arrows/Bars | #Circle | #Abscissa
import geometry; size(6cm,0); // currentcoordsys=cartesiansystem((1,2),i=(1,0.5),j=(-0.5,.75)); // show(currentcoordsys, xpen=invisible); point A=(-1,1); dot("$A$",A,S); arc a=arc(circle(A,2), 45, 270); draw(a,linewidth(3mm),ArcArrow(5mm)); /*<asyxml><view file="modules/geometry.asy" type="arc" signature="arc(explicit arc,abscissa,abscissa)"/></asyxml>*/ draw(arc(a,angabscissa(135),angabscissa(225)),1mm+red,ArcArrow(3mm),TrueMargin(0,0.5mm));
geometry-fig099
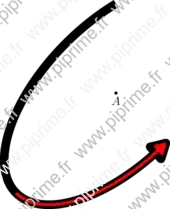
Show geometry/fig0990.asy on Github.
Generated with Asymptote 3.00-0.
Categories : Examples 2D | Geometry.asy
Tags : #Geometry | #Arc | #Arrows/Bars | #Ellipse | #Abscissa
import geometry; size(6cm,0); // currentcoordsys=cartesiansystem((1,2),i=(1,0.5),j=(-0.5,.75)); // show(currentcoordsys, xpen=invisible); point A=(-1,1); dot("$A$",A,S); arc a=arc(ellipse(A,2,1,45), 45, 270, fromCenter); draw(a,linewidth(3mm),ArcArrow(5mm)); /*<asyxml><view file="modules/geometry.asy" type="arc" signature="arc(explicit arc,abscissa,abscissa)"/></asyxml>*/ draw(arc(a,angabscissa(135),angabscissa(225)),1mm+red,ArcArrow(3mm),TrueMargin(0,0.5mm));
geometry-fig100

Show geometry/fig1000.asy on Github.
Generated with Asymptote 3.00-0.
Categories : Examples 2D | Geometry.asy
Tags : #Geometry | #Arc | #Arrows/Bars | #Circle | #Abscissa | #Coords system
import geometry; size(6cm,0); currentcoordsys=cartesiansystem((1,2),i=(1,0.5),j=(-0.5,.75)); show(currentcoordsys, xpen=invisible); point A=(-1,1); point B=(2,2); point M=(1,3); /*<asyxml><view file="modules/geometry.asy" type="arc" signature="arccircle(point,point,point)"/></asyxml>*/ arc AMB=arccircle(A,M,B); draw(AMB,linewidth(3mm),Arrow(5mm),TrueMargin(0,0.5mm)); dot("$C$",AMB.el.C); draw(arccircle(A,B,M),1mm+red,Arrow(3mm)); dot("$A$",A,2SW,blue); dot("$B$",B,2E,blue); dot("$M$",M,2N,blue);
geometry-fig101
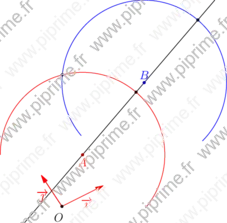
Show geometry/fig1010.asy on Github.
Generated with Asymptote 3.00-0.
Categories : Examples 2D | Geometry.asy
Tags : #Geometry | #Arc | #Circle | #Intersection | #Line | #Coords system
import geometry; size(8cm,0); currentcoordsys=cartesiansystem((1,2),i=(1,0.5),j=(-0.5,.75)); show(currentcoordsys, xpen=invisible); real R=2; point A=(1,1); dot("$A$", A, S, red); point B=A+(2,1); dot("$B$", B, N, blue); arc a=arc(circle(A,R), -40, 180); arc b=arc(circle(B,R), -45, 220); line l=line(A,B); draw(a,red); draw(b,blue); draw(l); /*<asyxml><view file="modules/geometry.asy" type="point[]" signature="intersectionpoints(arc,arc)"/></asyxml>*/ point[] inter=intersectionpoints(a,b); dot(inter); /*<asyxml><view file="modules/geometry.asy" type="point[]" signature="intersectionpoints(line,arc)"/></asyxml>*/ point[] inter=intersectionpoints(l,a); dot(inter); point[] inter=intersectionpoints(l,b); dot(inter);
geometry-fig102
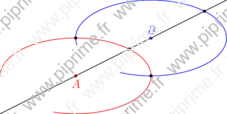
Show geometry/fig1020.asy on Github.
Generated with Asymptote 3.00-0.
Categories : Examples 2D | Geometry.asy
Tags : #Geometry | #Arc | #Ellipse | #Intersection | #Line | #Coords system
import geometry; size(8cm,0); // currentcoordsys=cartesiansystem((1,2),i=(1,0.5),j=(-0.5,.75)); // show(currentcoordsys, xpen=invisible); real R=2; point A=(1,1); dot("$A$", A, S, red); point B=A+(2,1); dot("$B$", B, N, blue); arc a=arc(ellipse(A,R,R/2), -40, 180); arc b=arc(ellipse(B,R,R/2), -45, 220); line l=line(A,B); draw(a,red); draw(b,blue); draw(l); /*<asyxml><view file="modules/geometry.asy" type="point[]" signature="intersectionpoints(arc,arc)"/></asyxml>*/ point[] inter=intersectionpoints(a,b); dot(inter); /*<asyxml><view file="modules/geometry.asy" type="point[]" signature="intersectionpoints(line,arc)"/></asyxml>*/ point[] inter=intersectionpoints(l,a); dot(inter); point[] inter=intersectionpoints(l,b); dot(inter);
geometry-fig103
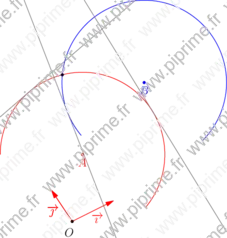
Show geometry/fig1030.asy on Github.
Generated with Asymptote 3.00-0.
Categories : Examples 2D | Geometry.asy
Tags : #Geometry | #Arc | #Circle | #Intersection | #Line | #Coords system | #Tangent
import geometry; size(8cm,0); currentcoordsys=cartesiansystem((1,2),i=(1,0.5),j=(-0.5,.75)); show(currentcoordsys, xpen=invisible); real R=2; point A=(1,1.5); dot("$A$",A,S,red); point B=A+(2,1); dot("$B$",B,S,blue); arc a=arc(circle(A,R),-40,180); arc b=arc(circle(B,R),-45,220); draw(a,red); draw(b,blue); point M=intersectionpoints(a,b)[0]; dot(M); /*<asyxml><view file="modules/geometry.asy" type="line" signature="tangent(explicit arc,point)"/></asyxml>*/ draw(tangent(a,M), grey); draw(tangent(b,M), grey); /*<asyxml><view file="modules/geometry.asy" type="line" signature="tangent(explicit arc,abscissa)"/></asyxml>*/ draw(tangent(a,angabscissa(45)), grey);
geometry-fig104
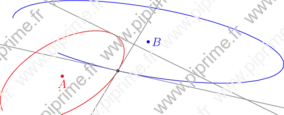
Show geometry/fig1040.asy on Github.
Generated with Asymptote 3.00-0.
Categories : Examples 2D | Geometry.asy
Tags : #Geometry | #Arc | #Ellipse | #Intersection | #Line | #Coords system | #Tangent
import geometry; size(10cm,0); // currentcoordsys=cartesiansystem((1,2),i=(1,0.5),j=(-0.5,.75)); // show(currentcoordsys, xpen=invisible); real R=2; point A=(1,1.5); dot("$A$",A,S,red); point B=A+(2.5,1); dot("$B$",B,E,blue); arc a=arc(ellipse(A,R,R/2,30),-40,180); // ellispenodesnumberfactor=400; arc b=arc(ellipse(B,2R,R/2,-10),-30,180); draw(a,red); draw(b,blue); point M=intersectionpoints(a,b)[0]; dot(M); /*<asyxml><view file="modules/geometry.asy" type="line" signature="tangent(explicit arc,point)"/></asyxml>*/ draw(tangent(a,M), grey); draw(tangent(b,M), grey); /*<asyxml><view file="modules/geometry.asy" type="line" signature="tangent(explicit arc,abscissa)"/></asyxml>*/ draw(tangent(a,angabscissa(45)), grey);
geometry-fig105
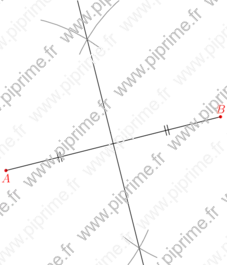
Show geometry/fig1050.asy on Github.
Generated with Asymptote 3.00-0.
Categories : Examples 2D | Geometry.asy
Tags : #Geometry | #Segment | #Intersection | #Line | #Markers | #Point
import geometry; size(8cm,0); // currentcoordsys=cartesiansystem((1,2),i=(1,0.5),j=(-0.5,.75)); // show(currentcoordsys, xpen=invisible); point A=(0.25,0.25); point B=A+(1,0.25); dot("$A$",A,S,red); dot("$B$",B,N,red); segment s=segment(A,B); line bis=bisector(s); draw(s,StickIntervalMarker(2,2)); draw(bis); /*<asyxml><view file="modules/geometry.asy" type="path" signature="compassmark(pair,pair,real,real)"/></asyxml>*/ draw(compassmark(A, point(bis,0.75), position=0.25,angle=25), grey); draw(compassmark(B, point(bis,0.75), position=0.75,angle=25), grey); /*<asyxml><view file="modules/geometry.asy" type="point" signature="point(line,real)"/></asyxml>*/ draw(compassmark(A, point(bis,0.25), position=0.5,angle=15), grey); draw(compassmark(B, point(bis,0.25), position=0.5,angle=15), grey);
geometry-fig106
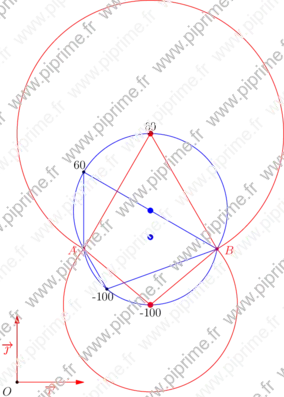
Show geometry/fig1060.asy on Github.
Generated with Asymptote 3.00-0.
Categories : Examples 2D | Geometry.asy
Tags : #Geometry | #Arc | #Point
import geometry; size(10cm,0); // currentcoordsys=cartesiansystem((1,2),i=(1,0.5),j=(-0.5,.75)); show(currentcoordsys, xpen=invisible); point A=(1,2); point B=A+(2,0); dot("$A$",A,0.25S+2W,red); dot("$B$",B,0.25S+2E,red); for (int i=0; i < 2; ++i) { real a=(i == 0) ? 60 : -100; /*<asyxml><view file="modules/geometry.asy" type="point" signature="arcsubtendedcenter(point,point,real)"/></asyxml>*/ dot(arcsubtendedcenter(A,B,a),2mm+blue); point arccenter=arcsubtendedcenter(A,B,a/2); dot(arccenter,2mm+red); /*<asyxml><view file="modules/geometry.asy" type="arc" signature="arcsubtended(point,point,real)"/></asyxml>*/ arc arcsubtended=arcsubtended(A,B,a); draw(arcsubtended,blue); arc arc=arcsubtended(A,B,a/2); draw(arc,red); point M=relpoint(arcsubtended,0.75); dot(format("%0g",degrees(B-M)-degrees(A-M)), M,(-1)^(i+1)*I*dir(arcsubtended,reltime(arcsubtended,0.6))); draw(A--M--B,blue); label(format("%0g",degrees(B-arccenter)-degrees(A-arccenter)), arccenter,(-1)^(i+1)*S); draw(A--arccenter--B,red); }
geometry-fig107
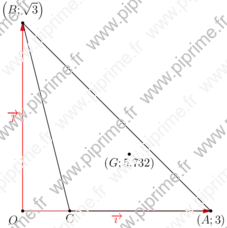
Show geometry/fig1070.asy on Github.
Generated with Asymptote 3.00-0.
Categories : Examples 2D | Geometry.asy
Tags : #Geometry | #Mass | #Point/Dot | #Point
import geometry; size(8cm,0); // currentcoordsys=cartesiansystem((1,2),i=(1,0.5),j=(-0.5,.75)); show(currentcoordsys, xpen=invisible); /*<asyxml><view file="modules/geometry.asy" type="" signature="struct mass"/></asyxml>*/ mass A=mass((1,0),3);/*<asyxml><view file="modules/geometry.asy" type="mass" signature="mass(point,real)"/></asyxml>*/ mass B=mass((0,1),sqrt(3)); point C=(0.25,0); /*<asyxml><view file="modules/geometry.asy" type="void" signature="dot(picture,Label,mass,align,string,pen)"/></asyxml>*/ dot("$\left(B;\sqrt{3}\right)$",B,N,format=""); dot("C",C,S); dot("A",A,S); draw(A--B--C--cycle); /*<asyxml><view file="modules/geometry.asy" type="mass" signature="masscenter(... mass[])"/></asyxml>*/ dot("G",masscenter(A,B,mass(C)),S);
geometry-fig108

Show geometry/fig1080.asy on Github.
Generated with Asymptote 3.00-0.
Categories : Examples 2D | Geometry.asy
Tags : #Geometry | #Triangle
import geometry; size(10cm); // currentcoordsys=cartesiansystem((2,1),i=(1,0.5),j=(-0.25,.75)); // show(currentcoordsys); /*<asyxml><view file="modules/geometry.asy" type="triangle" signature="triangleabc(real,real,real,real,point)"/></asyxml>*/ triangle t=triangleabc(3,4,5); /*<asyxml><view file="modules/geometry.asy" type="void" signature="show(picture,Label,Label,Label,Label,Label,Label,triangle,pen,filltype)"/></asyxml>*/ show(La="3", Lb="4", Lc="5",t);
geometry-fig109
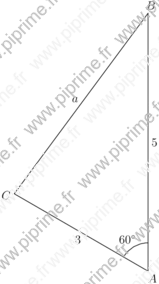
Show geometry/fig1090.asy on Github.
Generated with Asymptote 3.00-0.
Categories : Examples 2D | Geometry.asy
Tags : #Geometry | #Triangle | #Markers
import geometry; size(10cm); // currentcoordsys=cartesiansystem((2,1),i=(1,0.5),j=(-0.25,.75)); // show(currentcoordsys); /*<asyxml><view file="modules/geometry.asy" type="triangle" signature="triangleAbc(real,real,real,real,point)"/></asyxml>*/ triangle t=triangleAbc(60,3,5,angle=90); show(Lb="3", Lc="5",t); markangle("$60^\circ$",t.B,t.A,t.C);
geometry-fig110
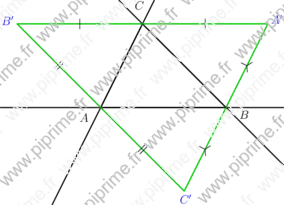
Show geometry/fig1100.asy on Github.
Generated with Asymptote 3.00-0.
Categories : Examples 2D | Geometry.asy
Tags : #Geometry | #Triangle | #Markers | #Label | #Segment
import geometry; size(10cm,0); // currentcoordsys=cartesiansystem((2,1),i=(1,0.5),j=(-0.25,0.75)); // show(currentcoordsys); triangle t=triangle((-1,0), (2,0), (0,2)); drawline(t, linewidth(bp)); /*<asyxml><view file="modules/geometry.asy" type="void" signature="label(picture,Label,Label,Label,triangle,real,real,pen,filltype)"/></asyxml>*/ label(t, alignFactor=4); /*<asyxml><view file="modules/geometry.asy" type="triangle" signature="anticomplementary(triangle)"/></asyxml>*/ triangle at=anticomplementary(t); draw(at, bp+0.8green); label("$A'$", "$B'$", "$C'$", at, blue); draw(segment(at.AB), bp+0.8green, StickIntervalMarker(2,1)); draw(segment(at.BC), bp+0.8green, StickIntervalMarker(2,2)); draw(segment(at.CA), bp+0.8green, CrossIntervalMarker(2,3));
geometry-fig111
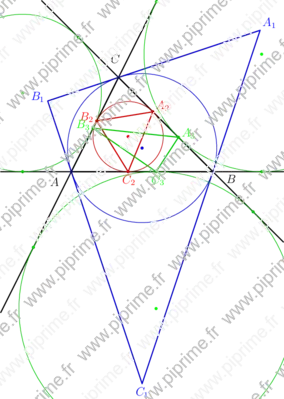
Show geometry/fig1110.asy on Github.
Generated with Asymptote 3.00-0.
Categories : Examples 2D | Geometry.asy
Tags : #Geometry | #Triangle | #Circle | #Tangent | #Line | #Label | #Point
import geometry; size(10cm,0); // currentcoordsys=cartesiansystem((2,1),i=(1,0.5),j=(-0.25,0.75)); // show(currentcoordsys); triangle t=triangle((-1,0), (2,0), (0,2)); /*<asyxml><view file="modules/geometry.asy" type="void" signature="drawline(picture,triangle,pen)"/></asyxml>*/ drawline(t, linewidth(bp)); /*<asyxml><view file="modules/geometry.asy" type="void" signature="label(picture,Label,Label,Label,triangle,real,real,pen,filltype)"/></asyxml>*/ label(t,alignFactor=4); /*<asyxml><view file="modules/geometry.asy" type="circle" signature="circle(triangle)"/></asyxml>*/ circle cc=circle(t); draw(cc, 0.8blue); dot(cc.C, blue); /*<asyxml><view file="modules/geometry.asy" type="triangle" signature="tangential(triangle)"/></asyxml>*/ triangle tgt=tangential(t); draw(tgt, bp+0.8blue); label("$A_1$", "$B_1$", "$C_1$", tgt, blue); /*<asyxml><view file="modules/geometry.asy" type="circle" signature="incircle(triangle)"/></asyxml>*/ circle ic=incircle(t); draw(ic, 0.8red); dot(ic.C, red); triangle intouch=intouch(t); draw(intouch, bp+0.8red); label("$A_2$", "$B_2$", "$C_2$", intouch, red); /*<asyxml><view file="modules/geometry.asy" type="circle" signature="excircle(side,triangle)"/></asyxml>*/ circle ec=excircle(t.AB); clipdraw(ec, 0.8green); dot(ec.C, green); ec=excircle(t.AC); clipdraw(ec, 0.8green); dot(ec.C, green); ec=excircle(t.BC); clipdraw(ec, 0.8green); dot(ec.C, green); /*<asyxml><view file="modules/geometry.asy" type="triangle" signature="extouch(triangle)"/></asyxml>*/ triangle ext=extouch(t); draw(ext, bp+0.8green); label("$A_3$", "$B_3$", "$C_3$", ext, green); /*<asyxml><view file="modules/geometry.asy" type="point" signature="extouch(side)"/></asyxml>*/ dot(extouch(t.AB), 0.8*green); dot(extouch(t.BC), 0.8*green); dot(extouch(t.CA), 0.8*green); /*<asyxml><view file="modules/geometry.asy" type="point" signature="intouch(side)"/></asyxml>*/ dot(intouch(t.AB), 0.8*red); dot(intouch(t.BC), 0.8*red); dot(intouch(t.CA), 0.8*red); // Enlarge the bounding box of the current picture draw(box((-2.5,-3), (3.5,3.5)), invisible);
geometry-fig112
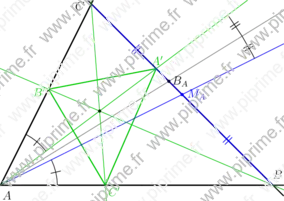
Show geometry/fig1120.asy on Github.
Generated with Asymptote 3.00-0.
Categories : Examples 2D | Geometry.asy
Tags : #Geometry | #Triangle | #Line | #Label | #Point | #Markers
import geometry; size(10cm,0); // currentcoordsys=cartesiansystem((2,1),i=(1,0.5),j=(-0.25,0.75)); // show(currentcoordsys); triangle t=triangle((-1,0), (2,0), (0,2)); drawline(t, linewidth(bp)); label(t,alignFactor=2, alignAngle=90); /*<asyxml><view file="modules/geometry.asy" type="triangle" signature="symmedial(triangle)"/></asyxml>*/ triangle st=symmedial(t); draw(st, bp+0.8green); label("$A'$", "$B'$", "$C'$", st, alignAngle=45, 0.8green); /*<asyxml><view file="modules/geometry.asy" type="line" signature="median(vertex)"/></asyxml>*/ line mA=median(t.VA); draw(mA, blue); dot("$M_A$",midpoint(t.BC), 1.5E, blue); draw(segment(t.BC), bp+blue, StickIntervalMarker(2,2,blue)); /*<asyxml><view file="modules/geometry.asy" type="line" signature="bisector(vertex,real)"/></asyxml>*/ line bA=bisector(t.VA); draw(bA, grey); /*<asyxml><view file="modules/geometry.asy" type="point" signature="bisectorpoint(side)"/></asyxml>*/ dot("$B_A$", bisectorpoint(t.BC)); /*<asyxml><view file="modules/geometry.asy" type="line" signature="symmedian(vertex)"/></asyxml>*/ line sA=symmedian(t.VA); draw(sA, 0.8*green); draw(symmedian(t.VB), 0.8*green); draw(symmedian(t.VC), 0.8*green); /*<asyxml><view file="modules/geometry.asy" type="point" signature="symmedian(triangle)"/></asyxml>*/ point sP=symmedian(t); dot(sP); markangle(sA, (line) t.AC, radius=2cm, StickIntervalMarker(1,1)); markangle((line) t.AB, mA, radius=2cm, StickIntervalMarker(1,1)); markangle(mA, sA, radius=10cm, StickIntervalMarker(2,2));
geometry-fig113
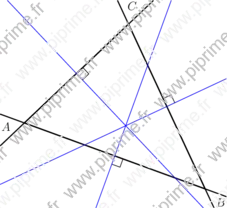
Show geometry/fig1130.asy on Github.
Generated with Asymptote 3.00-0.
Categories : Examples 2D | Geometry.asy
Tags : #Geometry | #Triangle | #Line | #Markers | #Transform/scale/shift/rotate | #Perpendicular
import geometry; size(8cm,0); // currentcoordsys=cartesiansystem((2,1),i=(1,0.5),j=(-0.25,0.75)); // show(currentcoordsys); triangle t=rotate(-20)*triangle((-1,0), (2,0), (0,2)); drawline(t, linewidth(bp)); label(t,alignFactor=4); line bab=bisector(t.AB); draw(bab, blue); perpendicularmark(t.AB,bab,quarter=4); line bac=bisector(t.AC); draw(bac, blue); perpendicularmark(t.AC,bac,quarter=4); line bbc=bisector(t.BC); draw(bbc, blue); perpendicularmark(t.BC,bbc,quarter=4);
geometry-fig114
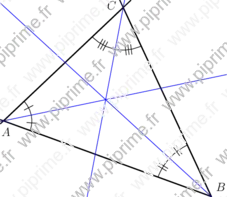
Show geometry/fig1140.asy on Github.
Generated with Asymptote 3.00-0.
Categories : Examples 2D | Geometry.asy
Tags : #Geometry | #Triangle | #Line | #Point | #Markers
import geometry; size(8cm,0); // currentcoordsys=cartesiansystem((2,1),i=(1,0.5),j=(-0.25,0.75)); // show(currentcoordsys); triangle t=rotate(-20)*triangle((-1,0), (2,0), (0,2)); drawline(t, linewidth(bp)); label(t, alignAngle=90, alignFactor=2); /*<asyxml><view file="modules/geometry.asy" type="point" signature="incenter(triangle)"/></asyxml>*/ point incenter=incenter(t); line ba=bisector(t.VA); draw(ba, blue); markangle((line) t.AB, (line) t.AC,StickIntervalMarker(i=2,n=1)); line bb=bisector(t.VB); draw(bb, blue); markangle((line) t.BC, (line) t.BA, radius=2cm, StickIntervalMarker(i=2,n=2)); line bc=bisector(t.VC); draw(bc, blue); markangle((line) t.CA, (line) t.CB, radius=1.5cm, StickIntervalMarker(i=2,n=3));
geometry-fig115
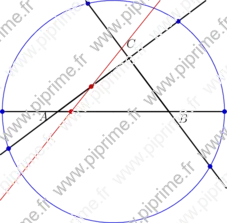
Show geometry/fig1150.asy on Github.
Generated with Asymptote 3.00-0.
Categories : Examples 2D | Geometry.asy
Tags : #Geometry | #Triangle | #Line | #Point | #Intersection
import geometry; size(8cm); // currentcoordsys=cartesiansystem((2,1),i=(1,0.5),j=(-0.25,.75)); // show(currentcoordsys); dotfactor *=1.5; triangle t=triangleabc(3,4,5); drawline(t, linewidth(bp)); label(t, alignFactor=3); line l=line((-1,-2), (1,0.5)); draw(l, 0.8*red); /*<asyxml><view file="modules/geometry.asy" type="point[]" signature="intersectionpoints(triangle,line,bool)"/></asyxml>*/ dot(intersectionpoints(t,l), 0.8*red); circle C=2*circle(t); draw(C, 0.8*blue); /*<asyxml><view file="modules/geometry.asy" type="point[]" signature="intersectionpoints(triangle,conic,bool)"/></asyxml>*/ dot(intersectionpoints(t,C, true), 0.8*blue);
geometry-fig116
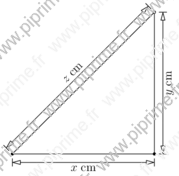
Show geometry/fig1160.asy on Github.
Generated with Asymptote 3.00-0.
Categories : Examples 2D | Geometry.asy
Tags : #Geometry | #Triangle | #Line | #Point/Dot | #Distance | #Shipout | #Bbox
unitsize(1cm); import geometry; point pA = (0,0); point pB = (5,0); point pC = (5,5); dot(pA^^pB^^pC); draw(pA--pB--pC--cycle); distance(Label("$x \; \mathrm{cm}$",align=S),pA,pB,3mm); distance(Label("$y \; \mathrm{cm}$",align=E),pB,pC,3mm); distance(Label("$z \; \mathrm{cm}$",align=I*dir(pA--pC)),pA,pC,-3mm); shipout(bbox(xmargin=1mm,invisible));
geometry-fig117
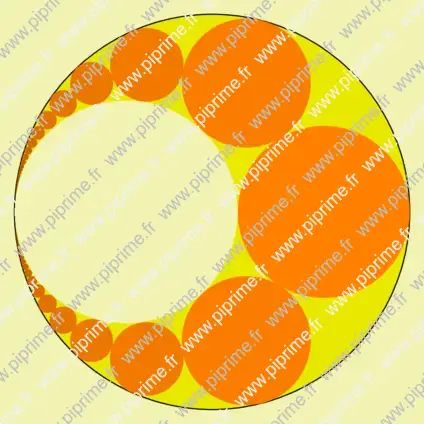
Show geometry/fig1170.asy on Github.
Generated with Asymptote 3.00-0.
Categories : Examples 2D | Geometry.asy
Tags : #Geometry | #Inversion | #Shipout | #Bbox | #Circle | #Line
import geometry; size(15cm); inversion inv=inversion(1,(-3.6,0)); path g1=inv*line((-1,0),(-1,1)), g2=inv*line((1,0),(1,1)); fill(g1,0.91*yellow); draw(g1,linewidth(bp)); unfill(g2); //draw(g2,linewidth(bp)); int n=40; for (int i=-n; i <= n; ++i) { path g=inv*circle((point) (0,2*i),1); fill(g,(1-abs(i)/n)*orange); // draw(g,bp+0.8*orange); //draw(g,black); } shipout(bbox(5mm,Fill(rgb(0.95,0.95,0.7))));
graph-fig001
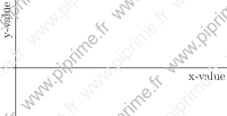
Show graph/fig0010.asy on Github.
Generated with Asymptote 3.00-0.
Categories : Examples 2D | Graph.asy
Tags : #Graph | #Axis
size(8cm,0,false); import graph; xlimits(0, 200); ylimits(-50, 50); yaxis("y-value"); xaxis("x-value");
graph-fig002
Show graph/fig0020.asy on Github.
Generated with Asymptote 3.00-0.
Categories : Examples 2D | Graph.asy
Tags : #Graph | #Axis
size(8cm,0,false); import graph; xlimits(0, 200); ylimits(-50, 50); yaxis( "y-value", Left); xaxis( "x-value", Bottom(true));
graph-fig003
Show graph/fig0030.asy on Github.
Generated with Asymptote 3.00-0.
Categories : Examples 2D | Graph.asy
Tags : #Graph | #Axis
size(8cm,0,false); import graph; xlimits( -100, 100); ylimits( -50, 50); yaxis( "y" , RightTicks()); xaxis( "x", Ticks());
graph-fig004
Show graph/fig0040.asy on Github.
Generated with Asymptote 3.00-0.
Categories : Examples 2D | Graph.asy
Tags : #Graph | #Axis
size(8cm,0); import graph; xlimits( -100, 100); ylimits( -50, 50); yaxis( "$y$" , Ticks(Label(currentpen+fontsize(8),align=E))); xaxis( "$x$", Ticks(Label(currentpen+fontsize(8))));
graph-fig005
Show graph/fig0050.asy on Github.
Generated with Asymptote 3.00-0.
Categories : Examples 2D | Graph.asy
Tags : #Graph | #Axis | #Defaultpen
size(8cm,0); import graph; xlimits( -100, 100); ylimits( -50, 50); defaultpen(overwrite(SuppressQuiet)); yaxis( "$y$" , Ticks(Label(.8red+fontsize(8),align=E)), p=.8red); xaxis( "$x$", Ticks(Label(.8blue+fontsize(8))), p=.8blue);
graph-fig006
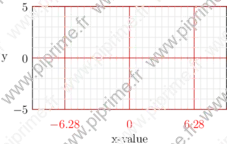
Show graph/fig0060.asy on Github.
Generated with Asymptote 3.00-0.
Categories : Examples 2D | Graph.asy
Tags : #Graph | #Axis | #Grid
size(8cm,0); import graph; xlimits( -3pi, 3pi); ylimits( -5, 5); yaxis( "y" , LeftRight(), RightTicks(pTick=.8red, ptick=lightgrey, extend=true)); xaxis( "x-value", BottomTop(), Ticks(Label("$%.2f$",red), Step=2pi, step=pi/5, pTick=.8red, ptick=lightgrey, extend=true));
graph-fig007
![]()
Show graph/fig0070.asy on Github.
Generated with Asymptote 3.00-0.
Categories : Examples 2D | Graph.asy
Tags : #Graph | #Axis | #Number format
size(8cm,0); import graph; xlimits( -3pi, 3pi); xaxis(BottomTop(), Ticks(Label("$%.2f$",red), Step=2pi, step=pi/5, pTick=.8red));
graph-fig008
![]()
Show graph/fig0080.asy on Github.
Generated with Asymptote 3.00-0.
Categories : Examples 2D | Graph.asy
Tags : #Graph | #Axis | #Number format | #Tex/latex features
size(8cm,0); import graph; texpreamble("\usepackage[frenchb]{babel}"); xlimits( -3pi, 3pi); xaxis(BottomTop(), Ticks(Label("$\nombre{%.2f}$",red), Step=2pi, step=pi/5, pTick=.8red));
graph-fig009
![]()
Show graph/fig0090.asy on Github.
Generated with Asymptote 3.00-0.
Categories : Examples 2D | Graph.asy
Tags : #Graph | #Axis | #Number format | #Tex/latex features
size(8cm,0); import graph; texpreamble("\usepackage[frenchb]{babel}"); xlimits( -10000, 10000); xaxis(BottomTop(), Ticks(Label("$\nombre{%0.f}$",red), Step=5000, step=500, pTick=.8red));
graph-fig010
![]()
Show graph/fig0110.asy on Github.
Generated with Asymptote 3.00-0.
Categories : Examples 2D | Graph.asy
Tags : #Graph | #Axis | #Number format | #Tex/latex features
// An other solution... size(8cm,0); import graph; usepackage("icomma"); xlimits( -3pi, 3pi); xaxis(Ticks(Label(red), Step=2pi,step=pi/5,pTick=.8red));
graph-fig011
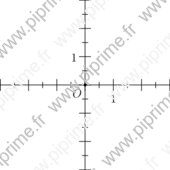
Show graph/fig0120.asy on Github.
Generated with Asymptote 3.00-0.
Categories : Examples 2D | Graph.asy
Tags : #Graph | #Axis | #Label
size(6cm,0); import graph; xlimits( -3, 3); ylimits( -3, 3); xaxis(Ticks("%")); yaxis(Ticks("%")); labelx(1,2S); labely(1,2W); labelx("$O$",0,SW); dot((0,0));
graph-fig012
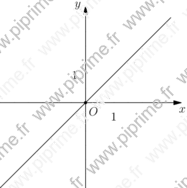
Show graph/fig0130.asy on Github.
Generated with Asymptote 3.00-0.
Categories : Examples 2D | Graph.asy
Tags : #Graph | #Axis | #Label
import graph; unitsize(x=1cm); real f(real x){return x;} xlimits( -3, 3); ylimits( -3, 3); draw(graph(f,-3,3)); xaxis(Label("$x$",position=EndPoint, align=SE),Ticks("%",extend=true), Arrow); yaxis(Label("$y$",position=EndPoint, align=NW),Ticks("%",extend=true), Arrow); labelx(1,2S); labely(1,2W); labelx("$O$",0,SE); dot((0,0));
graph-fig013
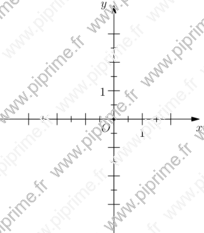
Show graph/fig0140.asy on Github.
Generated with Asymptote 3.00-0.
Categories : Examples 2D | Graph.asy
Tags : #Graph | #Axis | #Label
unitsize(x=1cm); import graph; xlimits( -3, 2); ylimits( -3, 3); xaxis(xmin=-3, xmax=2,Ticks("%")); yaxis(ymin=-3, ymax=3, Ticks("%")); labelx(1,2S); labely(1,2W); labelx("$O$",0,SW); dot((0,0)); draw(Label("$x$",position=Relative(1),align=2S),(currentpicture.userMin().x-1,0)--(currentpicture.userMax().x+1,0),Arrow); draw(Label("$y$",position=Relative(1),align=2W),(0,currentpicture.userMin().y-1)--(0,currentpicture.userMax().y+1),Arrow);
graph-fig014
Show graph/fig0150.asy on Github.
Generated with Asymptote 3.00-0.
Categories : Examples 2D | Graph.asy
Tags : #Graph | #Axis | #Label
import graph; unitsize(1cm); xlimits( -3, 2); ylimits( -3, 3); xaxis("$x$",Ticks("%",begin=false, end=false),arrow=Arrow); yaxis("$y$",Ticks("%",begin=false, end=false),arrow=Arrow); labelx(1,2S); labely(1,2W); labelx("$O$",0,SW); dot((0,0));
graph-fig015
Show graph/fig0160.asy on Github.
Generated with Asymptote 3.00-0.
Categories : Examples 2D | Graph.asy
Tags : #Graph | #Axis | #Label
import graph; unitsize(1cm); xlimits( -3, 2); ylimits( -3, 3); xaxis("$x$",Ticks(ticklabel=NoZeroFormat,1bp+red,end=false),arrow=Arrow); yaxis("$y$",Ticks(ticklabel=NoZeroFormat,1bp+red,end=false),arrow=Arrow); labelx(scale(.75)*"$O$",0,SW);
graph-fig016
Show graph/fig0170.asy on Github.
Generated with Asymptote 3.00-0.
Categories : Examples 2D | Graph.asy
Tags : #Graph | #Axis | #Label
import graph; unitsize(1cm); xlimits( -3, 2); ylimits( -3, 3); xaxis("$x$",Ticks(modify=NoZero,1bp+red,end=false),arrow=Arrow); yaxis("$y$",Ticks(modify=NoZero,1bp+red,end=false),arrow=Arrow); labelx(scale(.75)*"$O$",0,SW);
graph-fig017
Show graph/fig0180.asy on Github.
Generated with Asymptote 3.00-0.
Categories : Examples 2D | Graph.asy
Tags : #Graph | #Axis | #Label
import graph; unitsize(1cm); xlimits( -3, 2); ylimits( -3, 3); xaxis("$x$", Ticks(ticklabel=OmitFormat(-2,-1,2), modify=NoZero, 1bp+red, end=false), arrow=Arrow); yaxis("$y$", Ticks(ticklabel=OmitFormat(-2,-1,2,3), modify=NoZero, 1bp+red, end=false), arrow=Arrow); labelx(scale(.75)*"$O$",0,SW);
graph-fig018
Show graph/fig0190.asy on Github.
Generated with Asymptote 3.00-0.
Categories : Examples 2D | Graph.asy
Tags : #Graph | #Axis | #Label | #Grid
import graph; unitsize(x=1cm, y=1.5cm); xlimits( -3, 2); ylimits( -2, 2); xaxis(BottomTop, Ticks("%",extend=true, ptick=lightgrey)); yaxis(LeftRight, Ticks("%",extend=true, ptick=lightgrey)); xequals(Label("$y$",align=2NW),0,ymin=-2.5, ymax=2.5, p=linewidth(1.5pt), Arrow(2mm)); yequals(Label("$x$",align=2SE),0,xmin=-3.5, xmax=2.5, p=linewidth(1.5pt), Arrow(2mm)); labelx(Label("$1$",UnFill), 1); labely(Label("$1$",UnFill), 1); labelx("$O$",0,SW); dot((0,0));
graph-fig019
Show graph/fig0200.asy on Github.
Generated with Asymptote 3.00-0.
Categories : Examples 2D | Graph.asy
Tags : #Graph | #Axis | #Label | #Grid | #Vector
import graph; void graphicrules(picture pic=currentpicture, string prefix=defaultfilename, real unit=1cm, real xunit=unit != 0 ? unit : 0, real yunit=unit != 0 ? unit : 0, real xmin, real xmax, real ymin, real ymax) { xlimits(xmin, xmax); ylimits(ymin, ymax); unitsize(x=xunit, y=yunit); } void grid(picture pic=currentpicture, real xmin=pic.userMin().x, real xmax=pic.userMax().x, real ymin=pic.userMin().y, real ymax=pic.userMax().y, real xStep=1, real xstep=.5, real yStep=1, real ystep=.5, pen pTick=nullpen, pen ptick=grey, bool above=false) { draw(pic,box((xmin,ymin),(xmax,ymax)),invisible); xaxis(pic, BottomTop, xmin, xmax, Ticks("%",extend=true,Step=xStep,step=xstep,pTick=pTick,ptick=ptick), above=above); yaxis(pic, LeftRight, ymin, ymax, Ticks("%",extend=true,Step=yStep,step=ystep,pTick=pTick,ptick=ptick), above=above); } void cartesianaxis(picture pic=currentpicture, Label Lx=Label("$x$",align=S), Label Ly=Label("$y$",align=W), real xmin=pic.userMin().x, real xmax=pic.userMax().x, real ymin=pic.userMin().y, real ymax=pic.userMax().y, real extrawidth=1, real extraheight=extrawidth, pen p=currentpen, ticks xticks=Ticks("%",pTick=nullpen, ptick=grey), ticks yticks=Ticks("%",pTick=nullpen, ptick=grey), bool above=true, arrowbar arrow=Arrow) { extraheight= cm*extraheight/(2*pic.yunitsize); extrawidth = cm*extrawidth/(2*pic.xunitsize); yequals(pic, Lx, 0, xmin-extrawidth, xmax+extrawidth, p, above, arrow=arrow); xequals(pic, Ly, 0, ymin-extraheight, ymax+extraheight, p, above, arrow=arrow); yequals(pic, 0, xmin, xmax, p, xticks, above); xequals(pic, 0, ymin, ymax, p, yticks, above); } void labeloij(picture pic=currentpicture, Label Lo=Label("$O$",NoFill), Label Li=Label("$\vec{\imath}$",NoFill), Label Lj=Label("$\vec{\jmath}$",NoFill), pair diro=SW, pair diri=S, pair dirj=W, pen p=scale(2)*currentpen, filltype filltype=NoFill, arrowbar arrow=Arrow(2mm)) { if (Lo.filltype==NoFill) Lo.filltype=filltype; if (Li.filltype==NoFill) Li.filltype=filltype; if (Lj.filltype==NoFill) Lj.filltype=filltype; labelx(pic, Lo, 0, diro, p); draw(pic, Li, (0,0)--(1,0), diri, p, arrow); draw(pic, Lj, (0,0)--(0,1), dirj, p, arrow); dot(pic, (0,0), dotsize(p)+p); } //The figure starts here graphicrules(yunit=1.5cm, xmin=-3, xmax=3, ymin=-2, ymax=2); grid(); cartesianaxis(arrow=None); labeloij(UnFill);
graph-fig020
Show graph/fig0210.asy on Github.
Generated with Asymptote 3.00-0.
Categories : Examples 2D | Graph.asy
Tags : #Graph | #Grid
import graph; void graphicrules(picture pic=currentpicture, real unit=1cm, real xunit=unit != 0 ? unit : 0, real yunit=unit != 0 ? unit : 0, real xmin, real xmax, real ymin, real ymax) { xlimits(xmin, xmax); ylimits(ymin, ymax); pic.unitsize(x=xunit,y=yunit); } picture millimeterpaper(picture pic=currentpicture, pair O=(0,0), real xmin=infinity, real xmax=infinity, real ymin=infinity, real ymax=infinity, pen p=.5bp+orange) { picture opic; real cofx=pic.xunitsize/cm, cofy=pic.yunitsize/cm; real xmin= (xmin == infinity) ? pic.userMin().x*cofx : xmin*cofx, xmax= (xmax == infinity) ? pic.userMax().x*cofx : xmax*cofx, ymin= (ymin == infinity) ? pic.userMin().y*cofy : ymin*cofy, ymax= (ymax == infinity) ? pic.userMax().y*cofy : ymax*cofy; path ph=(xmin*cm,0)--(xmax*cm,0), pv=(0,ymin*cm)--(0,ymax*cm); real [] step={5, 1, .5, .1}; pen [] p_={ p, scale(.7)*p, scale(.4)*p, scale(.2)*p}; for (int j=0; j<4; ++j) { for (real i=O.y; i<= ymax; i+=step[j]) draw(opic, shift(0,i*cm)*ph, p_[j]); for (real i=O.y; i>=ymin ; i-=step[j]) draw(opic, shift(0,i*cm)*ph, p_[j]); for (real i=O.x; i<=xmax; i+=step[j]) draw(opic, shift(i*cm,0)*pv, p_[j]); for (real i=O.x; i>=xmin; i-=step[j]) draw(opic, shift(i*cm,0)*pv, p_[j]); } return opic; } graphicrules(xunit=2cm, yunit=1.5cm, xmin=-3, xmax=2, ymin=-2, ymax=2); add(millimeterpaper(p=3bp+orange),(0,0)); xaxis(xmin=-3, xmax=2, Ticks("%")); yaxis(ymin=-2, ymax=2, Ticks("%")); xequals(Label("$y$",align=2NW),0,ymin=-2.25, ymax=2.25, p=linewidth(1.5pt), Arrow(2mm)); yequals(Label("$x$",align=2SE),0,xmin=-3.25, xmax=2.25, p=linewidth(1.5pt), Arrow(2mm)); labelx(Label("$1$",UnFill), 1); labely(Label("$1$",UnFill), 1); labelx("$O$",0,SW); dot((0,0));
graph-fig021
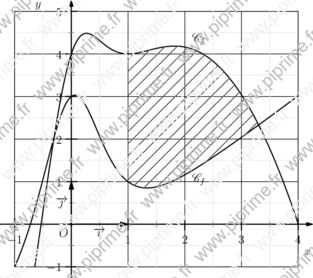
Show graph/fig0220.asy on Github.
Generated with Asymptote 3.00-0.
Categories : Examples 2D | Graph.asy
Tags : #Graph | #Function (drawing) | #Buildcycle | #Pattern | #Tex/latex features | #Grid
import graph; import patterns; usepackage("mathrsfs"); unitsize(2cm,1.5cm); real xmin=-1,xmax=4; real ymin=-1,ymax=5; // Definition of fonctions f and g : real f(real x) {return 4x-x^2+4/(x^2+1)^2;} real g(real x) {return x-1+4/(x^2+1)^2;} // Trace the curves : path Cf=graph(f,xmin,xmax,n=400); path Cg=graph(g,xmin,xmax,n=400); draw(Cf,linewidth(1bp)); draw(Cg,linewidth(1bp)); xlimits(xmin,xmax,Crop); ylimits(ymin,ymax,Crop); // The grid : xaxis(BottomTop, xmin, xmax, Ticks("%", Step=1, step=0.5, extend=true, ptick=lightgrey)); yaxis(LeftRight, ymin, ymax, Ticks("%", Step=1, step=0.5, extend=true, ptick=lightgrey)); // The axis. xequals(Label("$y$",align=W),0,ymin=ymin-0.25, ymax=ymax+0.25, Ticks(NoZero,pTick=nullpen, ptick=grey), p=linewidth(1pt), Arrow(2mm)); yequals(Label("$x$",align=S),0,xmin=xmin-0.25, xmax=xmax+0.25, Ticks(NoZero,pTick=nullpen, ptick=grey), p=linewidth(1pt), Arrow(2mm)); labelx(Label("$O$",NoFill), 0, SW); draw(Label("$\vec{\imath}$",align=S,UnFill), (0,0)--(1,0),scale(2)*currentpen,Arrow); draw(Label("$\vec{\jmath}$",align=W,UnFill), (0,0)--(0,1),scale(2)*currentpen,Arrow); dot((0,0)); label("$\mathscr{C}_f$",(2.25,f(2.25)),2N); label("$\mathscr{C}_f$",(2.25,g(2.25)),2S); // Les hachures. path vline=(1,-1)--(1,5); add("hachure",hatch(3mm)); fill(buildcycle(vline,graph(f,1,4),graph(g,1,4)),pattern("hachure"));
graph-fig022
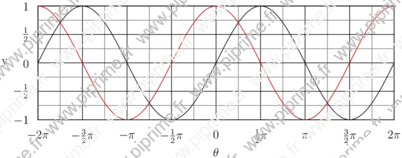
Show graph/fig0230.asy on Github.
Generated with Asymptote 3.00-0.
Categories : Examples 2D | Graph.asy
Tags : #Graph | #Function (drawing) | #Fraction | #Label | #Tex/latex features | #Struct
import graph; unitsize(x=1cm,y=2cm); struct rational { int p; int q; real ep=1/10^5; }; rational operator init() {return new rational;} rational rational(real x, real ep=1/10^5) { rational orat; int q=1; while (abs(round(q*x)-q*x)>ep) { ++q; } orat.p=round(q*x); orat.q=q; orat.ep=ep; return orat; } int pgcd(int a, int b) { int a_=abs(a), b_=abs(b), r=a_; if (b_>a_) {a_=b_; b_=r; r=a_;} while (r>0) { r=a_%b_; a_=b_; b_=r; } return a_; } string texfrac(int p, int q, string factor="", bool signin=false, bool factorin=true, bool displaystyle=false, bool zero=true) { if (p==0) return (zero ? "$0$" : ""); string disp= displaystyle ? "$\displaystyle " : "$"; int pgcd=pgcd(p,q); int num= round(p/pgcd), den= round(q/pgcd); string nums; if (num==1) if (factor=="" || (!factorin && (den !=1))) nums="1"; else nums=""; else if (num==-1) if (factor=="" || (!factorin && (den !=1))) nums="-1"; else nums="-"; else nums= (string) num; if (den==1) return "$" + nums + factor + "$"; else { string dens= (den==1) ? "" : (string) den; if (signin || num>0) if (factorin) return disp + "\frac{" + nums + factor + "}{" + (string) dens + "}$"; else return disp + "\frac{" + nums + "}{" + (string) dens + "}"+ factor + "$"; else { if (num==-1) if (factor=="" || !factorin) nums="1"; else nums=""; else nums=(string)(abs(num)); if (factorin) return disp + "-\frac{" + nums + factor + "}{" + (string) dens + "}$"; else return disp + "-\frac{" + nums + "}{" + (string) dens + "}"+ factor + "$"; } } } string texfrac(rational x, string factor="", bool signin=false, bool factorin=true, bool displaystyle=false, bool zero=true) { return texfrac(x.p, x.q, factor, signin, factorin, displaystyle, zero); } ticklabel labelfrac(real ep=1/10^5, real factor=1.0, string symbol="", bool signin=false, bool symbolin=true, bool displaystyle=false, bool zero=true) { return new string(real x) { return texfrac(rational(x/factor), symbol, signin, symbolin, displaystyle, zero); }; } ticklabel labelfrac=labelfrac(); xlimits( -2pi, 2pi); ylimits( -1, 1); yaxis("y",LeftRight , Ticks(labelfrac,Step=.5,step=.25, ptick=grey, extend=true)); xaxis("$\theta$",BottomTop, Ticks(labelfrac(factor=pi,symbol="\pi",symbolin=false), Step=pi/2, step=pi/4, ptick=grey, extend=true)); draw(graph(new real(real x){return sin(x);},-2pi,2pi)); draw(graph(new real(real x){return cos(x);},-2pi,2pi), .8red);
graph-fig023
Show graph/fig0240.asy on Github.
Generated with Asymptote 3.00-0.
Categories : Examples 2D | Graph.asy
Tags : #Graph | #Function (drawing) | #Fraction | #Label | #Tex/latex features | #Struct
import graph; // public real xunit=1cm,yunit=1cm; void graphicrules(picture pic=currentpicture, string prefix=defaultfilename, real unit=1cm, real xunit=unit != 0 ? unit : 0, real yunit=unit != 0 ? unit : 0, real xmin, real xmax, real ymin, real ymax) { xlimits(xmin, xmax); ylimits(ymin, ymax); unitsize(x=xunit, y=yunit); } struct rational { int p; int q; real ep=1/10^5; }; rational operator init() {return new rational;} rational rational(real x, real ep=1/10^5) { rational orat; int q=1; while (abs(round(q*x)-q*x)>ep) { ++q; } orat.p=round(q*x); orat.q=q; orat.ep=ep; return orat; } int pgcd(int a, int b) { int a_=abs(a), b_=abs(b), r=a_; if (b_>a_) {a_=b_; b_=r; r=a_;} while (r>0) { r=a_%b_; a_=b_; b_=r; } return a_; } string texfrac(int p, int q, string factor="", bool signin=false, bool factorin=true, bool displaystyle=false, bool zero=true) { if (p==0) return (zero ? "$0$" : ""); string disp= displaystyle ? "$\displaystyle " : "$"; int pgcd=pgcd(p,q); int num= round(p/pgcd), den= round(q/pgcd); string nums; if (num==1) if (factor=="" || (!factorin && (den !=1))) nums="1"; else nums=""; else if (num==-1) if (factor=="" || (!factorin && (den !=1))) nums="-1"; else nums="-"; else nums= (string) num; if (den==1) return "$" + nums + factor + "$"; else { string dens= (den==1) ? "" : (string) den; if (signin || num>0) if (factorin) return disp + "\frac{" + nums + factor + "}{" + (string) dens + "}$"; else return disp + "\frac{" + nums + "}{" + (string) dens + "}"+ factor + "$"; else { if (num==-1) if (factor=="" || !factorin) nums="1"; else nums=""; else nums=(string)(abs(num)); if (factorin) return disp + "-\frac{" + nums + factor + "}{" + (string) dens + "}$"; else return disp + "-\frac{" + nums + "}{" + (string) dens + "}"+ factor + "$"; } } } string texfrac(rational x, string factor="", bool signin=false, bool factorin=true, bool displaystyle=false, bool zero=true) { return texfrac(x.p, x.q, factor, signin, factorin, displaystyle, zero); } ticklabel labelfrac(real ep=1/10^5, real factor=1.0, string symbol="", bool signin=false, bool symbolin=true, bool displaystyle=false, bool zero=true) { return new string(real x) { return texfrac(rational(x/factor), symbol, signin, symbolin, displaystyle, zero); }; } ticklabel labelfrac=labelfrac(); void grid(picture pic=currentpicture, real xmin=pic.userMin().x, real xmax=pic.userMax().x, real ymin=pic.userMin().y, real ymax=pic.userMax().y, real xStep=1, real xstep=.5, real yStep=1, real ystep=.5, pen pTick=nullpen, pen ptick=grey, bool above=true) { xaxis(pic, BottomTop, xmin, xmax, Ticks("%",extend=true,Step=xStep,step=xstep,pTick=pTick,ptick=ptick), above=above); yaxis(pic, LeftRight, ymin, ymax, Ticks("%",extend=true,Step=yStep,step=ystep,pTick=pTick,ptick=ptick), above=above); } void cartesianaxis(picture pic=currentpicture, Label Lx=Label("$x$",align=S), Label Ly=Label("$y$",align=W), real xmin=pic.userMin().x, real xmax=pic.userMax().x, real ymin=pic.userMin().y, real ymax=pic.userMax().y, real extrawidth=1, real extraheight=extrawidth, pen p=currentpen, ticks xticks=Ticks("%",pTick=nullpen, ptick=grey), ticks yticks=Ticks("%",pTick=nullpen, ptick=grey), bool above=true, arrowbar arrow=Arrow) { extraheight= cm*extraheight/(2*pic.yunitsize); extrawidth = cm*extrawidth/(2*pic.xunitsize); yequals(pic, Lx, 0, xmin-extrawidth, xmax+extrawidth, p, above, arrow=arrow); yequals(pic, 0, xmin, xmax, p, xticks, above); xequals(pic, Ly, 0, ymin-extraheight, ymax+extraheight, p, above, arrow=arrow); xequals(pic, 0, ymin, ymax, p, yticks, above); } void labeloij(picture pic=currentpicture, Label Lo=Label("$O$",NoFill), Label Li=Label("$\vec{\imath}$",NoFill), Label Lj=Label("$\vec{\jmath}$",NoFill), pair diro=SW, pair diri=S, pair dirj=W, pen p=scale(2)*currentpen, filltype filltype=NoFill, arrowbar arrow=Arrow(2mm)) { if (Lo.filltype==NoFill) Lo.filltype=filltype; if (Li.filltype==NoFill) Li.filltype=filltype; if (Lj.filltype==NoFill) Lj.filltype=filltype; labelx(pic, Lo, 0, diro, p); draw(pic, Li, (0,0)--(1,0), diri, p, arrow); draw(pic, Lj, (0,0)--(0,1), dirj, p, arrow); dot(pic, (0,0), dotsize(p)+p); } void labeloIJ(picture pic=currentpicture, Label Lo=Label("$O$",NoFill), Label LI=Label("$I$",NoFill), Label LJ=Label("$J$",NoFill), pair diro=SW, pair dirI=S, pair dirJ=W, pen p=currentpen, filltype filltype=NoFill, arrowbar arrow=Arrow) { if (Lo.filltype==NoFill) Lo.filltype=filltype; if (LI.filltype==NoFill) LI.filltype=filltype; if (LJ.filltype==NoFill) LJ.filltype=filltype; labelx(pic, LI, 1, dirI, p); labely(pic, LJ, 1, dirJ, p); labelx(pic, Lo, 0, diro, p); dot(pic, (0,0), dotsize(p)+p); } graphicrules(xunit=1cm, yunit=3cm, xmin=-2pi, xmax=2pi, ymin=-1, ymax=1); grid(xStep=pi/2, xstep=pi/4, yStep=.5, ystep=.25); cartesianaxis(xticks=Ticks(Label(UnFill),labelfrac(factor=pi,symbol="\pi",symbolin=true, zero=false),Step=pi/2, step=pi/4, ptick=grey), yticks=Ticks(Label(UnFill),labelfrac(zero=false),Step=.5,step=.25, ptick=grey), arrow=None); dot("$O$",(0,0),2SW);
graph-fig024
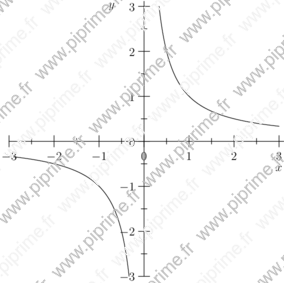
Show graph/fig0250.asy on Github.
Generated with Asymptote 3.00-0.
Categories : Examples 2D | Graph.asy
Tags : #Graph | #Function (drawing) | #Hyperbola | #Contour | #Function (implicit)
size(10cm,0); import contour; import graph; xlimits( -3, 3); ylimits( -3, 3); yaxis( "$y$" , Ticks()); xaxis( "$x$", Ticks()); real f(real x, real y) {return x*y;} draw(contour(f,(-3,-3),(3,3),new real[] {1}));
graph-fig025
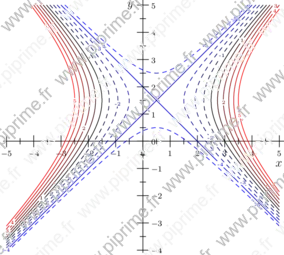
Show graph/fig0260.asy on Github.
Generated with Asymptote 3.00-0.
Categories : Examples 2D | Graph.asy
Tags : #Graph | #Function (drawing) | #Hyperbola | #Contour | #Function (implicit) | #Array
size(10cm,0); import contour; import stats; import graph; xlimits( -5, 5); ylimits( -4, 5); yaxis( "$y$" , Ticks(Label(currentpen+fontsize(8),align=E))); xaxis( "$x$", Ticks(Label(currentpen+fontsize(8)))); real f(real x, real y) {return x^2-x-y^2+3y-6;} int min=-5, max=5, n=max-min+1; real[] value=sequence(min,max); pen[] p=sequence(new pen(int i) { return (value[i] >= 0 ? solid : dashed) + (value[i] >= 0 ? (value[i]/max)*red : (value[i]/min)*blue) + fontsize(4); },n); Label[] Labels=sequence(new Label(int i) { return Label(value[i] != 0 ? (string) value[i] : "",Relative(unitrand()),(0,0), UnFill(1bp)); },n); draw(Labels,contour(f,(-5,-5),(5,5),value),p);
graph-fig026
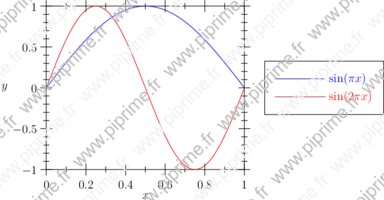
Show graph/fig0270.asy on Github.
Generated with Asymptote 3.00-0.
Categories : Examples 2D | Graph.asy
Tags : #Graph | #Function (drawing) | #Legend
//Author: John Bowman import graph; size(250,200,IgnoreAspect); real Sin(real t, real w) {return sin(w*t);} draw(graph(new real(real t) {return Sin(t,pi);},0,1),blue,"$\sin(\pi x)$"); draw(graph(new real(real t) {return Sin(t,2pi);},0,1),red,"$\sin(2\pi x)$"); xaxis("$x$",BottomTop,Ticks); yaxis("$y$",LeftRight,Ticks); attach(legend(),point(E),20E,UnFill);
graph-fig027
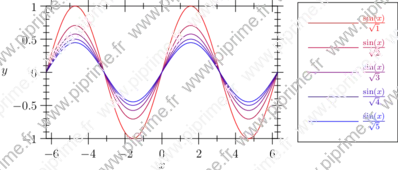
Show graph/fig0280.asy on Github.
Generated with Asymptote 3.00-0.
Categories : Examples 2D | Graph.asy
Tags : #Graph | #Function (drawing) | #Legend | #Typedef | #Tex/latex features
import graph; size(10cm,6cm,IgnoreAspect); typedef real realfcn(real); realfcn F(real p){ return new real(real x){return sin(x)/sqrt(p);}; }; real pmax=5; for (real p=1; p<=pmax; p+=1) { draw(graph(F(p),-2pi,2pi), ((p-1)/(pmax-1)*blue+(1-(p-1)/(pmax-1))*red), "$\frac{\sin(x)}{\sqrt{" + (string) p +"}}$"); } xlimits(-2pi,2pi); ylimits(-1,1); xaxis("$x$",BottomTop,Ticks); yaxis("$y$",LeftRight,Ticks); attach(legend(),point(E),20E,UnFill);
graph-fig028
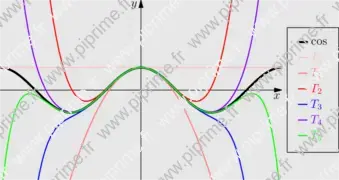
Show graph/fig0290.asy on Github.
Generated with Asymptote 3.00-0.
Categories : Examples 2D | Graph.asy
Tags : #Graph | #Interpolate | #Function (drawing) | #Legend | #Typedef
import graph; size(10cm); xaxis("$x$", -2*pi,2*pi, Arrow); yaxis("$y$", -4,4, Arrow); typedef real realfcn(real); // Define new type: real function of real realfcn TPC(int n) { //Return Taylor polynomial (degrees 2*n) of cos return new real(real x) { return sum(sequence(new real(int m){return (-1)^m*x^(2*m)/gamma(2*m+1);}, n+1)); }; } draw(graph(cos,-2pi,2pi), linewidth(2bp), legend="$\cos$"); int n=6; // Number of curves pen[] p={palered, lightred, red, blue, purple, green}; p.cyclic=true; // p[6]=p[0], p[7]=p[1], etc... for (int i=0; i < n; ++i) { draw(graph(TPC(i),-2*pi,2*pi), bp+p[i], legend="$T_{"+(string)i+"}$"); } xlimits(-2*pi,2*pi, Crop); ylimits(-4,4, Crop); attach(legend(linelength=3mm),point(E),5E); shipout(bbox(Fill(lightgrey)));
graph-fig029
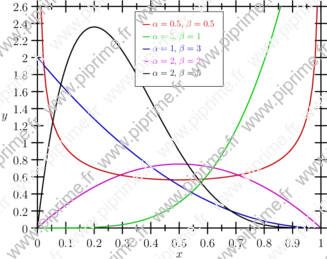
Beta distribution.
Show graph/fig0300.asy on Github.
Generated with Asymptote 3.00-0.
Categories : Examples 2D | Graph.asy
Tags : #Graph | #Function (drawing) | #Legend | #Typedef
import graph; unitsize(10cm,3cm); typedef real realfcn(real); realfcn betaFunction(real alpha, real beta){ return new real(real x){ return gamma(alpha+beta)/(gamma(alpha)+gamma(beta))*x^(alpha-1)*(1-x)^(beta-1); }; }; real[][] ab=new real[][] {{0.5,0.5},{5,1},{1,3},{2,2},{2,5}}; pen[] p=new pen[] {0.8*red, 0.8*green, 0.8*blue, 0.8*magenta, black}; for (int i=0; i < 5; ++i) { draw(graph(betaFunction(ab[i][0],ab[i][1]),1e-5,1-1e-5), bp+p[i], legend="$\alpha="+(string)ab[i][0]+",\;\beta="+(string)ab[i][1]+"$"); } xlimits(0,1,Crop); ylimits(0,2.6,Crop); xaxis("$x$",BottomTop,linewidth(bp),Ticks); yaxis("$y$",LeftRight,linewidth(bp),Ticks(Step=0.2)); attach(scale(0.75)*legend(linelength=3mm),point(N),5S,UnFill);
graph-fig030
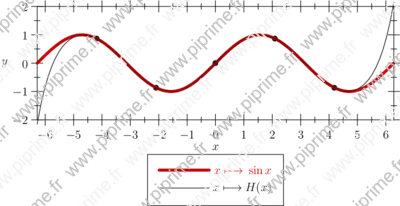
Other examples of interpolations can be found here.
Show graph/fig0310.asy on Github.
Generated with Asymptote 3.00-0.
Categories : Examples 2D | Graph.asy
Tags : #Graph | #Interpolate | #Function (drawing) | #Legend | #Typedef
import graph; unitsize(1cm); typedef real hermite(real); /** * Retourne la fonction polynôme de Hermite * passant par les points m(x_i,y_i) de nombre dérivée d_i en ce point. * Return Hermite polynomial interpolation function * passing by the points m (x_i, y_i) of derived number d_i in this point. **/ hermite hermite(pair [] m, real [] d) { return new real(real x){ int n=m.length; if (n != d.length) abort("Hermite: nombres de paramètres incorrectes."); real q,qk,s,y=0; for (int k=0; k<n ; ++k) { real q=1, qk=1, s=0; for (int j=0; j<n; ++j) { if (j!=k){ q=q*(x-m[j].x)^2; qk=qk*(m[k].x-m[j].x)^2; s=s+1/(m[k].x-m[j].x); } } y=y+q/qk*(m[k].y+(x-m[k].x)*(d[k]-2*s*m[k].y)); } return y; }; } pair[] m; real[] d; int nbpt=5; real xmin=-2pi, xmax=2pi, l=xmax-xmin, step=l/(nbpt+1); for (int i=1; i<=nbpt; ++i) { real x=xmin+i*step; m.push((x,sin(x))); draw(m[m.length-1],linewidth(2mm)); d.push(cos(x)); } xlimits(-2pi,2pi); ylimits(-2,2); xaxis("$x$",BottomTop,Ticks); yaxis("$y$",LeftRight,Ticks); draw(graph(sin,xmin,xmax),1mm+.8red,"$x\longmapsto{}\sin x$"); draw(graph(hermite(m,d),xmin,xmax),"$x\longmapsto{}H(x)$"); attach(legend(),point(10S),30S);
graph-fig031
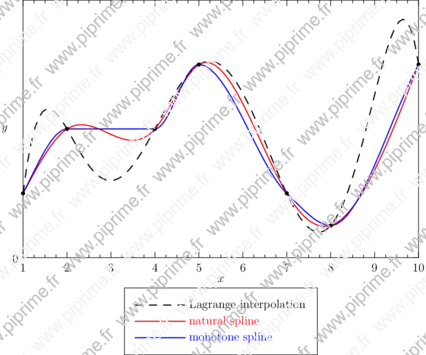
Show graph/fig0320.asy on Github.
Generated with Asymptote 3.00-0.
Categories : Examples 2D | Graph.asy
Tags : #Graph | #Interpolate | #Function (drawing) | #Legend
import graph; import interpolate; size(15cm,10cm,IgnoreAspect); real[] xpt,ypt; real [] xpt={1, 2, 4, 5, 7, 8, 10}; real [] ypt={1, 2, 2, 3, 1, 0.5, 3}; horner h=diffdiv(xpt,ypt); fhorner L=fhorner(h); scale(false,true); pen p=linewidth(1); draw(graph(L,min(xpt),max(xpt)),dashed+black+p,"Lagrange interpolation"); draw(graph(xpt,ypt,Hermite(natural)),red+p,"natural spline"); draw(graph(xpt,ypt,Hermite(monotonic)),blue+p,"monotone spline"); xaxis("$x$",BottomTop,LeftTicks(Step=1,step=0.25)); yaxis("$y$",LeftRight,RightTicks(Step=5)); dot(pairs(xpt,ypt),4bp+0.7black); attach(legend(),point(10S),30S);
graph-fig032
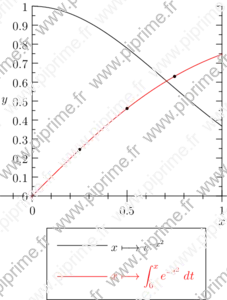
Show graph/fig0330.asy on Github.
Generated with Asymptote 3.00-0.
Categories : Examples 2D | Graph.asy
Tags : #Graph | #Function (drawing) | #Legend | #Tex/latex features | #Slopefield
import slopefield; import graph; size(8cm,0); real f(real t) {return exp(-t^2);} defaultpen(); xlimits( 0,1); ylimits( 0,1); yaxis( "$y$" ,LeftRight, RightTicks); xaxis( "$x$", Ticks()); draw(graph(f,0,1),"$x\longmapsto{}e^{-x^2}$"); draw(curve((0,0),f,(0,0),(1,10)),linecap(0)+red,"$\displaystyle x\longmapsto\int_{0}^{x}e^{-t^2}\;dt$"); //Test with three values calculated with Maxima: dot((.25,0.13816319508411845*sqrt(pi))^^(.5 , 0.26024993890652326*sqrt(pi))); dot((.75, 0.3555778168267576*sqrt(pi))); attach(legend(),point(10S),30S);
graph-fig033
![]()
Show graph/fig0340.asy on Github.
Generated with Asymptote 3.00-0.
Categories : Examples 2D | Graph.asy
Tags : #Graph | #Font | #Axis
//Author: John Bowman import graph; size(2cm, 0); xlimits(0, 100); ylimits(-50, 50); yaxis( "y-value" ,Left, Courier("m", "n") + fontsize(12), RightTicks("%.4g"));
graph-fig034
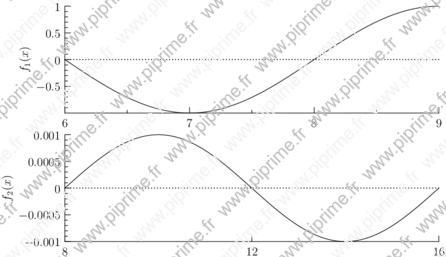
Show graph/fig0350.asy on Github.
Generated with Asymptote 3.00-0.
Categories : Examples 2D | Graph.asy
Tags : #Graph | #Function (drawing) | #Align | #Picture | #Transform/scale/shift/rotate/projection
// From Asymptote's FAQ import graph; real width=15cm; real aspect=0.3; picture pic1,pic2; size(pic1,width,aspect*width,IgnoreAspect); size(pic2,width,aspect*width,IgnoreAspect); scale(pic1,false); scale(pic2,false); real xmin1=6; real xmax1=9; real xmin2=8; real xmax2=16; real a1=1; real a2=0.001; real f1(real x) {return a1*sin(x/2*pi);} real f2(real x) {return a2*sin(x/4*pi);} draw(pic1,graph(pic1,f1,xmin1,xmax1)); draw(pic2,graph(pic2,f2,xmin2,xmax2)); xaxis(pic1,Bottom,LeftTicks()); yaxis(pic1,"$f_1(x)$",Left,RightTicks); xaxis(pic2,Bottom,LeftTicks(Step=4)); yaxis(pic2,"$f_2(x)$",Left,RightTicks); yequals(pic1,0,Dotted); yequals(pic2,0,Dotted); pair min1=point(pic1,SW); pair max1=point(pic1,NE); pair min2=point(pic2,SW); pair max2=point(pic2,NE); real scale=(max1.x-min1.x)/(max2.x-min2.x); real shift=min1.x/scale-min2.x; transform t1 = pic1.calculateTransform(); transform t2 = pic2.calculateTransform(); transform T=xscale(scale*t1.xx)*yscale(t2.yy); add(pic1.fit()); real height=truepoint(N).y-truepoint(S).y; add(shift(0,-height)*(shift(shift)*pic2).fit(T));
opacity-fig001

Show opacity/fig0010.asy on Github.
Generated with Asymptote 3.00-0.
Categories : Examples 2D | Opacity
Tags : #Opacity
import edvenn_pi; string blend="Compatible"; //This is the default value size(10cm,0); path [] edvenn= EdVenn(4); pen [] fillp= new pen[]{black, red, green, blue}; pen p=linewidth(1mm); for (int i=0; i<4; ++i) { fillp[i]=fillp[i]+opacity(.5,blend=blend); filldraw(edvenn[i], fillpen=fillp[i], drawpen=linewidth((i+1)*mm/2)); } shipout(bbox(2mm,invisible),"pdf");
opacity-fig002

Show opacity/fig0020.asy on Github.
Generated with Asymptote 3.00-0.
Categories : Examples 2D | Opacity
Tags : #Opacity
import edvenn_pi; // Normal: Selects the source color, ignoring the backdrop. string blend="Normal"; size(10cm,0); path [] edvenn= EdVenn(4); pen [] fillp= new pen[]{black, red, green, blue}; pen p=linewidth(1mm); for (int i=0; i<4; ++i) { fillp[i]=fillp[i]+opacity(.5,blend=blend); filldraw(edvenn[i], fillpen=fillp[i], drawpen=linewidth((i+1)*mm/2)); } shipout(bbox(2mm,invisible),"pdf");
opacity-fig003
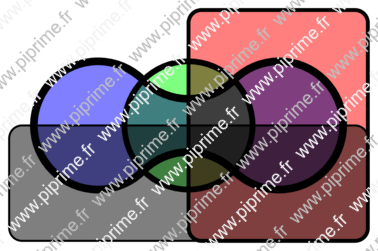
Show opacity/fig0030.asy on Github.
Generated with Asymptote 3.00-0.
Categories : Examples 2D | Opacity
Tags : #Opacity
import edvenn_pi; // Multiply: Multiplies the backdrop and source color values: // The result color is always at least as dark as either of the two constituent // colors. Multiplying any color with black produces black; // multiplying with white leaves the original color unchanged. Painting // successive overlapping objects with a color other than black or // white produces progressively darker colors. string blend="Multiply"; size(10cm,0); path [] edvenn= EdVenn(4); pen [] fillp= new pen[]{black, red, green, blue}; pen p=linewidth(1mm); for (int i=0; i<4; ++i) { fillp[i]=fillp[i]+opacity(.5,blend=blend); filldraw(edvenn[i], fillpen=fillp[i], drawpen=linewidth((i+1)*mm/2)); } shipout(bbox(2mm,invisible),"pdf");
opacity-fig004

Show opacity/fig0040.asy on Github.
Generated with Asymptote 3.00-0.
Categories : Examples 2D | Opacity
Tags : #Opacity
// The result does not support image conversion. // You can view it in the file /home/pi/code/pi/asymptote/asymptote-exemples-builder/build/asy/opacity/fig0040.pdf. import edvenn_pi; // Screen: Multiplies the complements of the backdrop and source color // values, then complements the result: // The result color is always at least as light as either of the two constituent // colors. Screening any color with white produces white; screening // with black leaves the original color unchanged. The effect is // similar to projecting multiple photographic slides simultaneously // onto a single screen. string blend="Screen"; size(10cm,0); path [] edvenn= EdVenn(4); pen [] fillp= new pen[]{black, red, green, blue}; pen p=linewidth(1mm); for (int i=0; i<4; ++i) { fillp[i]=fillp[i]+opacity(.5,blend=blend); filldraw(edvenn[i], fillpen=fillp[i], drawpen=linewidth((i+1)*mm/2)); } shipout(bbox(2mm,invisible),"pdf");
opacity-fig005

Show opacity/fig0050.asy on Github.
Generated with Asymptote 3.00-0.
Categories : Examples 2D | Opacity
Tags : #Opacity
import edvenn_pi; // Overlay: Multiplies or screens the colors, depending on the backdrop color. // Source colors overlay the backdrop while preserving its highlights // and shadows. The backdrop color is not replaced but is mixed with // the source color to reflect the lightness or darkness of the backdrop. string blend="Overlay"; size(10cm,0); path [] edvenn= EdVenn(4); pen [] fillp= new pen[]{black, red, green, blue}; pen p=linewidth(1mm); for (int i=0; i<4; ++i) { fillp[i]=fillp[i]+opacity(.5,blend=blend); filldraw(edvenn[i], fillpen=fillp[i], drawpen=linewidth((i+1)*mm/2)); } shipout(bbox(2mm,invisible),"pdf");
opacity-fig006

Show opacity/fig0060.asy on Github.
Generated with Asymptote 3.00-0.
Categories : Examples 2D | Opacity
Tags : #Opacity
import edvenn_pi; // Darken: Selects the darker of the backdrop and source colors: // The backdrop is replaced with the source where the source is darker; // otherwise, it is left unchanged. string blend="Darken"; size(10cm,0); path [] edvenn= EdVenn(4); pen [] fillp= new pen[]{black, red, green, blue}; pen p=linewidth(1mm); for (int i=0; i<4; ++i) { fillp[i]=fillp[i]+opacity(.5,blend=blend); filldraw(edvenn[i], fillpen=fillp[i], drawpen=linewidth((i+1)*mm/2)); } shipout(bbox(2mm,invisible),"pdf");
opacity-fig007
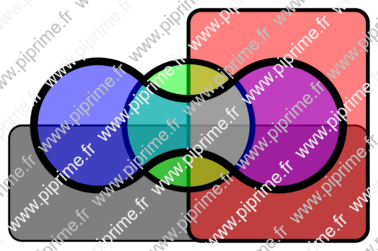
Show opacity/fig0070.asy on Github.
Generated with Asymptote 3.00-0.
Categories : Examples 2D | Opacity
Tags : #Opacity
import edvenn_pi; // Lighten: Selects the lighter of the backdrop and source colors: // The backdrop is replaced with the source where the source is lighter; // otherwise, it is left unchanged. string blend="Lighten"; size(10cm,0); path [] edvenn= EdVenn(4); pen [] fillp= new pen[]{black, red, green, blue}; pen p=linewidth(1mm); for (int i=0; i<4; ++i) { fillp[i]=fillp[i]+opacity(.5,blend=blend); filldraw(edvenn[i], fillpen=fillp[i], drawpen=linewidth((i+1)*mm/2)); } shipout(bbox(2mm,invisible),"pdf");
opacity-fig008

Show opacity/fig0080.asy on Github.
Generated with Asymptote 3.00-0.
Categories : Examples 2D | Opacity
Tags : #Opacity
import edvenn_pi; // ColorDodge: Brightens the backdrop color to reflect the source color. Painting // with black produces no change. string blend="ColorDodge"; size(10cm,0); path [] edvenn= EdVenn(4); pen [] fillp= new pen[]{black, red, green, blue}; pen p=linewidth(1mm); for (int i=0; i<4; ++i) { fillp[i]=fillp[i]+opacity(.5,blend=blend); filldraw(edvenn[i], fillpen=fillp[i], drawpen=linewidth((i+1)*mm/2)); } shipout(bbox(2mm,invisible),"pdf");
opacity-fig009
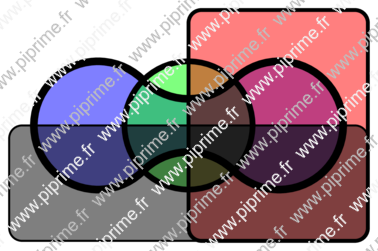
Show opacity/fig0090.asy on Github.
Generated with Asymptote 3.00-0.
Categories : Examples 2D | Opacity
Tags : #Opacity
import edvenn_pi; // ColorBurn Darkens the backdrop color to reflect the source color. Painting // with white produces no change. string blend="ColorBurn"; size(10cm,0); path [] edvenn= EdVenn(4); pen [] fillp= new pen[]{black, red, green, blue}; pen p=linewidth(1mm); for (int i=0; i<4; ++i) { fillp[i]=fillp[i]+opacity(.5,blend=blend); filldraw(edvenn[i], fillpen=fillp[i], drawpen=linewidth((i+1)*mm/2)); } shipout(bbox(2mm,invisible),"pdf");
opacity-fig010

Show opacity/fig0100.asy on Github.
Generated with Asymptote 3.00-0.
Categories : Examples 2D | Opacity
Tags : #Opacity
import edvenn_pi; // HardLight: Multiplies or screens the colors, depending on the source color // value. If the source color is lighter than 0.5, the backdrop is lightened // as if it were screened; this is useful for adding highlights to a // scene. If the source color is darker than 0.5, the backdrop is darkened // as if it were multiplied; this is useful for adding shadows to a // scene. The degree of lightening or darkening is proportional to the // difference between the source color and 0.5; if it is equal to 0.5, the // backdrop is unchanged. Painting with pure black or white produces // pure black or white. The effect is similar to shining a harsh spotlight // on the backdrop. string blend="HardLight"; size(10cm,0); path [] edvenn= EdVenn(4); pen [] fillp= new pen[]{black, red, green, blue}; pen p=linewidth(1mm); for (int i=0; i<4; ++i) { fillp[i]=fillp[i]+opacity(.5,blend=blend); filldraw(edvenn[i], fillpen=fillp[i], drawpen=linewidth((i+1)*mm/2)); } shipout(bbox(2mm,invisible),"pdf");
opacity-fig011
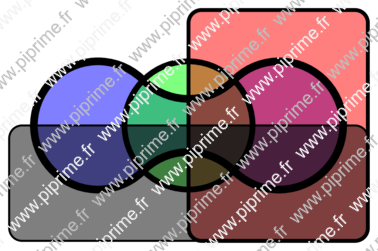
Show opacity/fig0110.asy on Github.
Generated with Asymptote 3.00-0.
Categories : Examples 2D | Opacity
Tags : #Opacity
import edvenn_pi; // SoftLight: Darkens or lightens the colors, depending on the source color value. // If the source color is lighter than 0.5, the backdrop is lightened as if // it were dodged; this is useful for adding highlights to a scene. If the // source color is darker than 0.5, the backdrop is darkened as if it // were burned in. The degree of lightening or darkening is proportional // to the difference between the source color and 0.5; if it is // equal to 0.5, the backdrop is unchanged. Painting with pure black or // white produces a distinctly darker or lighter area but does not result // in pure black or white. The effect is similar to shining a diffused // spotlight on the backdrop. string blend="SoftLight"; size(10cm,0); path [] edvenn= EdVenn(4); pen [] fillp= new pen[]{black, red, green, blue}; pen p=linewidth(1mm); for (int i=0; i<4; ++i) { fillp[i]=fillp[i]+opacity(.5,blend=blend); filldraw(edvenn[i], fillpen=fillp[i], drawpen=linewidth((i+1)*mm/2)); } shipout(bbox(2mm,invisible),"pdf");
opacity-fig012

Show opacity/fig0120.asy on Github.
Generated with Asymptote 3.00-0.
Categories : Examples 2D | Opacity
Tags : #Opacity
import edvenn_pi; // Difference: Subtracts the darker of the two constituent colors from the lighter // color: // Painting with white inverts the backdrop color; painting with black // produces no change. string blend="Difference"; size(10cm,0); path [] edvenn= EdVenn(4); pen [] fillp= new pen[]{black, red, green, blue}; pen p=linewidth(1mm); for (int i=0; i<4; ++i) { fillp[i]=fillp[i]+opacity(.5,blend=blend); filldraw(edvenn[i], fillpen=fillp[i], drawpen=linewidth((i+1)*mm/2)); } shipout(bbox(2mm,invisible),"pdf");
opacity-fig013

Show opacity/fig0130.asy on Github.
Generated with Asymptote 3.00-0.
Categories : Examples 2D | Opacity
Tags : #Opacity
import edvenn_pi; // Exclusion: Produces an effect similar to that of the Difference mode but lower // in contrast. Painting with white inverts the backdrop color; painting // with black produces no change. string blend="Exclusion"; size(10cm,0); path [] edvenn= EdVenn(4); pen [] fillp= new pen[]{black, red, green, blue}; pen p=linewidth(1mm); for (int i=0; i<4; ++i) { fillp[i]=fillp[i]+opacity(.5,blend=blend); filldraw(edvenn[i], fillpen=fillp[i], drawpen=linewidth((i+1)*mm/2)); } shipout(bbox(2mm,invisible),"pdf");
opacity-fig014
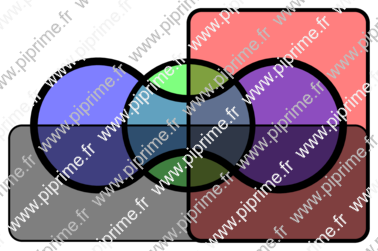
Show opacity/fig0140.asy on Github.
Generated with Asymptote 3.00-0.
Categories : Examples 2D | Opacity
Tags : #Opacity
import edvenn_pi; // Hue: Creates a color with the hue of the source color and the saturation // and luminance of the backdrop color. string blend="Hue"; size(10cm,0); path [] edvenn= EdVenn(4); pen [] fillp= new pen[]{black, red, green, blue}; pen p=linewidth(1mm); for (int i=0; i<4; ++i) { fillp[i]=fillp[i]+opacity(.5,blend=blend); filldraw(edvenn[i], fillpen=fillp[i], drawpen=linewidth((i+1)*mm/2)); } shipout(bbox(2mm,invisible),"pdf");
opacity-fig015
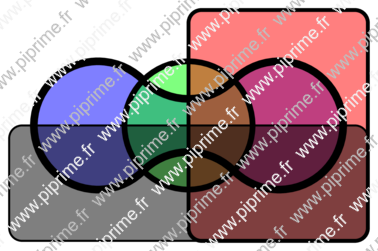
Show opacity/fig0150.asy on Github.
Generated with Asymptote 3.00-0.
Categories : Examples 2D | Opacity
Tags : #Opacity
import edvenn_pi; // Saturation: Creates a color with the saturation of the source color and the hue // and luminance of the backdrop color. Painting with this mode in an // area of the backdrop that is a pure gray (no saturation) produces no // change. string blend="Saturation"; size(10cm,0); path [] edvenn= EdVenn(4); pen [] fillp= new pen[]{black, red, green, blue}; pen p=linewidth(1mm); for (int i=0; i<4; ++i) { fillp[i]=fillp[i]+opacity(.5,blend=blend); filldraw(edvenn[i], fillpen=fillp[i], drawpen=linewidth((i+1)*mm/2)); } shipout(bbox(2mm,invisible),"pdf");
opacity-fig016
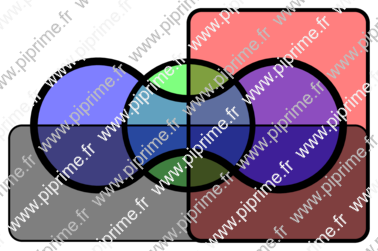
Show opacity/fig0160.asy on Github.
Generated with Asymptote 3.00-0.
Categories : Examples 2D | Opacity
Tags : #Opacity
import edvenn_pi; // Color: Creates a color with the hue and saturation of the source color and // the luminance of the backdrop color. This preserves the gray levels // of the backdrop and is useful for coloring monochrome images or // tinting color images. string blend="Color"; size(10cm,0); path [] edvenn= EdVenn(4); pen [] fillp= new pen[]{black, red, green, blue}; pen p=linewidth(1mm); for (int i=0; i<4; ++i) { fillp[i]=fillp[i]+opacity(.5,blend=blend); filldraw(edvenn[i], fillpen=fillp[i], drawpen=linewidth((i+1)*mm/2)); } shipout(bbox(2mm,invisible),"pdf");
opacity-fig017
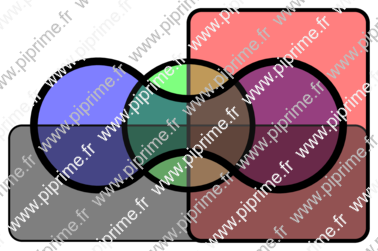
Show opacity/fig0170.asy on Github.
Generated with Asymptote 3.00-0.
Categories : Examples 2D | Opacity
Tags : #Opacity
import edvenn_pi; // Luminosity: Creates a color with the luminance of the source color and the hue // and saturation of the backdrop color. This produces an inverse // effect to that of the Color mode. string blend="Luminosity"; size(10cm,0); path [] edvenn= EdVenn(4); pen [] fillp= new pen[]{black, red, green, blue}; pen p=linewidth(1mm); for (int i=0; i<4; ++i) { fillp[i]=fillp[i]+opacity(.5,blend=blend); filldraw(edvenn[i], fillpen=fillp[i], drawpen=linewidth((i+1)*mm/2)); } shipout(bbox(2mm,invisible),"pdf");
opacity-fig018

Show opacity/fig0180.asy on Github.
Generated with Asymptote 3.00-0.
Categories : Examples 2D | Opacity
Tags : #Opacity | #Layer | #Label | #Fill/Unfill | #Shipout | #Bbox | #Shading
size(4cm,0); dotfactor*=5; dot(scale(2)*"A",(0.5,1),5N); layer(); dot(scale(2)*"B",(1.5,1),5N); filldraw(scale(2)*unitsquare, lightgray+opacity(.5)); shipout(bbox(5mm,black,RadialShade(lightblue,darkblue)), "pdf");
opacity-fig019

Show opacity/fig0190.asy on Github.
Generated with Asymptote 3.00-0.
Categories : Examples 2D | Opacity
Tags : #Opacity | #Fill/Unfill | #Shading
size(10cm,0); transform T=rotate(10)*xscale(1.1); path c1=T*unitcircle, c2=T*scale(5)*unitcircle; real l1=length(c1), l2=length(c2); fill(scale(8)*shift(-0.5,-0.5)*unitsquare,blue); int n=500; real step=1/n; for (int i=0; i < n; ++i) { real t=i*step; path g1=subpath(c1,t*l1,(t+step)*l1); path g2=subpath(c2,t*l2,(t+step)*l2); pair A=(relpoint(c1,t)+relpoint(c2,t))/2; pair B=(relpoint(c1,t+step)+relpoint(c2,t+step))/2; path sector=g1--reverse(g2)--cycle; pen trans=opacity(((2-(2*i/n)^1.5))/2); axialshade(sector,trans+i/n*white,A,trans+(i+1)/n*white,B); } shipout(bbox(lightblue+white,Fill),format="pdf");