Asymptote Gallery Tagged by “Tex/latex features” #101
generalities-fig059

Show generalities/fig0590.asy on Github.
Generated with Asymptote 3.00-0.
Categories : Examples 2D | Generalities
Tags : #Basis | #Shading | #Tex/latex features | #Texpath | #Fill/Unfill | #Array
size(16cm,0);

path[] P=texpath("$\displaystyle\int_{-\infty}^{+\infty}e^{-\alpha x^2}\,dx=
\sqrt{\frac{\pi}{\alpha}}$");
pair m=min(P), M=max(P);

axialshade(P,yellow,m,red,(m.x,M.y));
draw(P,0.5*blue);
shipout(bbox(3mm,Fill));
generalities-fig067

Show generalities/fig0670.asy on Github.
Generated with Asymptote 3.00-0.
Categories : Examples 2D | Generalities
Tags : #Basis | #Point/Dot | #Label | #Tex/latex features | #Fraction
pair O=0;
dot(O);
label(scale(5) * "$\frac{\pi^2}{2}$", O);
generalities-fig068

Show generalities/fig0680.asy on Github.
Generated with Asymptote 3.00-0.
Categories : Examples 2D | Generalities
Tags : #Basis | #Point/Dot | #Label | #Tex/latex features | #Fraction | #Align
dot(Label(scale(5) * "$\frac{\pi^2}{2}$", (0,0), align=E));
generalities-fig071
![]()
Show generalities/fig0710.asy on Github.
Generated with Asymptote 3.00-0.
Categories : Examples 2D | Generalities
Tags : #Basis | #Point/Dot | #Label | #Tex/latex features | #Align
dot(Label("$A$"), (0,0), S);
generalities-fig073
![]()
Show generalities/fig0730.asy on Github.
Generated with Asymptote 3.00-0.
Categories : Examples 2D | Generalities
Tags : #Basis | #Point/Dot | #Label | #Tex/latex features | #Align
dot(Label("$A$", fontsize(26pt)), (0,0), NE);
generalities-fig074
![]()
Show generalities/fig0740.asy on Github.
Generated with Asymptote 3.00-0.
Categories : Examples 2D | Generalities
Tags : #Basis | #Point/Dot | #Label | #Tex/latex features | #Align | #Defaultpen
defaultpen(fontsize(26pt));

dot(Label("$A$"),(0,0),NE);
dot(Label("$B$"),(2cm,0),NE+N);
generalities-fig086
Show generalities/fig0860.asy on Github.
Generated with Asymptote 3.00-0.
Categories : Examples 2D | Generalities
Tags : #Basis | #Label | #Path | #Tex/latex features | #Align | #Rotate
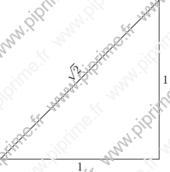
size(6cm,0);
pair A=0, B=(1,0), C=(1,1);

draw("$1$",A--B);
draw("$1$",B--C);

// draw(rotate(dir(C--A))*"$\sqrt{2}$",C--A);
draw(Label("$\sqrt{2}$",Rotate(-dir(C--A))),C--A);
generalities-fig159

Show generalities/fig1600.asy on Github.
Generated with Asymptote 3.00-0.
Categories : Examples 2D | Generalities
Tags : #Basis | #Number format | #Label | #Tex/latex features
size(0,6cm);

texpreamble("\usepackage{amsmath}
             \DeclareMathOperator{\e}{e}");

pair A=2*expi(pi/3);

draw((0,-2)--(0,2.5));
draw((0,0)--(1,0),linewidth(1mm),Arrow(2mm));
draw((0,0)--(3.5,0));
draw((0,0)--(0,1),linewidth(1mm),Arrow(2mm));

dot(Label("$A(z_a=2\e^{i\frac{\pi}{3}})$"),A,NE);
label(format("$\vert z_a\vert=%.1f$",length(A)),(.5,-1),E);
label(format("$\arg(z_a)\simeq%.4f$",angle(A)),(.5,-2),E);
generalities-fig160
Show generalities/fig1610.asy on Github.
Generated with Asymptote 3.00-0.
Categories : Examples 2D | Generalities
Tags : #Basis | #Number format | #Label | #Tex/latex features
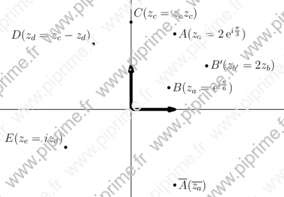
size(10cm,0);

texpreamble("\usepackage{amsmath}
             \DeclareMathOperator{\e}{e}");

pair A=2*expi(pi/3);
pair B=expi(pi/6);
pair C=A*B;
pair D=C-B;
pair Bp=2*B;
pair E=I*D;

draw((0,-2)--(0,2.5));
draw((0,0)--(1,0),linewidth(1mm),Arrow(2mm));
draw((-3,0)--(3.5,0));
draw((0,0)--(0,1),linewidth(1mm),Arrow(2mm));

dot(Label("$A(z_a=2\e^{i\frac{\pi}{3}})$"),A);
dot(Label("$B(z_a=\e^{i\frac{\pi}{6}})$"),B);
dot(Label("$B'(z_{b'}=2z_b)$"),Bp);
dot(Label("$\overline{A}(\overline{z_a})$"),conj(A));
dot(Label("$C(z_c=z_a z_c)$"),C,NE);
dot(Label("$D(z_d=z_c-z_d)$"),D,NW);
dot(Label("$E(z_e=iz_d)$"),E,NW);
graph-fig008
![]()
Show graph/fig0080.asy on Github.
Generated with Asymptote 3.00-0.
Categories : Examples 2D | Graph.asy
Tags : #Graph | #Axis | #Number format | #Tex/latex features
size(8cm,0);
import graph;
texpreamble("\usepackage[frenchb]{babel}");

xlimits( -3pi, 3pi);
xaxis(BottomTop(), Ticks(Label("$\nombre{%.2f}$",red), Step=2pi, step=pi/5, pTick=.8red));
graph-fig009
![]()
Show graph/fig0090.asy on Github.
Generated with Asymptote 3.00-0.
Categories : Examples 2D | Graph.asy
Tags : #Graph | #Axis | #Number format | #Tex/latex features
size(8cm,0);
import graph;
texpreamble("\usepackage[frenchb]{babel}");

xlimits( -10000, 10000);
xaxis(BottomTop(), Ticks(Label("$\nombre{%0.f}$",red), Step=5000, step=500, pTick=.8red));
graph-fig010
![]()
Show graph/fig0110.asy on Github.
Generated with Asymptote 3.00-0.
Categories : Examples 2D | Graph.asy
Tags : #Graph | #Axis | #Number format | #Tex/latex features
// An other solution...
size(8cm,0);
import graph;
usepackage("icomma");

xlimits( -3pi, 3pi);

xaxis(Ticks(Label(red), Step=2pi,step=pi/5,pTick=.8red));
graph-fig021
Show graph/fig0220.asy on Github.
Generated with Asymptote 3.00-0.
Categories : Examples 2D | Graph.asy
Tags : #Graph | #Function (drawing) | #Buildcycle | #Pattern | #Tex/latex features | #Grid
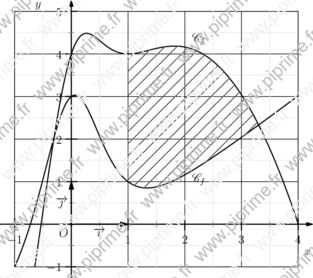
import graph;
import patterns;
usepackage("mathrsfs");

unitsize(2cm,1.5cm);
real xmin=-1,xmax=4;
real ymin=-1,ymax=5;

// Definition of fonctions f and g :
real f(real x) {return 4x-x^2+4/(x^2+1)^2;}
real g(real x) {return x-1+4/(x^2+1)^2;}

// Trace the curves :
path Cf=graph(f,xmin,xmax,n=400);
path Cg=graph(g,xmin,xmax,n=400);
draw(Cf,linewidth(1bp));
draw(Cg,linewidth(1bp));
xlimits(xmin,xmax,Crop);
ylimits(ymin,ymax,Crop);

// The grid :
xaxis(BottomTop, xmin, xmax, Ticks("%", Step=1, step=0.5, extend=true, ptick=lightgrey));
yaxis(LeftRight, ymin, ymax, Ticks("%", Step=1, step=0.5, extend=true, ptick=lightgrey));
// The axis.
xequals(Label("$y$",align=W),0,ymin=ymin-0.25, ymax=ymax+0.25,
        Ticks(NoZero,pTick=nullpen, ptick=grey),
        p=linewidth(1pt), Arrow(2mm));
yequals(Label("$x$",align=S),0,xmin=xmin-0.25, xmax=xmax+0.25,
        Ticks(NoZero,pTick=nullpen, ptick=grey),
        p=linewidth(1pt), Arrow(2mm));

labelx(Label("$O$",NoFill), 0, SW);
draw(Label("$\vec{\imath}$",align=S,UnFill),
     (0,0)--(1,0),scale(2)*currentpen,Arrow);
draw(Label("$\vec{\jmath}$",align=W,UnFill),
     (0,0)--(0,1),scale(2)*currentpen,Arrow);
dot((0,0));

label("$\mathscr{C}_f$",(2.25,f(2.25)),2N);
label("$\mathscr{C}_f$",(2.25,g(2.25)),2S);

// Les hachures.
path vline=(1,-1)--(1,5);
add("hachure",hatch(3mm));
fill(buildcycle(vline,graph(f,1,4),graph(g,1,4)),pattern("hachure"));
graph-fig022
Show graph/fig0230.asy on Github.
Generated with Asymptote 3.00-0.
Categories : Examples 2D | Graph.asy
Tags : #Graph | #Function (drawing) | #Fraction | #Label | #Tex/latex features | #Struct
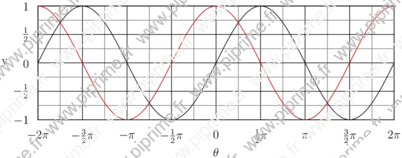
import graph;
unitsize(x=1cm,y=2cm);

struct rational
{
  int p;
  int q;
  real ep=1/10^5;
};

rational operator init() {return new rational;}

rational rational(real x, real ep=1/10^5)
{
  rational orat;
  int q=1;
  while (abs(round(q*x)-q*x)>ep)
    {
      ++q;
    }
  orat.p=round(q*x);
  orat.q=q;
  orat.ep=ep;
  return orat;
}

int pgcd(int a, int b)
{
  int a_=abs(a), b_=abs(b), r=a_;
  if (b_>a_) {a_=b_; b_=r; r=a_;}
  while (r>0)
    {
      r=a_%b_;
      a_=b_;
      b_=r;
    }
  return a_;
}

string texfrac(int p, int q,
               string factor="",
               bool signin=false, bool factorin=true,
               bool displaystyle=false,
               bool zero=true)
{
  if (p==0) return (zero ? "$0$" : "");
  string disp= displaystyle ? "$\displaystyle " : "$";
  int pgcd=pgcd(p,q);
  int num= round(p/pgcd), den= round(q/pgcd);
  string nums;
  if (num==1)
    if (factor=="" || (!factorin && (den !=1))) nums="1"; else nums="";
  else
    if (num==-1)
      if (factor=="" || (!factorin && (den !=1))) nums="-1"; else nums="-";
    else nums= (string) num;
  if (den==1) return "$" + nums + factor + "$";
  else
    {
      string dens= (den==1) ? "" : (string) den;
      if (signin || num>0)
        if (factorin)
          return disp + "\frac{" + nums + factor + "}{" + (string) dens + "}$";
        else
          return disp + "\frac{" + nums + "}{" + (string) dens + "}"+ factor + "$";
      else
        {
          if (num==-1)
            if (factor=="" || !factorin) nums="1"; else nums="";
          else nums=(string)(abs(num));
        if (factorin)
          return disp + "-\frac{" + nums + factor + "}{" + (string) dens + "}$";
        else
          return disp + "-\frac{" + nums + "}{" + (string) dens + "}"+ factor + "$";
        }
    }
}

string texfrac(rational x,
               string factor="",
               bool signin=false, bool factorin=true,
               bool displaystyle=false,
               bool zero=true)
{
  return texfrac(x.p, x.q, factor, signin, factorin, displaystyle, zero);
}

ticklabel labelfrac(real ep=1/10^5, real factor=1.0,
                    string symbol="",
                    bool signin=false, bool symbolin=true,
                    bool displaystyle=false,
                    bool zero=true)
{
  return new string(real x)
    {
      return texfrac(rational(x/factor), symbol, signin, symbolin, displaystyle, zero);
    };
}

ticklabel labelfrac=labelfrac();

xlimits( -2pi, 2pi);
ylimits( -1, 1);

yaxis("y",LeftRight , Ticks(labelfrac,Step=.5,step=.25, ptick=grey, extend=true));

xaxis("$\theta$",BottomTop, Ticks(labelfrac(factor=pi,symbol="\pi",symbolin=false),
                           Step=pi/2, step=pi/4, ptick=grey, extend=true));

draw(graph(new real(real x){return sin(x);},-2pi,2pi));
draw(graph(new real(real x){return cos(x);},-2pi,2pi), .8red);
graph-fig023

Show graph/fig0240.asy on Github.
Generated with Asymptote 3.00-0.
Categories : Examples 2D | Graph.asy
Tags : #Graph | #Function (drawing) | #Fraction | #Label | #Tex/latex features | #Struct
import graph;

// public real xunit=1cm,yunit=1cm;

void graphicrules(picture pic=currentpicture, string prefix=defaultfilename, real unit=1cm,
                  real xunit=unit != 0 ? unit : 0,
                  real yunit=unit != 0 ? unit : 0,
                  real xmin, real xmax, real ymin, real ymax)
{
  xlimits(xmin, xmax);
  ylimits(ymin, ymax);
  unitsize(x=xunit, y=yunit);
}

struct rational
{
  int p;
  int q;
  real ep=1/10^5;
};

rational operator init() {return new rational;}

rational rational(real x, real ep=1/10^5)
{
  rational orat;
  int q=1;
  while (abs(round(q*x)-q*x)>ep)
    {
      ++q;
    }
  orat.p=round(q*x);
  orat.q=q;
  orat.ep=ep;
  return orat;
}

int pgcd(int a, int b)
{
  int a_=abs(a), b_=abs(b), r=a_;
  if (b_>a_) {a_=b_; b_=r; r=a_;}
  while (r>0)
    {
      r=a_%b_;
      a_=b_;
      b_=r;
    }
  return a_;
}

string texfrac(int p, int q,
               string factor="",
               bool signin=false, bool factorin=true,
               bool displaystyle=false,
               bool zero=true)
{
  if (p==0) return (zero ? "$0$" : "");
  string disp= displaystyle ? "$\displaystyle " : "$";
  int pgcd=pgcd(p,q);
  int num= round(p/pgcd), den= round(q/pgcd);
  string nums;
  if (num==1)
    if (factor=="" || (!factorin && (den !=1))) nums="1"; else nums="";
  else
    if (num==-1)
      if (factor=="" || (!factorin && (den !=1))) nums="-1"; else nums="-";
    else nums= (string) num;
  if (den==1) return "$" + nums + factor + "$";
  else
    {
      string dens= (den==1) ? "" : (string) den;
      if (signin || num>0)
        if (factorin)
          return disp + "\frac{" + nums + factor + "}{" + (string) dens + "}$";
        else
          return disp + "\frac{" + nums + "}{" + (string) dens + "}"+ factor + "$";
      else
        {
          if (num==-1)
            if (factor=="" || !factorin) nums="1"; else nums="";
          else nums=(string)(abs(num));
          if (factorin)
            return disp + "-\frac{" + nums + factor + "}{" + (string) dens + "}$";
          else
            return disp + "-\frac{" + nums + "}{" + (string) dens + "}"+ factor + "$";
        }
    }
}

string texfrac(rational x,
               string factor="",
               bool signin=false, bool factorin=true,
               bool displaystyle=false,
               bool zero=true)
{
  return texfrac(x.p, x.q, factor, signin, factorin, displaystyle, zero);
}

ticklabel labelfrac(real ep=1/10^5, real factor=1.0,
                    string symbol="",
                    bool signin=false, bool symbolin=true,
                    bool displaystyle=false,
                    bool zero=true)
{
  return new string(real x)
    {
      return texfrac(rational(x/factor), symbol, signin, symbolin, displaystyle, zero);
    };
}

ticklabel labelfrac=labelfrac();

void grid(picture pic=currentpicture,
          real xmin=pic.userMin().x, real xmax=pic.userMax().x,
          real ymin=pic.userMin().y, real ymax=pic.userMax().y,
          real xStep=1, real xstep=.5,
          real yStep=1, real ystep=.5,
          pen pTick=nullpen, pen ptick=grey, bool above=true)
{
  xaxis(pic, BottomTop, xmin, xmax, Ticks("%",extend=true,Step=xStep,step=xstep,pTick=pTick,ptick=ptick), above=above);
  yaxis(pic, LeftRight, ymin, ymax, Ticks("%",extend=true,Step=yStep,step=ystep,pTick=pTick,ptick=ptick), above=above);
}

void cartesianaxis(picture pic=currentpicture,
                   Label Lx=Label("$x$",align=S),
                   Label Ly=Label("$y$",align=W),
                   real xmin=pic.userMin().x, real xmax=pic.userMax().x,
                   real ymin=pic.userMin().y, real ymax=pic.userMax().y,
                   real extrawidth=1, real extraheight=extrawidth,
                   pen p=currentpen,
                   ticks xticks=Ticks("%",pTick=nullpen, ptick=grey),
                   ticks yticks=Ticks("%",pTick=nullpen, ptick=grey),
                   bool above=true,
                   arrowbar arrow=Arrow)
{
  extraheight= cm*extraheight/(2*pic.yunitsize);
  extrawidth = cm*extrawidth/(2*pic.xunitsize);
  yequals(pic, Lx, 0, xmin-extrawidth, xmax+extrawidth, p, above, arrow=arrow);
  yequals(pic, 0, xmin, xmax, p, xticks, above);
  xequals(pic, Ly, 0, ymin-extraheight, ymax+extraheight, p, above, arrow=arrow);
  xequals(pic, 0, ymin, ymax, p, yticks, above);
}

void labeloij(picture pic=currentpicture,
              Label Lo=Label("$O$",NoFill),
              Label Li=Label("$\vec{\imath}$",NoFill),
              Label Lj=Label("$\vec{\jmath}$",NoFill),
              pair diro=SW, pair diri=S, pair dirj=W,
              pen p=scale(2)*currentpen,
              filltype filltype=NoFill, arrowbar arrow=Arrow(2mm))
{
  if (Lo.filltype==NoFill) Lo.filltype=filltype;
  if (Li.filltype==NoFill) Li.filltype=filltype;
  if (Lj.filltype==NoFill) Lj.filltype=filltype;
  labelx(pic, Lo, 0, diro, p);
  draw(pic, Li, (0,0)--(1,0), diri, p, arrow);
  draw(pic, Lj, (0,0)--(0,1), dirj, p, arrow);
  dot(pic, (0,0), dotsize(p)+p);
}

void labeloIJ(picture pic=currentpicture,
              Label Lo=Label("$O$",NoFill),
              Label LI=Label("$I$",NoFill),
              Label LJ=Label("$J$",NoFill),
              pair diro=SW, pair dirI=S, pair dirJ=W,
              pen p=currentpen,
              filltype filltype=NoFill, arrowbar arrow=Arrow)
{
  if (Lo.filltype==NoFill) Lo.filltype=filltype;
  if (LI.filltype==NoFill) LI.filltype=filltype;
  if (LJ.filltype==NoFill) LJ.filltype=filltype;
  labelx(pic, LI, 1, dirI, p);
  labely(pic, LJ, 1, dirJ, p);
  labelx(pic, Lo, 0, diro, p);
  dot(pic, (0,0), dotsize(p)+p);
}

graphicrules(xunit=1cm, yunit=3cm,
             xmin=-2pi, xmax=2pi, ymin=-1, ymax=1);
grid(xStep=pi/2, xstep=pi/4, yStep=.5, ystep=.25);
cartesianaxis(xticks=Ticks(Label(UnFill),labelfrac(factor=pi,symbol="\pi",symbolin=true, zero=false),Step=pi/2, step=pi/4, ptick=grey),
              yticks=Ticks(Label(UnFill),labelfrac(zero=false),Step=.5,step=.25, ptick=grey), arrow=None);
dot("$O$",(0,0),2SW);
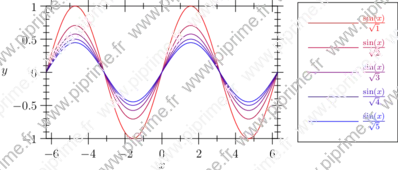
graph-fig027
Show graph/fig0280.asy on Github.
Generated with Asymptote 3.00-0.
Categories : Examples 2D | Graph.asy
Tags : #Graph | #Function (drawing) | #Legend | #Typedef | #Tex/latex features
import graph;

size(10cm,6cm,IgnoreAspect);

typedef real realfcn(real);
realfcn F(real p){
  return new real(real x){return sin(x)/sqrt(p);};
};

real pmax=5;
for (real p=1; p<=pmax; p+=1)
  {
    draw(graph(F(p),-2pi,2pi),
         ((p-1)/(pmax-1)*blue+(1-(p-1)/(pmax-1))*red),
         "$\frac{\sin(x)}{\sqrt{" + (string) p +"}}$");
  }

xlimits(-2pi,2pi);
ylimits(-1,1);

xaxis("$x$",BottomTop,Ticks);
yaxis("$y$",LeftRight,Ticks);

attach(legend(),point(E),20E,UnFill);
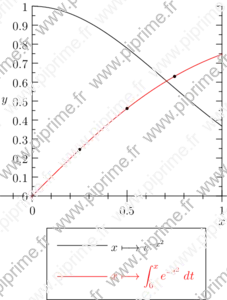
graph-fig032
Show graph/fig0330.asy on Github.
Generated with Asymptote 3.00-0.
Categories : Examples 2D | Graph.asy
Tags : #Graph | #Function (drawing) | #Legend | #Tex/latex features | #Slopefield
import slopefield;
import graph;
size(8cm,0);
real f(real t) {return exp(-t^2);}
defaultpen();

xlimits( 0,1);
ylimits( 0,1);
yaxis( "$y$" ,LeftRight, RightTicks);
xaxis( "$x$", Ticks());
draw(graph(f,0,1),"$x\longmapsto{}e^{-x^2}$");
draw(curve((0,0),f,(0,0),(1,10)),linecap(0)+red,"$\displaystyle x\longmapsto\int_{0}^{x}e^{-t^2}\;dt$");

//Test with three values calculated with Maxima:
dot((.25,0.13816319508411845*sqrt(pi))^^(.5 , 0.26024993890652326*sqrt(pi)));
dot((.75, 0.3555778168267576*sqrt(pi)));

attach(legend(),point(10S),30S);