🔗Asymptote Gallery Tagged by “Align” #89
🔗generalities-fig068

Show generalities/fig0680.asy on Github.
Generated with Asymptote 3.00-0.
Categories : Examples 2D | Generalities
Tags : #Basis | #Point/Dot | #Label | #Tex/latex features | #Fraction | #Align
dot(Label(scale(5) * "$\frac{\pi^2}{2}$", (0,0), align=E));
🔗generalities-fig071
Show generalities/fig0710.asy on Github.
Generated with Asymptote 3.00-0.
Categories : Examples 2D | Generalities
Tags : #Basis | #Point/Dot | #Label | #Tex/latex features | #Align
dot(Label("$A$"), (0,0), S);
🔗generalities-fig072

Show generalities/fig0720.asy on Github.
Generated with Asymptote 3.00-0.
Categories : Examples 2D | Generalities
Tags : #Basis | #Point/Dot | #Label | #Align | #Shipout
size(6cm, 6cm);

dot(Label("$A$"),(0,0),S);
draw(E--W,invisible);
draw(N--S,invisible);

shipout(bbox());
🔗generalities-fig073
Show generalities/fig0730.asy on Github.
Generated with Asymptote 3.00-0.
Categories : Examples 2D | Generalities
Tags : #Basis | #Point/Dot | #Label | #Tex/latex features | #Align
dot(Label("$A$", fontsize(26pt)), (0,0), NE);
🔗generalities-fig074
Show generalities/fig0740.asy on Github.
Generated with Asymptote 3.00-0.
Categories : Examples 2D | Generalities
Tags : #Basis | #Point/Dot | #Label | #Tex/latex features | #Align | #Defaultpen
defaultpen(fontsize(26pt));

dot(Label("$A$"),(0,0),NE);
dot(Label("$B$"),(2cm,0),NE+N);
🔗generalities-fig082
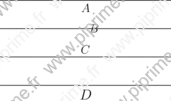
Show generalities/fig0820.asy on Github.
Generated with Asymptote 3.00-0.
Categories : Examples 2D | Generalities
Tags : #Basis | #Align | #Basealign | #Transform/scale/shift/rotate | #Fontsize
size(0,0);
path line=(0,0)--(6cm,0);
transform T=shift(0,-cm);

draw("$A$",line);
draw("$B$",T*line,dir(0));
draw("$C$",T^2*line,N);
draw(Label("$D$",fontsize(14pt)),T^3*line);
🔗generalities-fig083

Show generalities/fig0830.asy on Github.
Generated with Asymptote 3.00-0.
Categories : Examples 2D | Generalities
Tags : #Basis | #Align | #Basealign | #Fill/Unfill | #Position | #Transform/scale/shift/rotate
size(0,0);
path line=(0,0)--(6cm,0);
transform T=shift(0,-cm);

draw(Label("A",align=Center,filltype=UnFill), line);
draw(Label("B",UnFill), T*line, Center);
draw(Label("C",align=Center,position=Relative(.75),UnFill), T^2*line);
draw(Label("D",position=Relative(.25),UnFill), align=Center, T^3*line);
🔗generalities-fig084
Show generalities/fig0840.asy on Github.
Generated with Asymptote 3.00-0.
Categories : Examples 2D | Generalities
Tags : #Basis | #Align | #Basealign | #Transform/scale/shift/rotate | #Shipout
pair c=0;
label("abc xyz ijk",c,Align,basealign);
label("abc xyz ijk",c,Align,red);
draw(c--(c+(2cm,0))); // This is the baseline.

shipout((scale(3)*currentpicture.fit()));
🔗generalities-fig086
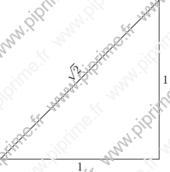
Show generalities/fig0860.asy on Github.
Generated with Asymptote 3.00-0.
Categories : Examples 2D | Generalities
Tags : #Basis | #Label | #Path | #Tex/latex features | #Align | #Rotate
size(6cm,0);
pair A=0, B=(1,0), C=(1,1);

draw("$1$",A--B);
draw("$1$",B--C);

// draw(rotate(dir(C--A))*"$\sqrt{2}$",C--A);
draw(Label("$\sqrt{2}$",Rotate(-dir(C--A))),C--A);
🔗generalities-fig087

Show generalities/fig0870.asy on Github.
Generated with Asymptote 3.00-0.
Categories : Examples 2D | Generalities
Tags : #Basis | #Label | #Path | #Align | #Rotate
size(6cm,0);
path g=(1,1)--(3,2);
draw(Label("a text",Rotate(dir(g))), g);
draw(Label("a text",red,Rotate(-dir(g)),align=I*dir(g)), g);
🔗generalities-fig104
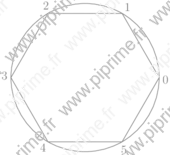
Show generalities/fig1040.asy on Github.
Generated with Asymptote 3.00-0.
Categories : Examples 2D | Generalities
Tags : #Basis | #Loop/for/while | #Fill/Unfill | #Arc | #Label | #Number format | #Align
size(6cm,0);

real a=360/6;
for (int i = -1; i < 5; ++i)
  draw(Label(format("%i",i+1)),arc((0,0),10,i*a,(i+1)*a)--cycle,grey);
🔗graph-fig034
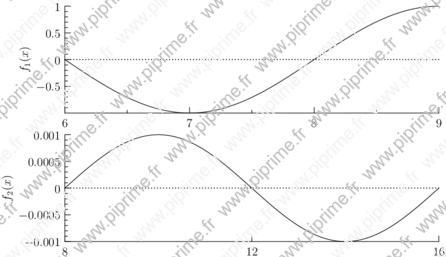
Show graph/fig0350.asy on Github.
Generated with Asymptote 3.00-0.
Categories : Examples 2D | Graph.asy
Tags : #Graph | #Function (drawing) | #Align | #Picture | #Transform/scale/shift/rotate/projection
// From Asymptote's FAQ
import graph;

real width=15cm;
real aspect=0.3;

picture pic1,pic2;

size(pic1,width,aspect*width,IgnoreAspect);
size(pic2,width,aspect*width,IgnoreAspect);

scale(pic1,false);
scale(pic2,false);

real xmin1=6;
real xmax1=9;
real xmin2=8;
real xmax2=16;

real a1=1;
real a2=0.001;

real f1(real x) {return a1*sin(x/2*pi);}
real f2(real x) {return a2*sin(x/4*pi);}

draw(pic1,graph(pic1,f1,xmin1,xmax1));
draw(pic2,graph(pic2,f2,xmin2,xmax2));

xaxis(pic1,Bottom,LeftTicks());
yaxis(pic1,"$f_1(x)$",Left,RightTicks);

xaxis(pic2,Bottom,LeftTicks(Step=4));
yaxis(pic2,"$f_2(x)$",Left,RightTicks);

yequals(pic1,0,Dotted);
yequals(pic2,0,Dotted);

pair min1=point(pic1,SW);
pair max1=point(pic1,NE);

pair min2=point(pic2,SW);
pair max2=point(pic2,NE);

real scale=(max1.x-min1.x)/(max2.x-min2.x);
real shift=min1.x/scale-min2.x;

transform t1 = pic1.calculateTransform();
transform t2 = pic2.calculateTransform();
transform T=xscale(scale*t1.xx)*yscale(t2.yy);

add(pic1.fit());
real height=truepoint(N).y-truepoint(S).y;
add(shift(0,-height)*(shift(shift)*pic2).fit(T));