Asymptote Gallery Tagged by “Axis” #135
graph-fig001

Show graph/fig0010.asy on Github.
Generated with Asymptote 3.00-0.
Categories : Examples 2D | Graph.asy
Tags : #Graph | #Axis
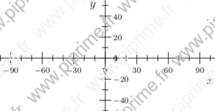
size(8cm,0,false);
import graph;

xlimits(0, 200);
ylimits(-50, 50);
yaxis("y-value");
xaxis("x-value");
graph-fig002

Show graph/fig0020.asy on Github.
Generated with Asymptote 3.00-0.
Categories : Examples 2D | Graph.asy
Tags : #Graph | #Axis
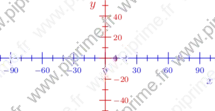
size(8cm,0,false);
import graph;

xlimits(0, 200);
ylimits(-50, 50);
yaxis( "y-value", Left);
xaxis( "x-value", Bottom(true));
graph-fig003

Show graph/fig0030.asy on Github.
Generated with Asymptote 3.00-0.
Categories : Examples 2D | Graph.asy
Tags : #Graph | #Axis
size(8cm,0,false);
import graph;

xlimits( -100, 100);
ylimits( -50, 50);
yaxis( "y" , RightTicks());
xaxis( "x", Ticks());
graph-fig004
Show graph/fig0040.asy on Github.
Generated with Asymptote 3.00-0.
Categories : Examples 2D | Graph.asy
Tags : #Graph | #Axis
size(8cm,0);
import graph;

xlimits( -100, 100);
ylimits( -50, 50);
yaxis( "$y$" , Ticks(Label(currentpen+fontsize(8),align=E)));
xaxis( "$x$", Ticks(Label(currentpen+fontsize(8))));
graph-fig005
Show graph/fig0050.asy on Github.
Generated with Asymptote 3.00-0.
Categories : Examples 2D | Graph.asy
Tags : #Graph | #Axis | #Defaultpen
size(8cm,0);
import graph;

xlimits( -100, 100);
ylimits( -50, 50);

defaultpen(overwrite(SuppressQuiet));

yaxis( "$y$" , Ticks(Label(.8red+fontsize(8),align=E)), p=.8red);
xaxis( "$x$", Ticks(Label(.8blue+fontsize(8))), p=.8blue);
graph-fig006
Show graph/fig0060.asy on Github.
Generated with Asymptote 3.00-0.
Categories : Examples 2D | Graph.asy
Tags : #Graph | #Axis | #Grid
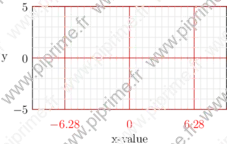
size(8cm,0);
import graph;

xlimits( -3pi, 3pi);
ylimits( -5, 5);
yaxis( "y" , LeftRight(), RightTicks(pTick=.8red, ptick=lightgrey, extend=true));
xaxis( "x-value", BottomTop(), Ticks(Label("$%.2f$",red), Step=2pi, step=pi/5, pTick=.8red, ptick=lightgrey, extend=true));
graph-fig007
![]()
Show graph/fig0070.asy on Github.
Generated with Asymptote 3.00-0.
Categories : Examples 2D | Graph.asy
Tags : #Graph | #Axis | #Number format
size(8cm,0);
import graph;

xlimits( -3pi, 3pi);
xaxis(BottomTop(), Ticks(Label("$%.2f$",red), Step=2pi, step=pi/5, pTick=.8red));
graph-fig008
![]()
Show graph/fig0080.asy on Github.
Generated with Asymptote 3.00-0.
Categories : Examples 2D | Graph.asy
Tags : #Graph | #Axis | #Number format | #Tex/latex features
size(8cm,0);
import graph;
texpreamble("\usepackage[frenchb]{babel}");

xlimits( -3pi, 3pi);
xaxis(BottomTop(), Ticks(Label("$\nombre{%.2f}$",red), Step=2pi, step=pi/5, pTick=.8red));
graph-fig009
![]()
Show graph/fig0090.asy on Github.
Generated with Asymptote 3.00-0.
Categories : Examples 2D | Graph.asy
Tags : #Graph | #Axis | #Number format | #Tex/latex features
size(8cm,0);
import graph;
texpreamble("\usepackage[frenchb]{babel}");

xlimits( -10000, 10000);
xaxis(BottomTop(), Ticks(Label("$\nombre{%0.f}$",red), Step=5000, step=500, pTick=.8red));
graph-fig010
![]()
Show graph/fig0110.asy on Github.
Generated with Asymptote 3.00-0.
Categories : Examples 2D | Graph.asy
Tags : #Graph | #Axis | #Number format | #Tex/latex features
// An other solution...
size(8cm,0);
import graph;
usepackage("icomma");

xlimits( -3pi, 3pi);

xaxis(Ticks(Label(red), Step=2pi,step=pi/5,pTick=.8red));
graph-fig011
Show graph/fig0120.asy on Github.
Generated with Asymptote 3.00-0.
Categories : Examples 2D | Graph.asy
Tags : #Graph | #Axis | #Label
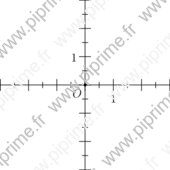
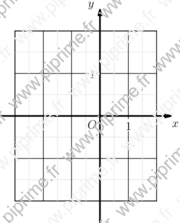
size(6cm,0);
import graph;

xlimits( -3, 3);
ylimits( -3, 3);
xaxis(Ticks("%"));
yaxis(Ticks("%"));

labelx(1,2S);
labely(1,2W);
labelx("$O$",0,SW);
dot((0,0));
graph-fig012
Show graph/fig0130.asy on Github.
Generated with Asymptote 3.00-0.
Categories : Examples 2D | Graph.asy
Tags : #Graph | #Axis | #Label
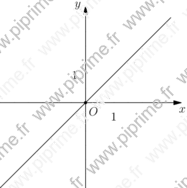
import graph;

unitsize(x=1cm);
real f(real x){return x;}
xlimits( -3, 3);
ylimits( -3, 3);
draw(graph(f,-3,3));
xaxis(Label("$x$",position=EndPoint, align=SE),Ticks("%",extend=true), Arrow);
yaxis(Label("$y$",position=EndPoint, align=NW),Ticks("%",extend=true), Arrow);

labelx(1,2S);
labely(1,2W);
labelx("$O$",0,SE);
dot((0,0));
graph-fig013

Show graph/fig0140.asy on Github.
Generated with Asymptote 3.00-0.
Categories : Examples 2D | Graph.asy
Tags : #Graph | #Axis | #Label
unitsize(x=1cm);
import graph;

xlimits( -3, 2);
ylimits( -3, 3);
xaxis(xmin=-3, xmax=2,Ticks("%"));
yaxis(ymin=-3, ymax=3, Ticks("%"));

labelx(1,2S);
labely(1,2W);
labelx("$O$",0,SW);
dot((0,0));
draw(Label("$x$",position=Relative(1),align=2S),(currentpicture.userMin().x-1,0)--(currentpicture.userMax().x+1,0),Arrow);
draw(Label("$y$",position=Relative(1),align=2W),(0,currentpicture.userMin().y-1)--(0,currentpicture.userMax().y+1),Arrow);
graph-fig014

Show graph/fig0150.asy on Github.
Generated with Asymptote 3.00-0.
Categories : Examples 2D | Graph.asy
Tags : #Graph | #Axis | #Label
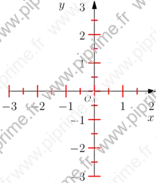
import graph;
unitsize(1cm);

xlimits( -3, 2);
ylimits( -3, 3);
xaxis("$x$",Ticks("%",begin=false, end=false),arrow=Arrow);
yaxis("$y$",Ticks("%",begin=false, end=false),arrow=Arrow);

labelx(1,2S);
labely(1,2W);
labelx("$O$",0,SW);
dot((0,0));
graph-fig015
Show graph/fig0160.asy on Github.
Generated with Asymptote 3.00-0.
Categories : Examples 2D | Graph.asy
Tags : #Graph | #Axis | #Label
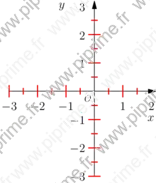
import graph;
unitsize(1cm);

xlimits( -3, 2);
ylimits( -3, 3);
xaxis("$x$",Ticks(ticklabel=NoZeroFormat,1bp+red,end=false),arrow=Arrow);
yaxis("$y$",Ticks(ticklabel=NoZeroFormat,1bp+red,end=false),arrow=Arrow);

labelx(scale(.75)*"$O$",0,SW);
graph-fig016
Show graph/fig0170.asy on Github.
Generated with Asymptote 3.00-0.
Categories : Examples 2D | Graph.asy
Tags : #Graph | #Axis | #Label
import graph;
unitsize(1cm);

xlimits( -3, 2);
ylimits( -3, 3);
xaxis("$x$",Ticks(modify=NoZero,1bp+red,end=false),arrow=Arrow);
yaxis("$y$",Ticks(modify=NoZero,1bp+red,end=false),arrow=Arrow);

labelx(scale(.75)*"$O$",0,SW);
graph-fig017
Show graph/fig0180.asy on Github.
Generated with Asymptote 3.00-0.
Categories : Examples 2D | Graph.asy
Tags : #Graph | #Axis | #Label
import graph;
unitsize(1cm);

xlimits( -3, 2);
ylimits( -3, 3);

xaxis("$x$", Ticks(ticklabel=OmitFormat(-2,-1,2),
                   modify=NoZero,
                   1bp+red,
                   end=false),
      arrow=Arrow);

yaxis("$y$", Ticks(ticklabel=OmitFormat(-2,-1,2,3),
                   modify=NoZero,
                   1bp+red,
                   end=false),
      arrow=Arrow);

labelx(scale(.75)*"$O$",0,SW);
graph-fig018
Show graph/fig0190.asy on Github.
Generated with Asymptote 3.00-0.
Categories : Examples 2D | Graph.asy
Tags : #Graph | #Axis | #Label | #Grid
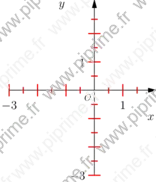
import graph;
unitsize(x=1cm, y=1.5cm);

xlimits( -3, 2);
ylimits( -2, 2);
xaxis(BottomTop, Ticks("%",extend=true, ptick=lightgrey));
yaxis(LeftRight, Ticks("%",extend=true, ptick=lightgrey));
xequals(Label("$y$",align=2NW),0,ymin=-2.5, ymax=2.5, p=linewidth(1.5pt), Arrow(2mm));
yequals(Label("$x$",align=2SE),0,xmin=-3.5, xmax=2.5, p=linewidth(1.5pt), Arrow(2mm));
labelx(Label("$1$",UnFill), 1);
labely(Label("$1$",UnFill), 1);
labelx("$O$",0,SW);
dot((0,0));
graph-fig019
Show graph/fig0200.asy on Github.
Generated with Asymptote 3.00-0.
Categories : Examples 2D | Graph.asy
Tags : #Graph | #Axis | #Label | #Grid | #Vector
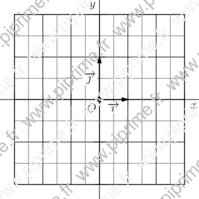
import graph;

void graphicrules(picture pic=currentpicture, string prefix=defaultfilename, real unit=1cm,
                  real xunit=unit != 0 ? unit : 0,
                  real yunit=unit != 0 ? unit : 0,
                  real xmin, real xmax, real ymin, real ymax)
{
  xlimits(xmin, xmax);
  ylimits(ymin, ymax);
  unitsize(x=xunit, y=yunit);
}

void grid(picture pic=currentpicture,
          real xmin=pic.userMin().x, real xmax=pic.userMax().x,
          real ymin=pic.userMin().y, real ymax=pic.userMax().y,
          real xStep=1, real xstep=.5,
          real yStep=1, real ystep=.5,
          pen pTick=nullpen, pen ptick=grey, bool above=false)
{
  draw(pic,box((xmin,ymin),(xmax,ymax)),invisible);
  xaxis(pic, BottomTop, xmin, xmax, Ticks("%",extend=true,Step=xStep,step=xstep,pTick=pTick,ptick=ptick), above=above);
  yaxis(pic, LeftRight, ymin, ymax, Ticks("%",extend=true,Step=yStep,step=ystep,pTick=pTick,ptick=ptick), above=above);
}

void cartesianaxis(picture pic=currentpicture,
                   Label Lx=Label("$x$",align=S),
                   Label Ly=Label("$y$",align=W),
                   real xmin=pic.userMin().x, real xmax=pic.userMax().x,
                   real ymin=pic.userMin().y, real ymax=pic.userMax().y,
                   real extrawidth=1, real extraheight=extrawidth,
                   pen p=currentpen,
                   ticks xticks=Ticks("%",pTick=nullpen, ptick=grey),
                   ticks yticks=Ticks("%",pTick=nullpen, ptick=grey),
                   bool above=true,
                   arrowbar arrow=Arrow)
{
  extraheight= cm*extraheight/(2*pic.yunitsize);
  extrawidth = cm*extrawidth/(2*pic.xunitsize);
  yequals(pic, Lx, 0, xmin-extrawidth, xmax+extrawidth, p, above, arrow=arrow);
  xequals(pic, Ly, 0, ymin-extraheight, ymax+extraheight, p, above, arrow=arrow);
  yequals(pic, 0, xmin, xmax, p, xticks, above);
  xequals(pic, 0, ymin, ymax, p, yticks, above);
}

void labeloij(picture pic=currentpicture,
              Label Lo=Label("$O$",NoFill),
              Label Li=Label("$\vec{\imath}$",NoFill),
              Label Lj=Label("$\vec{\jmath}$",NoFill),
              pair diro=SW, pair diri=S, pair dirj=W,
              pen p=scale(2)*currentpen,
              filltype filltype=NoFill, arrowbar arrow=Arrow(2mm))
{
  if (Lo.filltype==NoFill) Lo.filltype=filltype;
  if (Li.filltype==NoFill) Li.filltype=filltype;
  if (Lj.filltype==NoFill) Lj.filltype=filltype;
  labelx(pic, Lo, 0, diro, p);
  draw(pic, Li, (0,0)--(1,0), diri, p, arrow);
  draw(pic, Lj, (0,0)--(0,1), dirj, p, arrow);
  dot(pic, (0,0), dotsize(p)+p);
}

//The figure starts here
graphicrules(yunit=1.5cm, xmin=-3, xmax=3, ymin=-2, ymax=2);
grid();
cartesianaxis(arrow=None);
labeloij(UnFill);
graph-fig033
![]()
Show graph/fig0340.asy on Github.
Generated with Asymptote 3.00-0.
Categories : Examples 2D | Graph.asy
Tags : #Graph | #Font | #Axis
//Author: John Bowman
import graph;
size(2cm, 0);
xlimits(0, 100);
ylimits(-50, 50);
yaxis( "y-value" ,Left, Courier("m", "n") + fontsize(12), RightTicks("%.4g"));
graph3-fig010
Show graph3/fig0100.asy on Github.
Generated with Asymptote 3.00-0.
Categories : Examples 3D | Graph3.asy
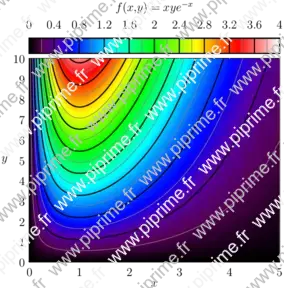
Tags : #Graph | #Contour | #Function (implicit) | #Palette | #Axis | #Array
// From documentation of Asymptote
import graph;
import palette;
import contour;
texpreamble("\usepackage{icomma}");

size(10cm,10cm,IgnoreAspect);

pair a=(0,0);
pair b=(5,10);

real fz(pair z) {
  return z.x*z.y*exp(-z.x);
}
real f(real x, real y) {return fz((x,y));}

int N=200;
int Divs=10;
int divs=2;

defaultpen(1bp);
pen Tickpen=black;
pen tickpen=gray+0.5*linewidth(currentpen);
pen[] Palette=BWRainbow();

scale(false);

bounds range=image(f,Automatic,a,b,N,Palette);

xaxis("$x$",BottomTop,LeftTicks(pTick=grey, ptick=invisible, extend=true));
yaxis("$y$",LeftRight,RightTicks(pTick=grey, ptick=invisible, extend=true));

// Major contours
real[] Cvals;
Cvals=sequence(11)/10 * (range.max-range.min) + range.min;
draw(contour(f,a,b,Cvals,N,operator ..),Tickpen);

// Minor contours
real[] cvals;
real[] sumarr=sequence(1,divs-1)/divs * (range.max-range.min)/Divs;
for (int ival=0; ival < Cvals.length-1; ++ival)
    cvals.append(Cvals[ival]+sumarr);
draw(contour(f,a,b,cvals,N,operator ..),tickpen);

palette("$f(x,y)=xye^{-x}$",range,point(NW)+(0,1),point(NE)+(0,0.25),Top,Palette,
        PaletteTicks(N=Divs,n=divs,Tickpen,tickpen));