Asymptote Gallery Tagged by “Line” #97
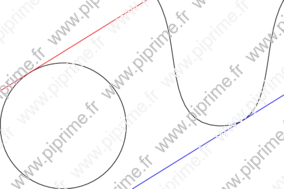
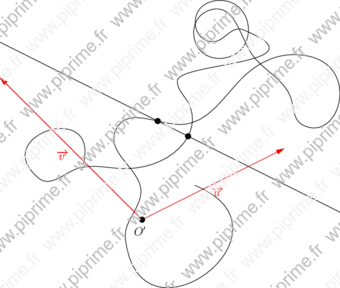
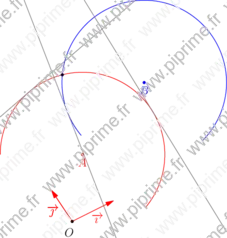
generalities-fig144
Show generalities/fig1450.asy on Github.
Generated with Asymptote 3.00-0.
Categories : Examples 2D | Generalities
Tags : #Basis | #Path | #Full line
size(10cm,0);
import math;

path cle=unitcircle;
path curv=reverse((1.5,2){dir(-60)}..(2.5,0)..{dir(60)}(3.5,2));

draw(cle);
draw(curv);

pair pt_cle=point(cle, 1.35);
pair pt_dir_cle=dir(cle, 1.35);

drawline((pt_cle - pt_dir_cle), (pt_cle + pt_dir_cle), red);

pair pt_curv=point(curv, dirtime(curv, pt_dir_cle));

drawline((pt_curv - pt_dir_cle), (pt_curv + pt_dir_cle), blue);
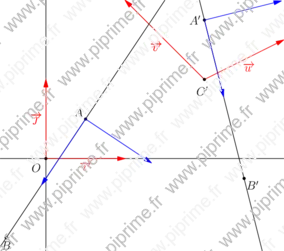
geometry-fig012
Show geometry/fig0120.asy on Github.
Generated with Asymptote 3.00-0.
Categories : Examples 2D | Geometry.asy
Tags : #Geometry | #Coords system | #Point | #Vector | #Line
import geometry;
size(10cm,0);

currentcoordsys=cartesiansystem((2,1),i=(1,0.5),j=(-1,1));
coordsys Rp=currentcoordsys;
coordsys R=defaultcoordsys;

show("$O$","$\vec{\imath}$", "$\vec{\jmath}$", R);
show("$O'$", "$\vec{u}$", "$\vec{v}$", Rp, xpen=invisible);

pair a=(0.5,0.5);
pair b=(-0.5,-1);

point A=point(R,a), B=point(R,b);
dot("$A$",A,NW); dot("$B$",B,S);
line l=line(A,B);

point Ap=a, Bp=b;
dot("$A'$",Ap,W); dot("$B'$",Bp,SE);
line lp=line(Ap,Bp);

draw(l^^lp);

draw(l.A--l.A+l.u,blue,Arrow);
draw(l.A--l.A+l.v,blue,Arrow);
draw(lp.A--lp.A+lp.u,blue,Arrow);
draw(lp.A--lp.A+lp.v,blue,Arrow);
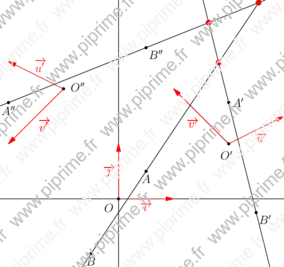
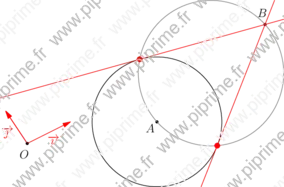
geometry-fig013
Show geometry/fig0130.asy on Github.
Generated with Asymptote 3.00-0.
Categories : Examples 2D | Geometry.asy
Tags : #Geometry | #Coords system | #Point | #Vector | #Line | #Intersection
import geometry;
size(10cm,0);

currentcoordsys=cartesiansystem((2,1),i=(1,0.5),j=(-1,1));
coordsys Rp=currentcoordsys;
coordsys Rs=cartesiansystem((-1,2),i=(-1,0.5),j=(-1,-1));
coordsys R=defaultcoordsys;

show("$O$","$\vec{\imath}$", "$\vec{\jmath}$", R);
show("$O'$","$\vec{u}$","$\vec{v}$", Rp, xpen=invisible);
show("$O''$", "$\vec{u'}$", "$\vec{v'}$", Rs, xpen=invisible);

pair a=(0.5,0.5);
pair b=(-0.5,-1);

point A=point(R,a), B=point(R,b);
dot("$A$",A,S); dot("$B$",B,S);
line l=line(A,B);

point Ap=a, Bp=b;
dot("$A'$",Ap); dot("$B'$",Bp,SE);
line lp=line(Ap,Bp);

point As=point(Rs,a), Bs=point(Rs,b);
dot("$A''$",As,S); dot("$B''$",Bs,SE);
line ls=line(As,Bs);

draw(l^^lp^^ls);

dot(intersectionpoint(l,lp),2mm+red);
dot(intersectionpoint(l,ls),2mm+red);
dot(intersectionpoint(lp,ls),2mm+red);
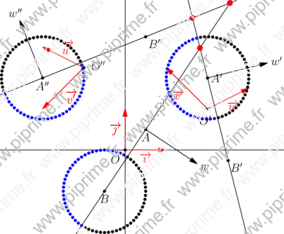
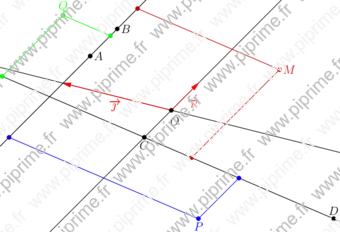
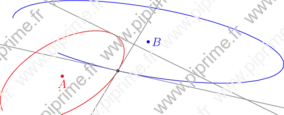
geometry-fig014
Show geometry/fig0140.asy on Github.
Generated with Asymptote 3.00-0.
Categories : Examples 2D | Geometry.asy
Tags : #Geometry | #Coords system | #Point | #Vector | #Line | #Intersection
include fig0130;

point w=l.A+1.5*l.v;
draw(Label("$w$",EndPoint),l.A--w,Arrow);

point wp=lp.A+1.5*lp.v;
draw(Label("$w'$",EndPoint),lp.A--wp,Arrow);

point ws=ls.A+1.5*ls.v;
draw(Label("$w''$",EndPoint),ls.A--ws,Arrow);

int n=64;
real step=2pi/n;

for (int i=0; i<n; ++i) {
  point p=B+point(R,R.polar(1,step*i));
  dot(p,sameside(p,w,l) ? black : blue);

  point p=Ap+point(Rp,Rp.polar(1,step*i));
  dot(p,sameside(p,wp,lp) ? black : blue);

  point p=As+point(Rs,Rs.polar(1,step*i));
  dot(p,sameside(p,ws,ls) ? black : blue);
}
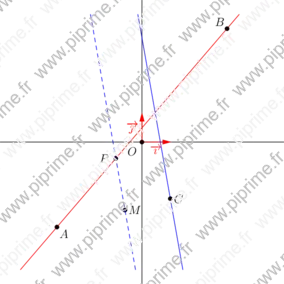
geometry-fig015
Show geometry/fig0150.asy on Github.
Generated with Asymptote 3.00-0.
Categories : Examples 2D | Geometry.asy
Tags : #Geometry | #Line | #Intersection | #Path
size(12cm,0);
import geometry;
import base_pi;
dotfactor*=2;

currentcoordsys=cartesiansystem((0,0),i=(1,0.5),j=(-1,1));
coordsys Rp=currentcoordsys;
show("$O'$","$\vec{u}$","$\vec{v}$", Rp, xpen=invisible);

path cle=randompath(20);
draw(cle);

point A=(0,1.5), B=(1,-0.5);

line l=line(A,B);
draw(l);

/*<asyxml><view file="modules/geometry.asy" type="pair[]" signature="intersectionpoints(line,path)"/></asyxml>*/
dot(intersectionpoints(l,cle));
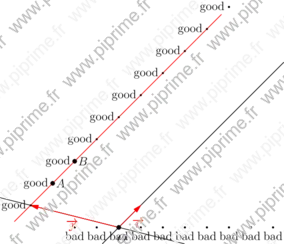
geometry-fig016
Show geometry/fig0160.asy on Github.
Generated with Asymptote 3.00-0.
Categories : Examples 2D | Geometry.asy
Tags : #Geometry | #Coords system | #Point | #Line | #Draw (2D)
size(10cm);
import geometry;
dotfactor*=1.5;
linemargin = 5mm;

currentcoordsys=cartesiansystem((2,1),i=(1,1),j=(-4,1));
show(currentcoordsys);

point A=(1,1), B=(2,1);
/*<asyxml><view file="modules/geometry.asy" type="" signature="struct line"/></asyxml>*/
line l1=line(A,B);/*<asyxml><view file="modules/geometry.asy" type="line" signature="line(point,bool,point,bool)"/></asyxml>*/

/*<asyxml><view file="modules/geometry.asy" type="void" signature="draw(picture,Label,line,bool,bool,align,pen,arrowbar,Label,marker)"/></asyxml>*/
draw(l1,red);
dot("$A$",A);
dot("$B$",B);

for (int i=0; i<10; ++i){
  pair bad=(i,l1.slope*i+l1.origin);
  point good=bad;
  draw(Label("bad",align=S),bad,linewidth(2bp));
  draw(Label(good @ l1 ? "good":"bad",align=W),good,linewidth(2bp));
}
geometry-fig017
Show geometry/fig0170.asy on Github.
Generated with Asymptote 3.00-0.
Categories : Examples 2D | Geometry.asy
Tags : #Geometry | #Coords system | #Point | #Line | #Parallel | #Perpendicular | #Intersection | #Markers
unitsize(1cm);
import geometry;
dotfactor*=1.5;
linemargin=5mm;

// currentcoordsys=cartesiansystem((2,1),i=(1,0.5),j=(-1,1));
show(currentcoordsys);

point A=(-3,-1), B=(3,4);
line l1=line(A,B);

draw(l1,red);
dot("$A$",A,SE);
dot("$B$",B,NW);

point M=(2,-2);
dot("$M$",M);

/*<asyxml><view file="modules/geometry.asy" type="line" signature="parallel(point,line)"/></asyxml>*/
draw(parallel(M,l1),red);

/*<asyxml><view file="modules/geometry.asy" type="line" signature="perpendicular(point,line)"/></asyxml>*/
line perp=perpendicular(M,l1);
draw(perp);

/*<asyxml><view file="modules/geometry.asy" type="point" signature="intersectionpoint(line,line)"/></asyxml>*/
point interp=intersectionpoint(l1,perp);
dot(interp,green);

/*<asyxml><view file="modules/geometry.asy" type="void" signature="markrightangle(picture,point,point,point,real,pen,margin,filltype)"/></asyxml>*/
markrightangle(l1.A,interp,rotate(180,interp)*M,size=5mm);

draw(box((-5,-5),(5,5)),invisible);
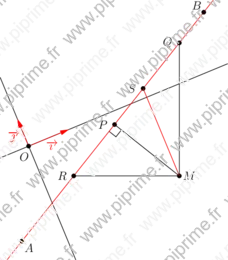
geometry-fig018
Show geometry/fig0180.asy on Github.
Generated with Asymptote 3.00-0.
Categories : Examples 2D | Geometry.asy
Tags : #Geometry | #Coords system | #Point | #Line | #Parallel | #Perpendicular | #Transform/scale/shift/rotate
unitsize(1cm);
import geometry;
dotfactor*=1.5;

currentcoordsys=cartesiansystem((0,0),i=expi(pi/8)*(1.5,0),j=expi(pi/8)*(0,1));
show(currentcoordsys);

point A=(-1,-3), B=(5,2);
line l1=line(A,B);

draw(l1,red);
dot("$A$",A,SE);
dot("$B$",B,NW);

point M=(3,-3);
dot("$M$",M);

/*<asyxml><view file="modules/geometry.asy" type="transform" signature="projection(line)"/></asyxml>*/
point P=projection(l1)*M;
dot("$P$",P,2W);
draw(M--P);
markrightangle(l1.A,P,M);


/*<asyxml><view file="modules/geometry.asy" type="transform" signature="vprojection(line,bool)"/></asyxml>*/
point Q=vprojection(l1)*M;
dot("$Q$",Q,2W);
draw(M--Q);

/*<asyxml><view file="modules/geometry.asy" type="transform" signature="hprojection(line,bool)"/></asyxml>*/
point R=hprojection(l1)*M;
dot("$R$",R,2W);
draw(M--R);

/*<asyxml><view file="modules/geometry.asy" type="transform" signature="projection(line,line,bool)"/></asyxml>*/
point S=projection(l1,line((0,0),(0,1)))*M;
dot("$S$",S,2W);
draw(M--S,red);

draw(box((-1,-4),(7,5)),invisible);
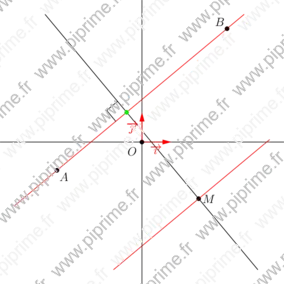
geometry-fig019
Show geometry/fig0190.asy on Github.
Generated with Asymptote 3.00-0.
Categories : Examples 2D | Geometry.asy
Tags : #Geometry | #Point | #Line | #Parallel | #Transform/scale/shift/rotate
unitsize(1cm);
import geometry;
dotfactor*=1.5;
linemargin=5mm;

// currentcoordsys=cartesiansystem((2,1),i=(1,0.5),j=(-1,1));
show(currentcoordsys);

point A=(-3,-3), B=(3,4), C=(1,-2);

line l1=line(A,B);
draw(l1,red);
dot("$A$",A,SE);
dot("$B$",B,NW);

/*<asyxml><view file="modules/geometry.asy" type="line" signature="line(real,point)"/></asyxml>*/
line l2=line(100,C);
draw(l2,blue);
dot("$C$",C);

point M=relpoint(A--C,0.6);
dot("$M$",M);

/*<asyxml><view file="modules/geometry.asy" type="transform" signature="projection(line,line,bool)"/></asyxml>*/
point P=projection(l1,l2)*M;
dot("$P$",P,2W);
draw(line(M,P),blue+dashed);

draw(box((-5,-5),(5,5)),invisible);
geometry-fig020
Show geometry/fig0200.asy on Github.
Generated with Asymptote 3.00-0.
Categories : Examples 2D | Geometry.asy
Tags : #Geometry | #Coords system | #Point | #Line | #Parallel
size(12cm);
import geometry;
dotfactor*=1.5;

currentcoordsys=cartesiansystem((2,1),i=(1,1),j=(-4,1));
show(currentcoordsys);

point A=(1,1), B=(2,1);
line l1=line(A,B);

draw(l1);
dot("$A$",A);
dot("$B$",B);

point C=(-1,0), D=(-2,-2);
line l2=line(C,D);

draw(l2);
dot("$C$",C,S);
dot("$D$",D,N);

point M=(2,-0.5);
dot("$M$",M,0.8*red);

/*<asyxml><view file="modules/geometry.asy" type="point[]" signature="sameside(point,line,line)"/></asyxml>*/
point[] Ms=sameside(M,l1,l2);
draw(M--Ms[0]^^M--Ms[1],0.8red);
dot(Ms[0]^^Ms[1],0.8red);

point P=(-3,-1);
dot("$P$",P,S,blue);

point[] Ps=sameside(P,l1,l2);
draw(P--Ps[0]^^P--Ps[1],blue);
dot(Ps[0]^^Ps[1],blue);

point Q=(2,1.5);
dot("$Q$",Q,N,green);

point[] Qs=sameside(Q,l1,l2);
draw(Q--Qs[0]^^Q--Qs[1],green);
dot(Qs[0]^^Qs[1],green);
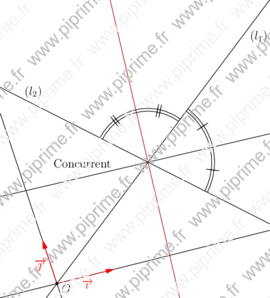
geometry-fig021
Show geometry/fig0210.asy on Github.
Generated with Asymptote 3.00-0.
Categories : Examples 2D | Geometry.asy
Tags : #Geometry | #Coords system | #Line | #Markers
size(12cm);
import geometry;

currentcoordsys=cartesiansystem((2,1),i=(1,0.5),j=(-0.25,1));
show(currentcoordsys);

point A=(1,1);
line l1=line(45,A);
draw("$(l_1)$",l1);
dot("$A$",A);

point B=(3,1);
line l2=line(-60,B);
draw("$(l_2)$",l2);
dot("$B$",B);

markangleradiusfactor*=5;
/*<asyxml><view file="modules/geometry.asy" type="void" signature="markangle(picture,Label,int,real,real,line,line,arrowbar,pen,filltype,margin,marker)"/></asyxml>*/
markangle(2,l2,l1,0.8*green,StickIntervalMarker(i=1,n=2));

markangle(2,radius=-0.5*markangleradius(),
          l2,l1,0.8*blue);

markangle(reverse(l2),reverse(l1),Arrow,StickIntervalMarker(i=1,n=2));

/*<asyxml><view file="modules/geometry.asy" type="real" signature="sharpdegrees(line,line)"/></asyxml>*/
markangle((string) sharpdegrees(l2,l1),
          radius=-1.5*markangleradius(),
          reverse(l2),l1,Arrow,red);
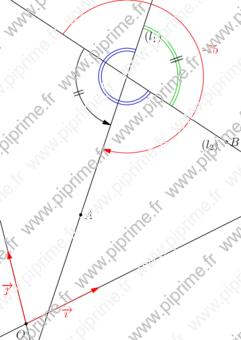
geometry-fig022
Show geometry/fig0220.asy on Github.
Generated with Asymptote 3.00-0.
Categories : Examples 2D | Geometry.asy
Tags : #Geometry | #Coords system | #Line | #Markers | #Intersection
unitsize(2cm);
import geometry;

currentcoordsys=cartesiansystem((2,1),i=(1,0.25),j=(-0.25,.75));
show(lo=Label("$O$",align=SE+0.5E), currentcoordsys);

pair A=(1,1), B=(2,2);
line l1=line(A,B);
draw("$(l_1)$",l1);

line l2=rotate(100,(3,3))*l1;
draw("$(l_2)$",l2);
write(locate(intersectionpoint(l1,l2)));
/*<asyxml><view file="modules/geometry.asy" type="line" signature="bisector(line,line,real,bool)"/></asyxml>*/
line bis=bisector(l1,l2);
draw(bis);

line Bis=bisector(l1,l2,90);
draw(Bis,0.8*red);
markangleradiusfactor*=5;

/*<asyxml><view file="modules/geometry.asy" type="void" signature="markangle(picture,Label,int,real,real,line,line,arrowbar,pen,filltype,margin,marker)"/></asyxml>*/
markangle(2, l1, l2, StickIntervalMarker(2,2,true));
markangle(2, reverse(l2), l1, radius=1.25*markangleradius(), StickIntervalMarker(2,1,true));

/*<asyxml><view file="modules/geometry.asy" type="bool" signature="concurrent(...line[])"/></asyxml>*/
if (concurrent(bis,l1,l2,Bis)) label("Concurrent",(3,3), dir(135));

draw(box(locate((-1,0)),locate((5,5))),invisible);
geometry-fig023
Show geometry/fig0230.asy on Github.
Generated with Asymptote 3.00-0.
Categories : Examples 2D | Geometry.asy
Tags : #Geometry | #Coords system | #Line | #Intersection
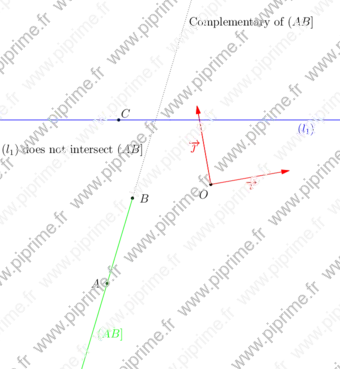
import geometry;
size(12cm,0);

currentcoordsys=cartesiansystem((2,1),i=expi(pi/18)*(1,0),j=expi(pi/18)*(0,1));
show(currentcoordsys,xpen=invisible);

point A=(-1.5,-1);
point C=(-1,1);
point B=(-1,0);

dot("$A$", A, 2W);
dot("$B$", B, 2E);

line l1=hline()+C;
draw("$(l_1)$", l1, blue);
dot("$C$", C, NE);

line l2=line(A, B, false);
draw(Label("$(AB]$",Relative(.25),SE), l2, green);

/*<asyxml><view file="modules/geometry.asy" type="line" signature="complementary(explicit line)"/></asyxml>*/
draw("Complementary of $(AB]$", complementary(l2), dotted+roundcap);

point p=intersectionpoint(l1,l2);

/*<asyxml><view file="modules/geometry.asy" type="bool" signature="defined(pair)"/></asyxml>*/
string s="$(l_1)$" + (defined(p) ? " intersects " : " does not intersect ") + "$(AB]$";
label(s, A+1.75*l2.u,W);

draw(box(locate((-2,-2)),locate((2,2))), invisible);
geometry-fig024
Show geometry/fig0240.asy on Github.
Generated with Asymptote 3.00-0.
Categories : Examples 2D | Geometry.asy
Tags : #Geometry | #Coords system | #Line | #Segment | #Draw (2D)
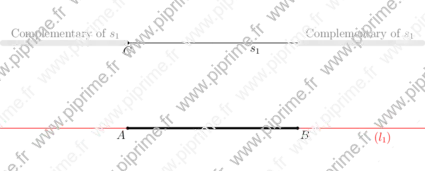
import geometry;
size(15cm,0);

// currentcoordsys=cartesiansystem((2,1),i=(1,0.25),j=(-0.25,.75));
// show(lj=Label("$\vec{\jmath}$",EndPoint), currentcoordsys);

point A=(-1,-0.5);
point B=(1,-0.5);
point C=(-1,0.5);

line l1=line(A,B);
draw("$(l_1)$",l1,red);

/*<asyxml><view file="modules/geometry.asy" type="" signature="struct segment"/></asyxml>*/
segment s=segment(A,B);
draw(s, linewidth(2bp));
dot("$A$", A, SW);
dot("$B$", B, SE);
dot("$C$", C, S);

segment s1=parallel(C,s);
draw(Label("$s_1$",Relative(0.75)),s1);

Label lt=Label("Complementary of $s_1$",Relative(0.5),align=N,grey);
Label[] L={lt, lt};

/*<asyxml><view file="modules/geometry.asy" type="line[]" signature="complementary(explicit segment)"/></asyxml>*/
line[] cs1=complementary(s1);

/*<asyxml><view file="modules/geometry.asy" type="void" signature="draw(picture,Label[],line[],align,pen,arrowbar,Label,marker)"/></asyxml>*/
draw(L, cs1, 2mm+lightgrey);

draw(box(locate((-2.5,-1)),locate((2.5,1))), invisible);
geometry-fig025
Show geometry/fig0250.asy on Github.
Generated with Asymptote 3.00-0.
Categories : Examples 2D | Geometry.asy
Tags : #Geometry | #Line | #Segment | #Perpendicular
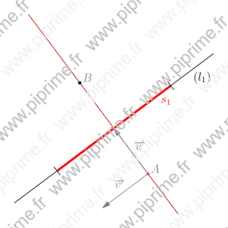
unitsize(2cm);
import geometry;
linemargin=5mm;

// currentcoordsys=cartesiansystem((2,1),i=(1,0.25),j=(-0.25,.75));
// show(li=Label("$\vec{\imath}$",align=S,EndPoint), currentcoordsys);

point A=(-1,-1), B=(1,0.5);
line l1=line(A,B);

draw("$(l_1)$",l1);
draw("$s_1$",(segment) l1, 2pt+red,
     marker(stickframe,markuniform(2,true)));

/*<asyxml><view file="modules/geometry.asy" type="line" signature="bisector(segment,real)"/></asyxml>*/
line bis=bisector((segment) l1);
draw(bis,red);

/*<asyxml><view file="modules/geometry.asy" type="void" signature="show(picture,line,pen)"/></asyxml>*/
show(bis,grey);

/*<asyxml><view file="modules/geometry.asy" type="point" signature="point(line,real)"/></asyxml>*/
dot(point(bis,1.5));

draw(box(locate((-2,-2)),locate((2,2))),invisible);
geometry-fig034
Show geometry/fig0340.asy on Github.
Generated with Asymptote 3.00-0.
Categories : Examples 2D | Geometry.asy
Tags : #Geometry | #Draw (2D) | #Clip | #Deferred drawing | #Hyperbola | #Line
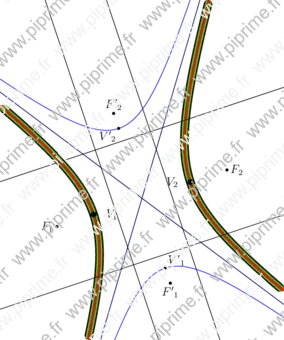
import geometry;
size(10cm,0);

// currentcoordsys=cartesiansystem((2,1),i=(1,0.5),j=(-0.25,.75));
// show(currentcoordsys);

point F1=(1,0);
point F2=(4,1);
dot("$F_1$",F1,W);
dot("$F_2$",F2);

// Enlarge the bounding box of the current picture
draw(box((0,-2), (5,4)), invisible);

/*<asyxml><view file="modules/geometry.asy" type="hyperbola" signature="hyperbola(point,point,real,bool)"/></asyxml>*/
hyperbola h=hyperbola(F1, F2, 0.9);
draw(h, linewidth(3mm));
draw(h.A1, grey);
draw(h.A2, grey);
draw(h.D1);
draw(h.D2);

/*<asyxml><view file="modules/geometry.asy" type="hyperbola" signature="hyperbola(point,real,real,real)"/></asyxml>*/
draw(hyperbola(h.C, h.a, h.b, h.angle), 2mm+green);

/*<asyxml><view file="modules/geometry.asy" type="hyperbola" signature="hyperbola(bqe)"/></asyxml>*/
draw(hyperbola(equation(h)), 1mm+red);

/*<asyxml><view file="modules/geometry.asy" type="hyperbola" signature="conj(hyperbola)"/></asyxml>*/
hyperbola ch=conj(h);
draw(ch, blue);
draw(ch.A1, 0.5blue);
draw(ch.A2, 0.5blue);
draw(ch.D1);
draw(ch.D2);
dot("${V'}_1$", ch.V1, NE);
dot("${V'}_2$", ch.V2, SW);
dot("${F'}_1$", ch.F1, S);
dot("${F'}_2$", ch.F2, N);

dot("$V_1$", h.V1, 2E, linewidth(2mm));
dot("$V_2$", h.V2, 2W, linewidth(2mm));
geometry-fig035
Show geometry/fig0350.asy on Github.
Generated with Asymptote 3.00-0.
Categories : Examples 2D | Geometry.asy
Tags : #Geometry | #Circle | #Line | #Intersection
import geometry;
size(8cm,0);

currentcoordsys=cartesiansystem((2,1),i=(1,0.5),j=(-0.25,.75));
show(currentcoordsys, xpen=invisible);

point A=(-1,0);
point B=(0.5,-3sin(2));
dot("$A$",A,S,red);
dot("$B$",B,N,red);

line l=line(A,B);
circle c=circle((point)(0,-sqrt(2)/2),exp(1));
draw(l);
draw(c);

/*<asyxml><view file="modules/geometry.asy" type="point[]" signature="intersectionpoints(line,circle)"/></asyxml>*/
point[] inter=intersectionpoints(l,c);
dot("$M$", inter[0], 2S, red);
dot("$N$", inter[1], 2N+0.5W, red);
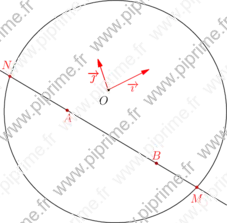
geometry-fig036
Show geometry/fig0360.asy on Github.
Generated with Asymptote 3.00-0.
Categories : Examples 2D | Geometry.asy
Tags : #Geometry | #Line | #Ellipse | #Intersection
import geometry;
size(8cm,0);

currentcoordsys=cartesiansystem((2,1),i=(1,0.5),j=(-0.25,.75));
show(currentcoordsys);

point A=(-1,0);
point B=(0.5,-3sin(2));
dot("$A$",A,S,red);
dot("$B$",B,N,red);

line l=line(A,B);
ellipse el=ellipse((0,-sqrt(2)/2),3,2,90);
draw(l);
draw(el,Arrow);

/*<asyxml><view file="modules/geometry.asy" type="point[]" signature="intersectionpoints(line,ellipse)"/></asyxml>*/
point[] inter=intersectionpoints(l,el);
dot("$M$", inter[0], 4N+2W, red);
dot("$N$", inter[1], 2S+0.5E, red);
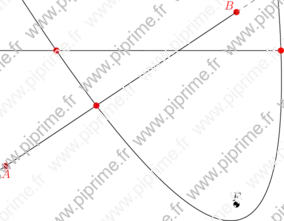
geometry-fig037
Show geometry/fig0370.asy on Github.
Generated with Asymptote 3.00-0.
Categories : Examples 2D | Geometry.asy
Tags : #Geometry | #Line | #Parabola | #Intersection
import geometry;
size(10cm);

// currentcoordsys=cartesiansystem((2,1),i=(1,0.5),j=(-0.25,.75));
// show(currentcoordsys);

point A=(-1,-1);
point B=(2,1);
dot("$A$",A,S,red);
dot("$B$",B,N,red);

line l=line(A,B);
draw(l);

point F=(2,-1.5);
dot("$F$",F,N);

parabola p=parabola(F,0.2,110);
draw(p);

/*<asyxml><view file="modules/geometry.asy" type="point[]" signature="intersectionpoints(line,parabola)"/></asyxml>*/
point[] inter=intersectionpoints(l,p);
dot("$M$", inter[0], 2N+E, red);
dot("$N$", inter[1], S+2E, red);
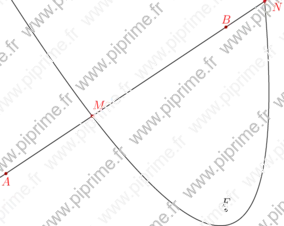
geometry-fig038

Show geometry/fig0380.asy on Github.
Generated with Asymptote 3.00-0.
Categories : Examples 2D | Geometry.asy
Tags : #Geometry | #Line | #Intersection | #Hyperbola
import geometry;
size(10cm);

// currentcoordsys=cartesiansystem((2,1),i=(1,0.5),j=(-0.25,.75));
// show(currentcoordsys);

// Enlarge the bounding box of the current picture
draw(box((-6,-5), (10,2)), invisible);

point A=(-2,-2);
point B=(2,-3);
dot("$A$",A,N,red);
dot("$B$",B,S,red);

line l=line(A,B);
draw(l);

point C=(2,-1.5);
dot("$C$",C,N);

hyperbola h=hyperbola(C,sqrt(2),sqrt(2)/2,0);
draw(h);

/*<asyxml><view file="modules/geometry.asy" type="point[]" signature="intersectionpoints(line,hyperbola)"/></asyxml>*/
point[] inter=intersectionpoints(l,h);
dot("$M$", inter[0], 2N+E, red);
dot("$N$", inter[1], 2S+E, red);
geometry-fig039
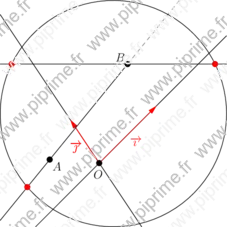
Show geometry/fig0390.asy on Github.
Generated with Asymptote 3.00-0.
Categories : Examples 2D | Geometry.asy
Tags : #Geometry | #Line | #Intersection | #Circle
import geometry;

size(8cm,0);

currentcoordsys=cartesiansystem((0,0),i=(1,1),j=(-0.5,.75));
show(currentcoordsys);

point A=(-0.5,.75);
point B=(1,1);
dot("$A$",A,SE);
dot("$B$",B,NW);

line l=line(A,B,false);
line ll=hline()+B;

circle c=circle((point)(0.5,0.5),2);
draw(l^^ll);
draw(complementary(l),dashed+grey);
draw(c);

dotfactor*=2;

/*<asyxml><view file="modules/geometry.asy" type="point[]" signature="intersectionpoints(line,circle)"/></asyxml>*/
dot(intersectionpoints(l,c),red);
dot(intersectionpoints(ll,c),red);
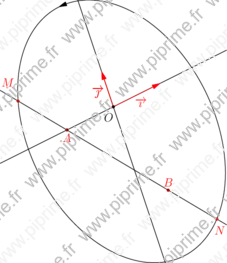
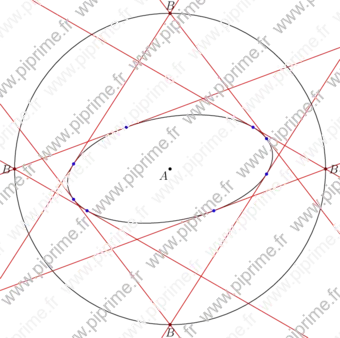
geometry-fig040
Show geometry/fig0400.asy on Github.
Generated with Asymptote 3.00-0.
Categories : Examples 2D | Geometry.asy
Tags : #Geometry | #Line | #Intersection | #Ellipse
import geometry;

size(8cm,0);

currentcoordsys=cartesiansystem((0,0),i=(1,1),j=(-0.5,.75));
show(currentcoordsys);

point A=(-0.5,.75);
point B=(1,1);
dot("$A$",A,SE);
dot("$B$",B,NW);

line l=line(A,B,false);
line ll=hline()+B;

ellipse el=ellipse((point)(0.5,0.5),3,2);
draw(l^^ll);
draw(complementary(l),dashed+grey);
draw(el);

dotfactor*=2;

/*<asyxml><view file="modules/geometry.asy" type="point[]" signature="intersectionpoints(line,ellipse)"/></asyxml>*/
dot(intersectionpoints(l,el),red);
dot(intersectionpoints(ll,el),red);
geometry-fig041
Show geometry/fig0410.asy on Github.
Generated with Asymptote 3.00-0.
Categories : Examples 2D | Geometry.asy
Tags : #Geometry | #Line | #Intersection | #Parabola
import geometry;
size(10cm);

// currentcoordsys=cartesiansystem((2,1),i=(1,0.5),j=(-0.25,.75));
// show(currentcoordsys);

point A=(-1,-1);
point B=(2,1);
dot("$A$",A,S,red);
dot("$B$",B,NW,red);

line l=line(A,B,false);
line ll=hline()+0.5*B;
draw(l^^ll);
draw(complementary(l),dashed+grey);

point F=(2,-1.5);
dot("$F$",F,N);

parabola p=parabola(F,0.2,110);
draw(p);

dotfactor*=2;

/*<asyxml><view file="modules/geometry.asy" type="point[]" signature="intersectionpoints(line,parabola)"/></asyxml>*/
dot(intersectionpoints(l,p), red);
dot(intersectionpoints(ll,p), red);
geometry-fig042
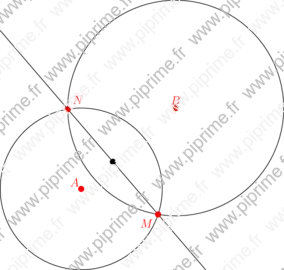
Show geometry/fig0420.asy on Github.
Generated with Asymptote 3.00-0.
Categories : Examples 2D | Geometry.asy
Tags : #Geometry | #Line | #Intersection | #Circle
import geometry;
size(10cm,0);

// currentcoordsys=cartesiansystem((0,0),i=(1,1),j=(-0.5,.75));
// show(currentcoordsys);

point A=(-1,-1);
point B=(0.75,0.5);
dot("$A$",A,NW,red);
dot("$B$",B,N,red);

circle c1=circle(A,1.5);
circle c2=circle(B,2);
draw(c1^^c2);

/*<asyxml><view file="modules/geometry.asy" type="line" signature="radicalline(circle,circle)"/></asyxml>*/
draw(radicalline(c1,c2));
/*<asyxml><view file="modules/geometry.asy" type="point" signature="radicalcenter(circle,circle)"/></asyxml>*/
dot(radicalcenter(c1,c2));

dotfactor*=2;

/*<asyxml><view file="modules/geometry.asy" type="point[]" signature="intersectionpoints(circle,circle)"/></asyxml>*/
point[] inter=intersectionpoints(c1,c2);
dot("$M$", inter[0], 2SW, red);
dot("$N$", inter[1], 2NE, red);
geometry-fig044
Show geometry/fig0440.asy on Github.
Generated with Asymptote 3.00-0.
Categories : Examples 2D | Geometry.asy
Tags : #Geometry | #Line | #Intersection | #Circle | #Tangent
import geometry;
size(10cm,0);

// currentcoordsys=cartesiansystem((0,0),i=(1,0.25),j=(-0.5,.75));
show(currentcoordsys, xpen=invisible);

point A=(-1,-1);
point B=(0.75,0.5);
dot("$A$",A,NW,red);
dot("$B$",B,N,red);

circle c1=circle(A,1.5);
circle c2=circle(B,2);
draw(c1^^c2);

point[] inter=intersectionpoints(c1,c2);
dot("$M$", inter[0], 2NW, red);

/*<asyxml><view file="modules/geometry.asy" type="line" signature="tangent(circle,point)"/></asyxml>*/
draw(tangent(c1,inter[0]), grey);
draw(tangent(c2,inter[0]), grey);

/*<asyxml><view file="modules/geometry.asy" type="line" signature="tangent(circle,abscissa)"/></asyxml>*/
draw(tangent(c2,angabscissa(135)), grey);
geometry-fig045
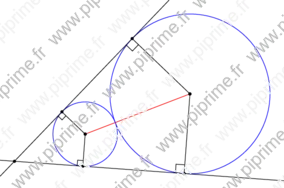
Show geometry/fig0450.asy on Github.
Generated with Asymptote 3.00-0.
Categories : Examples 2D | Geometry.asy
Tags : #Geometry | #Line | #Intersection | #Circle | #Point | #Perpendicular
import geometry;
size(10cm,0);

point c2=(13,5);
real r=4, R=abs(c2)-r;

circle[] C={circle(origin, 4), circle(c2,R)};
draw(C[0]^^C[1], blue);

segment s=segment(origin, c2);
draw(s, red, dot);

/*<asyxml><view file="modules/geometry.asy" type="point" signature="curpoint(line,real)"/></asyxml>*/
point T=curpoint(s,r/(r-R)*abs(c2));
dot(T);
/*<asyxml><view file="modules/geometry.asy" type="line" signature="tangents(circle,point)"/></asyxml>*/
line[] tgt=tangents(C[1], T);
draw(tgt);

point[][] t= new point[2][2];
for (int i=0; i < 2 ; ++i)
  for (int j=0; j < 2; ++j) {
    /*<asyxml><view file="modules/geometry.asy" type="point[]" signature="intersectionpoints(line,circle)"/></asyxml>*/
    t[i][j]=intersectionpoints(C[i],tgt[j])[0];
    draw(C[i].C--t[i][j], dot);
    markrightangle(T, t[i][j], C[i].C, size=(i == 0 ? 2mm : 0));
  }

addMargins(cm/2,cm/2);
geometry-fig046
Show geometry/fig0460.asy on Github.
Generated with Asymptote 3.00-0.
Categories : Examples 2D | Geometry.asy
Tags : #Geometry | #Line | #Intersection | #Ellipse | #Abscissa | #Point | #Tangent
import geometry;
size(10cm,0);

// currentcoordsys=cartesiansystem((0,0),i=(1,0.5),j=(-0.5,.75));
show(currentcoordsys, xpen=invisible);

point A=(-1,-1);
point B=(0.75,0.5);
dot("$A$",A,NW,red);
dot("$B$",B,N,red);

ellipse el1=ellipse(A,2,1.5);
ellipse el2=ellipse(B,3,2);
draw(el1);
draw(el2,Arrow);

point[] inter=intersectionpoints(el1,el2);
dot("$M$", inter[0], 2NW, red);

/*<asyxml><view file="modules/geometry.asy" type="line[]" signature="tangents(ellipse,point)"/></asyxml>*/
draw(tangents(el1,inter[0]), grey);
draw(tangents(el2,inter[0]), grey);

/*<asyxml><view file="modules/geometry.asy" type="line" signature="tangent(ellipse,abscissa)"/></asyxml>*/
draw(tangent(el2,angabscissa(90)), grey);
geometry-fig047
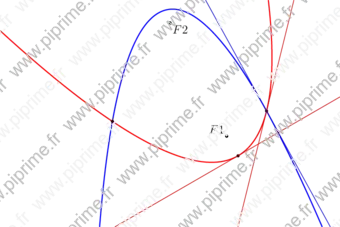
Show geometry/fig0470.asy on Github.
Generated with Asymptote 3.00-0.
Categories : Examples 2D | Geometry.asy
Tags : #Geometry | #Line | #Intersection | #Parabola | #Abscissa | #Point | #Tangent
import geometry;
size(12cm);

// currentcoordsys=cartesiansystem((0,0),i=(1,0.5),j=(-0.5,.75));
// show(currentcoordsys, xpen=invisible);

point F1=(0,0);
dot("$F1$",F1,NW);
point F2=(-0.25,0.5);
dot("$F2$",F2,SE);

parabola p=parabola(F1, 0.1, 120);
draw(p, bp+red);

parabola pp=parabola(F2, 0.06, 280);
draw(pp, bp+blue);

abscissa x=angabscissa(180);
dot(point(p,x));
/*<asyxml><view file="modules/geometry.asy" type="line" signature="tangent(parabola,abscissa)"/></asyxml>*/
draw(tangent(p,x), 0.8*red);

point[] P=intersectionpoints(p,pp);
dot(P);

/*<asyxml><view file="modules/geometry.asy" type="line[]" signature="tangents(parabola,point)"/></asyxml>*/
draw(tangents(p,P[0]), 0.8*red);
draw(tangents(pp,P[0]), 0.8*blue);

// Enlarge the bounding box
draw(box((-1,-0.4), (0.5,0.6)),invisible);
geometry-fig048

Show geometry/fig0480.asy on Github.
Generated with Asymptote 3.00-0.
Categories : Examples 2D | Geometry.asy
Tags : #Geometry | #Line | #Intersection | #Hyperbola | #Abscissa | #Point | #Tangent
import geometry;
size(10cm);

point C=(4,2);
dot("$C$",C,E+NE,red);

hyperbola h=hyperbola(C,1.5,1,-20);
draw(h, linewidth(bp));

/*<asyxml><view file="modules/geometry.asy" type="line" signature="tangent(hyperbola,abscissa)"/></asyxml>*/
line l=tangent(h,angabscissa(85));
draw(l, grey);
dot(intersectionpoints(h,l));

l=tangent(h,angabscissa(0,fromCenter));
draw(l, grey);
dot(intersectionpoints(h,l));

// Enlarge the bounding box of the current picture.
draw(box((-1,-0.5), (9,4)), invisible);
geometry-fig049
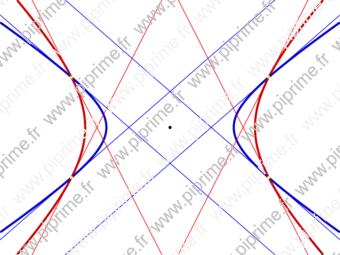
Show geometry/fig0490.asy on Github.
Generated with Asymptote 3.00-0.
Categories : Examples 2D | Geometry.asy
Tags : #Geometry | #Line | #Intersection | #Hyperbola | #Point | #Tangent
import geometry;
size(12cm);

point C=(0,0);
dot(C);

hyperbola[] h;
h[0]=hyperbola(C,2,2);
h[1]=hyperbola(C,1.5,1);

draw(h[0], 2bp+0.8*red);
draw(h[1], 2bp+0.8*blue);

point[] P=intersectionpoints(h[0],h[1]);

line[] l;
for (int i=0; i < P.length; ++i) {
  for (int j=0; j < 2; ++j) {
    /*<asyxml><view file="modules/geometry.asy" type="line[]" signature="tangents(hyperbola,point)"/></asyxml>*/
    l=tangents(h[j],P[i]);
    draw(l[0], j == 0 ? red : blue);
  }
}

dot(P, yellow);

// Enlarge the bounding box of the current picture.
draw(box((-4,-3), (4,3)), invisible);
geometry-fig050
Show geometry/fig0500.asy on Github.
Generated with Asymptote 3.00-0.
Categories : Examples 2D | Geometry.asy
Tags : #Geometry | #Line | #Intersection | #Circle | #Tangent | #Point
import geometry;
size(10cm,0);

currentcoordsys=cartesiansystem((0,0),i=(1,0.5),j=(-0.5,.75));
show(currentcoordsys, xpen=invisible);

point A=(2.5,-1);
point B=A+(3,1);
dot("$A$",A,SW);
dot("$B$",B,2N+0.5W);

circle c1=circle(A,1.5);
draw(c1);

/*<asyxml><view file="modules/geometry.asy" type="line[]" signature="tangents(circle,point)"/></asyxml>*/
line[] tgt=tangents(c1,B);
draw(tgt,red);
/*<asyxml><view file="modules/geometry.asy" type="circle" signature="circle(point,point)"/></asyxml>*/
draw(circle(B,A),grey);

// dot(intersectionpoints(c1,circle(B,A)),red);
for (int i=0; i<tgt.length; ++i) {
  dot(intersectionpoints(c1,tgt[i]),2mm+red);
}
geometry-fig051
Show geometry/fig0510.asy on Github.
Generated with Asymptote 3.00-0.
Categories : Examples 2D | Geometry.asy
Tags : #Geometry | #Line | #Intersection | #Circle | #Tangent | #Ellipse | #Point
import geometry;
size(12cm,0);

// currentcoordsys=cartesiansystem((0,0),i=(1,0.5),j=(-0.5,.75));
// show(currentcoordsys, xpen=invisible);

point A=(2.5,-1);
dot("$A$",A,SW);
ellipse el1=ellipse(A,2,1,10);
draw(el1);

circle C=circle(A,3);
draw(C);
for (int i=0; i < 360; i+=90) {

  point B=point(C,angabscissa(i));
  dot("$B$",B,locate(unit(B-A)));


  line[] tgt=tangents(el1,B);
  draw(tgt,0.8*red);

  for (int i=0; i < tgt.length; ++i) {
    dot(intersectionpoints(el1,tgt[i]),blue);
  }

}
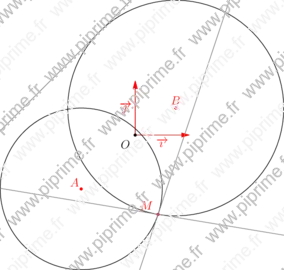
geometry-fig052
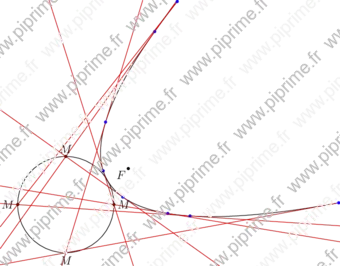
Show geometry/fig0520.asy on Github.
Generated with Asymptote 3.00-0.
Categories : Examples 2D | Geometry.asy
Tags : #Geometry | #Line | #Intersection | #Circle | #Tangent | #Ellipse | #Point
import geometry;
size(12cm,0);

// currentcoordsys=cartesiansystem((0,0),i=(1,0.5),j=(-0.5,.75));
// show(currentcoordsys, xpen=invisible);

point F=(0,0);
dot("$F$", F, SW);
parabola p=parabola(F, 0.1, 30);
draw(p);

point C=shift(2*(p.V-p.F))*p.V;
circle cle=circle(C, 0.2);
draw(cle);
for (int i=0; i < 360; i+=90) {

  point M=point(cle, angabscissa(i));
  dot("$M$", M, locate(unit(M-C)));

  line[] tgt=tangents(p, M);
  draw(tgt, 0.8*red);

  for (int i=0; i < tgt.length; ++i) {
    dot(intersectionpoints(p, tgt[i]), blue);
  }
}
geometry-fig056
Show geometry/fig0560.asy on Github.
Generated with Asymptote 3.00-0.
Categories : Examples 2D | Geometry.asy
Tags : #Geometry | #Line | #Abscissa | #Point
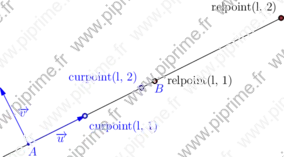
import geometry;
size(10cm,0);

// currentcoordsys=cartesiansystem((0,0),i=(1,0.5),j=(-0.5,.75));
// show(currentcoordsys, xpen=invisible);

point A=(0,0), B=(2,1);

line l=line(A,B);
draw(l);
show(l, blue);

/*<asyxml><view file="modules/geometry.asy" type="point" signature="relpoint(line,real)"/></asyxml>*/
point P=relpoint(l, 1);
dot("relpoint(l, 1)", P, 2E,linewidth(2mm));
/*<asyxml><view file="modules/geometry.asy" type="abscissa" signature="relabscissa(line,point)"/></asyxml>*/
dot(point(l,relabscissa(l,P)), red);

/*<asyxml><view file="modules/geometry.asy" type="point" signature="curpoint(line,real)"/></asyxml>*/
point P=curpoint(l, 1);
dot("curpoint(l, 1)", P, SE, blue+2mm);
/*<asyxml><view file="modules/geometry.asy" type="abscissa" signature="curabscissa(line,point)"/></asyxml>*/
dot(point(l,curabscissa(l,P)), yellow);


point P=relpoint(l, 2);
dot("relpoint(l, 2)", P, NW,linewidth(2mm));
dot(point(l,relabscissa(l,P)), red);

point P=curpoint(l, 2);
dot("curpoint(l, 2)", P, NW, blue+2mm);
dot(point(l,curabscissa(l,P)), yellow);
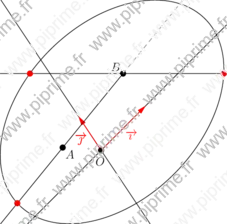
geometry-fig096
Show geometry/fig0960.asy on Github.
Generated with Asymptote 3.00-0.
Categories : Examples 2D | Geometry.asy
Tags : #Geometry | #Arc | #Circle | #Line | #Abscissa | #Intersection | #Point
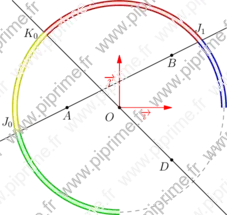
import geometry;
size(8cm);

// currentcoordsys=cartesiansystem((1,2),i=(1,0.5),j=(-0.5,.75));
show(currentcoordsys, xpen=invisible);

point A=(-1,0) ; dot("$A$",A,S);
point B=(1,1)  ; dot("$B$",B,S);
point C=(0,0)  ;
point D=(1,-1) ; dot("$D$",D,SW);

arc c=arc(circle(C,2), 0, 270);
draw(complementary(c),dashed+grey);

line l1=line(A,B); draw(l1);
line l2=line(C,D); draw(l2);

point[] J=intersectionpoints(l1,c);
point[] K=intersectionpoints(l2,c);

/*<asyxml><view file="modules/geometry.asy" type="arc" signature="arc(explicit arc,point,point)"/></asyxml>*/
draw(arc(c,K[0],J[0]),2mm+0.8yellow);
draw(arc(c,J[1],K[0]),2mm+0.8red);
/*<asyxml><view file="modules/geometry.asy" type="arc" signature="arc(explicit arc,abscissa,abscissa)"/></asyxml>*/
draw(arc(c,relabscissa(c,J[0]),relabscissa(1)),2mm+0.8green);
draw(arc(c,relabscissa(0),relabscissa(c,J[1])),2mm+0.8blue);

dot("$J_0$",J[0],2NW);
dot("$J_1$",J[1],2N);
dot("$K_0$",K[0],2W);

draw(c, 1mm+white);
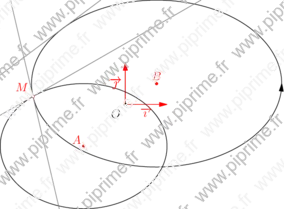
geometry-fig097
Show geometry/fig0970.asy on Github.
Generated with Asymptote 3.00-0.
Categories : Examples 2D | Geometry.asy
Tags : #Geometry | #Arc | #Ellipse | #Line | #Abscissa | #Intersection | #Point
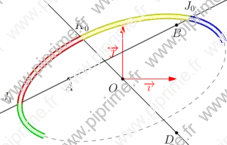
import geometry;
size(8cm);

// currentcoordsys=cartesiansystem((1,2),i=(1,0.5),j=(-0.5,.75));
show(currentcoordsys, xpen=invisible);

point A=(-1,0) ; dot("$A$",A,S);
point B=(1,1)  ; dot("$B$",B,S);
point C=(0,0)  ;
point D=(1,-1) ; dot("$D$",D,SW);

arc c=arc(ellipse(C,2,1,20), 0, 270);
draw(complementary(c),dashed+grey);

line l1=line(A,B); draw(l1);
line l2=line(C,D); draw(l2);

point[] J=intersectionpoints(l1,c);
point[] K=intersectionpoints(l2,c);

/*<asyxml><view file="modules/geometry.asy" type="arc" signature="arc(explicit arc,point,point)"/></asyxml>*/
draw(arc(c,J[0],K[0]),2mm+0.8yellow);
draw(arc(c,K[0],J[1]),2mm+0.8red);
/*<asyxml><view file="modules/geometry.asy" type="arc" signature="arc(explicit arc,abscissa,abscissa)"/></asyxml>*/
draw(arc(c,relabscissa(c,J[1]),relabscissa(1)),2mm+0.8green);
draw(arc(c,relabscissa(0),relabscissa(c,J[0])),2mm+0.8blue);

dot("$J_0$",J[0],2N);
dot("$J_1$",J[1],N+2W);
dot("$K_0$",K[0],2N);

draw(c, 1mm+white);
geometry-fig101
Show geometry/fig1010.asy on Github.
Generated with Asymptote 3.00-0.
Categories : Examples 2D | Geometry.asy
Tags : #Geometry | #Arc | #Circle | #Intersection | #Line | #Coords system
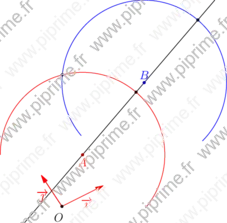
import geometry;
size(8cm,0);

currentcoordsys=cartesiansystem((1,2),i=(1,0.5),j=(-0.5,.75));
show(currentcoordsys, xpen=invisible);

real R=2;

point A=(1,1);
dot("$A$", A, S, red);
point B=A+(2,1);
dot("$B$", B, N, blue);

arc a=arc(circle(A,R), -40, 180);
arc b=arc(circle(B,R), -45, 220);
line l=line(A,B);

draw(a,red);
draw(b,blue);
draw(l);

/*<asyxml><view file="modules/geometry.asy" type="point[]" signature="intersectionpoints(arc,arc)"/></asyxml>*/
point[] inter=intersectionpoints(a,b);
dot(inter);

/*<asyxml><view file="modules/geometry.asy" type="point[]" signature="intersectionpoints(line,arc)"/></asyxml>*/
point[] inter=intersectionpoints(l,a);
dot(inter);

point[] inter=intersectionpoints(l,b);
dot(inter);
geometry-fig102
Show geometry/fig1020.asy on Github.
Generated with Asymptote 3.00-0.
Categories : Examples 2D | Geometry.asy
Tags : #Geometry | #Arc | #Ellipse | #Intersection | #Line | #Coords system
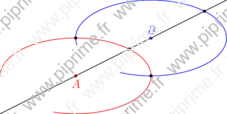
import geometry;
size(8cm,0);

// currentcoordsys=cartesiansystem((1,2),i=(1,0.5),j=(-0.5,.75));
// show(currentcoordsys, xpen=invisible);

real R=2;

point A=(1,1);
dot("$A$", A, S, red);
point B=A+(2,1);
dot("$B$", B, N, blue);

arc a=arc(ellipse(A,R,R/2), -40, 180);
arc b=arc(ellipse(B,R,R/2), -45, 220);

line l=line(A,B);

draw(a,red);
draw(b,blue);
draw(l);

/*<asyxml><view file="modules/geometry.asy" type="point[]" signature="intersectionpoints(arc,arc)"/></asyxml>*/
point[] inter=intersectionpoints(a,b);
dot(inter);

/*<asyxml><view file="modules/geometry.asy" type="point[]" signature="intersectionpoints(line,arc)"/></asyxml>*/
point[] inter=intersectionpoints(l,a);
dot(inter);

point[] inter=intersectionpoints(l,b);
dot(inter);
geometry-fig103
Show geometry/fig1030.asy on Github.
Generated with Asymptote 3.00-0.
Categories : Examples 2D | Geometry.asy
Tags : #Geometry | #Arc | #Circle | #Intersection | #Line | #Coords system | #Tangent
import geometry;
size(8cm,0);

currentcoordsys=cartesiansystem((1,2),i=(1,0.5),j=(-0.5,.75));
show(currentcoordsys, xpen=invisible);

real R=2;

point A=(1,1.5);
dot("$A$",A,S,red);
point B=A+(2,1);
dot("$B$",B,S,blue);

arc a=arc(circle(A,R),-40,180);
arc b=arc(circle(B,R),-45,220);

draw(a,red);
draw(b,blue);

point M=intersectionpoints(a,b)[0];
dot(M);

/*<asyxml><view file="modules/geometry.asy" type="line" signature="tangent(explicit arc,point)"/></asyxml>*/
draw(tangent(a,M), grey);
draw(tangent(b,M), grey);

/*<asyxml><view file="modules/geometry.asy" type="line" signature="tangent(explicit arc,abscissa)"/></asyxml>*/
draw(tangent(a,angabscissa(45)), grey);
geometry-fig104
Show geometry/fig1040.asy on Github.
Generated with Asymptote 3.00-0.
Categories : Examples 2D | Geometry.asy
Tags : #Geometry | #Arc | #Ellipse | #Intersection | #Line | #Coords system | #Tangent
import geometry;
size(10cm,0);

// currentcoordsys=cartesiansystem((1,2),i=(1,0.5),j=(-0.5,.75));
// show(currentcoordsys, xpen=invisible);

real R=2;

point A=(1,1.5);
dot("$A$",A,S,red);
point B=A+(2.5,1);
dot("$B$",B,E,blue);

arc a=arc(ellipse(A,R,R/2,30),-40,180);
// ellispenodesnumberfactor=400;
arc b=arc(ellipse(B,2R,R/2,-10),-30,180);

draw(a,red);
draw(b,blue);

point M=intersectionpoints(a,b)[0];
dot(M);

/*<asyxml><view file="modules/geometry.asy" type="line" signature="tangent(explicit arc,point)"/></asyxml>*/
draw(tangent(a,M), grey);
draw(tangent(b,M), grey);

/*<asyxml><view file="modules/geometry.asy" type="line" signature="tangent(explicit arc,abscissa)"/></asyxml>*/
draw(tangent(a,angabscissa(45)), grey);
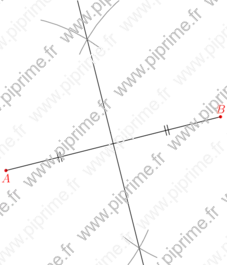
geometry-fig105
Show geometry/fig1050.asy on Github.
Generated with Asymptote 3.00-0.
Categories : Examples 2D | Geometry.asy
Tags : #Geometry | #Segment | #Intersection | #Line | #Markers | #Point
import geometry;
size(8cm,0);

// currentcoordsys=cartesiansystem((1,2),i=(1,0.5),j=(-0.5,.75));
// show(currentcoordsys, xpen=invisible);

point A=(0.25,0.25);
point B=A+(1,0.25);
dot("$A$",A,S,red);
dot("$B$",B,N,red);

segment s=segment(A,B);
line bis=bisector(s);

draw(s,StickIntervalMarker(2,2));
draw(bis);

/*<asyxml><view file="modules/geometry.asy" type="path" signature="compassmark(pair,pair,real,real)"/></asyxml>*/
draw(compassmark(A, point(bis,0.75), position=0.25,angle=25), grey);
draw(compassmark(B, point(bis,0.75), position=0.75,angle=25), grey);

/*<asyxml><view file="modules/geometry.asy" type="point" signature="point(line,real)"/></asyxml>*/
draw(compassmark(A, point(bis,0.25), position=0.5,angle=15), grey);
draw(compassmark(B, point(bis,0.25), position=0.5,angle=15), grey);
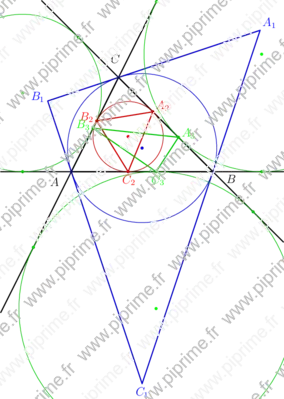
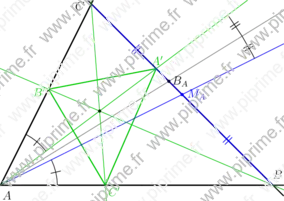
geometry-fig111
Show geometry/fig1110.asy on Github.
Generated with Asymptote 3.00-0.
Categories : Examples 2D | Geometry.asy
Tags : #Geometry | #Triangle | #Circle | #Tangent | #Line | #Label | #Point
import geometry;
size(10cm,0);

// currentcoordsys=cartesiansystem((2,1),i=(1,0.5),j=(-0.25,0.75));
// show(currentcoordsys);

triangle t=triangle((-1,0), (2,0), (0,2));

/*<asyxml><view file="modules/geometry.asy" type="void" signature="drawline(picture,triangle,pen)"/></asyxml>*/
drawline(t, linewidth(bp));
/*<asyxml><view file="modules/geometry.asy" type="void" signature="label(picture,Label,Label,Label,triangle,real,real,pen,filltype)"/></asyxml>*/
label(t,alignFactor=4);

/*<asyxml><view file="modules/geometry.asy" type="circle" signature="circle(triangle)"/></asyxml>*/
circle cc=circle(t);
draw(cc, 0.8blue);
dot(cc.C, blue);
/*<asyxml><view file="modules/geometry.asy" type="triangle" signature="tangential(triangle)"/></asyxml>*/
triangle tgt=tangential(t);
draw(tgt, bp+0.8blue);
label("$A_1$", "$B_1$", "$C_1$", tgt, blue);

/*<asyxml><view file="modules/geometry.asy" type="circle" signature="incircle(triangle)"/></asyxml>*/
circle ic=incircle(t);
draw(ic, 0.8red);
dot(ic.C, red);
triangle intouch=intouch(t);
draw(intouch, bp+0.8red);
label("$A_2$", "$B_2$", "$C_2$", intouch, red);

/*<asyxml><view file="modules/geometry.asy" type="circle" signature="excircle(side,triangle)"/></asyxml>*/
circle ec=excircle(t.AB);
clipdraw(ec, 0.8green);
dot(ec.C, green);

ec=excircle(t.AC);
clipdraw(ec, 0.8green);
dot(ec.C, green);

ec=excircle(t.BC);
clipdraw(ec, 0.8green);
dot(ec.C, green);

/*<asyxml><view file="modules/geometry.asy" type="triangle" signature="extouch(triangle)"/></asyxml>*/
triangle ext=extouch(t);
draw(ext, bp+0.8green);
label("$A_3$", "$B_3$", "$C_3$", ext, green);

/*<asyxml><view file="modules/geometry.asy" type="point" signature="extouch(side)"/></asyxml>*/
dot(extouch(t.AB), 0.8*green);
dot(extouch(t.BC), 0.8*green);
dot(extouch(t.CA), 0.8*green);

/*<asyxml><view file="modules/geometry.asy" type="point" signature="intouch(side)"/></asyxml>*/
dot(intouch(t.AB), 0.8*red);
dot(intouch(t.BC), 0.8*red);
dot(intouch(t.CA), 0.8*red);

// Enlarge the bounding box of the current picture
draw(box((-2.5,-3), (3.5,3.5)), invisible);
geometry-fig112
Show geometry/fig1120.asy on Github.
Generated with Asymptote 3.00-0.
Categories : Examples 2D | Geometry.asy
Tags : #Geometry | #Triangle | #Line | #Label | #Point | #Markers
import geometry;
size(10cm,0);

// currentcoordsys=cartesiansystem((2,1),i=(1,0.5),j=(-0.25,0.75));
// show(currentcoordsys);

triangle t=triangle((-1,0), (2,0), (0,2));

drawline(t, linewidth(bp));
label(t,alignFactor=2, alignAngle=90);

/*<asyxml><view file="modules/geometry.asy" type="triangle" signature="symmedial(triangle)"/></asyxml>*/
triangle st=symmedial(t);
draw(st, bp+0.8green);
label("$A'$", "$B'$", "$C'$", st, alignAngle=45, 0.8green);

/*<asyxml><view file="modules/geometry.asy" type="line" signature="median(vertex)"/></asyxml>*/
line mA=median(t.VA);
draw(mA, blue);
dot("$M_A$",midpoint(t.BC), 1.5E, blue);
draw(segment(t.BC), bp+blue, StickIntervalMarker(2,2,blue));

/*<asyxml><view file="modules/geometry.asy" type="line" signature="bisector(vertex,real)"/></asyxml>*/
line bA=bisector(t.VA);
draw(bA, grey);
/*<asyxml><view file="modules/geometry.asy" type="point" signature="bisectorpoint(side)"/></asyxml>*/
dot("$B_A$", bisectorpoint(t.BC));

/*<asyxml><view file="modules/geometry.asy" type="line" signature="symmedian(vertex)"/></asyxml>*/
line sA=symmedian(t.VA);
draw(sA, 0.8*green);

draw(symmedian(t.VB), 0.8*green);
draw(symmedian(t.VC), 0.8*green);

/*<asyxml><view file="modules/geometry.asy" type="point" signature="symmedian(triangle)"/></asyxml>*/
point sP=symmedian(t);
dot(sP);

markangle(sA, (line) t.AC, radius=2cm, StickIntervalMarker(1,1));
markangle((line) t.AB, mA, radius=2cm, StickIntervalMarker(1,1));
markangle(mA, sA, radius=10cm, StickIntervalMarker(2,2));
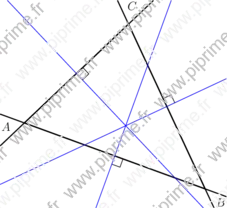
geometry-fig113
Show geometry/fig1130.asy on Github.
Generated with Asymptote 3.00-0.
Categories : Examples 2D | Geometry.asy
Tags : #Geometry | #Triangle | #Line | #Markers | #Transform/scale/shift/rotate | #Perpendicular
import geometry;
size(8cm,0);

// currentcoordsys=cartesiansystem((2,1),i=(1,0.5),j=(-0.25,0.75));
// show(currentcoordsys);

triangle t=rotate(-20)*triangle((-1,0), (2,0), (0,2));
drawline(t, linewidth(bp));
label(t,alignFactor=4);

line bab=bisector(t.AB);
draw(bab, blue);
perpendicularmark(t.AB,bab,quarter=4);

line bac=bisector(t.AC);
draw(bac, blue);
perpendicularmark(t.AC,bac,quarter=4);

line bbc=bisector(t.BC);
draw(bbc, blue);
perpendicularmark(t.BC,bbc,quarter=4);
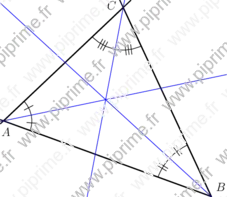
geometry-fig114
Show geometry/fig1140.asy on Github.
Generated with Asymptote 3.00-0.
Categories : Examples 2D | Geometry.asy
Tags : #Geometry | #Triangle | #Line | #Point | #Markers
import geometry;
size(8cm,0);

// currentcoordsys=cartesiansystem((2,1),i=(1,0.5),j=(-0.25,0.75));
// show(currentcoordsys);

triangle t=rotate(-20)*triangle((-1,0), (2,0), (0,2));
drawline(t, linewidth(bp));
label(t, alignAngle=90, alignFactor=2);

/*<asyxml><view file="modules/geometry.asy" type="point" signature="incenter(triangle)"/></asyxml>*/
point incenter=incenter(t);

line ba=bisector(t.VA);
draw(ba, blue);
markangle((line) t.AB, (line) t.AC,StickIntervalMarker(i=2,n=1));

line bb=bisector(t.VB);
draw(bb, blue);
markangle((line) t.BC, (line) t.BA, radius=2cm, StickIntervalMarker(i=2,n=2));

line bc=bisector(t.VC);
draw(bc, blue);
markangle((line) t.CA, (line) t.CB, radius=1.5cm, StickIntervalMarker(i=2,n=3));
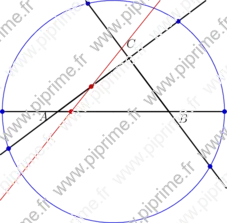
geometry-fig115
Show geometry/fig1150.asy on Github.
Generated with Asymptote 3.00-0.
Categories : Examples 2D | Geometry.asy
Tags : #Geometry | #Triangle | #Line | #Point | #Intersection
import geometry;
size(8cm);

// currentcoordsys=cartesiansystem((2,1),i=(1,0.5),j=(-0.25,.75));
// show(currentcoordsys);

dotfactor *=1.5;
triangle t=triangleabc(3,4,5);
drawline(t, linewidth(bp));
label(t, alignFactor=3);

line l=line((-1,-2), (1,0.5));
draw(l, 0.8*red);
/*<asyxml><view file="modules/geometry.asy" type="point[]" signature="intersectionpoints(triangle,line,bool)"/></asyxml>*/
dot(intersectionpoints(t,l), 0.8*red);

circle C=2*circle(t);
draw(C, 0.8*blue);
/*<asyxml><view file="modules/geometry.asy" type="point[]" signature="intersectionpoints(triangle,conic,bool)"/></asyxml>*/
dot(intersectionpoints(t,C, true), 0.8*blue);
geometry-fig116

Show geometry/fig1160.asy on Github.
Generated with Asymptote 3.00-0.
Categories : Examples 2D | Geometry.asy
Tags : #Geometry | #Triangle | #Line | #Point/Dot | #Distance | #Shipout | #Bbox
unitsize(1cm);
import geometry;

point pA = (0,0);
point pB = (5,0);
point pC = (5,5);

dot(pA^^pB^^pC);
draw(pA--pB--pC--cycle);

distance(Label("$x \; \mathrm{cm}$",align=S),pA,pB,3mm);
distance(Label("$y \; \mathrm{cm}$",align=E),pB,pC,3mm);
distance(Label("$z \; \mathrm{cm}$",align=I*dir(pA--pC)),pA,pC,-3mm);

shipout(bbox(xmargin=1mm,invisible));
geometry-fig117
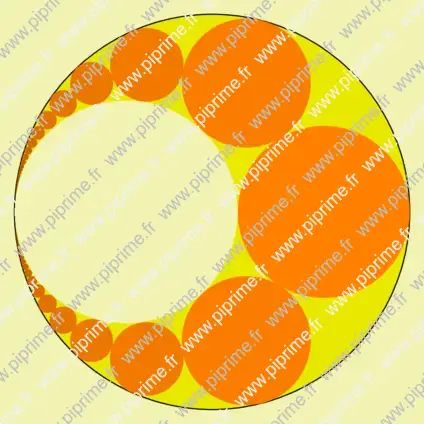
Show geometry/fig1170.asy on Github.
Generated with Asymptote 3.00-0.
Categories : Examples 2D | Geometry.asy
Tags : #Geometry | #Inversion | #Shipout | #Bbox | #Circle | #Line
import geometry; size(15cm);

inversion inv=inversion(1,(-3.6,0));
path g1=inv*line((-1,0),(-1,1)),
g2=inv*line((1,0),(1,1));
fill(g1,0.91*yellow); draw(g1,linewidth(bp));
unfill(g2); //draw(g2,linewidth(bp));

int n=40;
for (int i=-n; i <= n; ++i) {
  path g=inv*circle((point) (0,2*i),1);
  fill(g,(1-abs(i)/n)*orange);
  // draw(g,bp+0.8*orange); //draw(g,black);
}
shipout(bbox(5mm,Fill(rgb(0.95,0.95,0.7))));