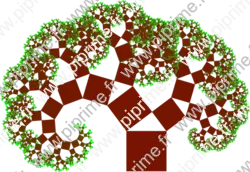
Asymptote Gallery Tagged by “Transform/scale/shift/rotate/projection” #62
fractales-fig001
Show fractales/fig0010.asy on Github.
Generated with Asymptote 3.00-0.
Categories : Surveys | Fractals
Tags : #Function (creating) | #Fractals | #Recursion | #Transform | #Picture
// From documentation of Asymptote
size(250);

real a=3;
real b=4;
real c=hypot(a,b);

transform ta=shift(c,c)*rotate(-aCos(a/c))*scale(a/c)*shift(-c);
transform tb=shift(0,c)*rotate(aCos(b/c))*scale(b/c);

picture Pythagorean(int n) {
  picture pic;
  fill(pic,scale(c)*unitsquare,1/(n+1)*green+n/(n+1)*brown);
  if(n == 0) return pic;
  picture branch=Pythagorean(--n);
  add(pic,ta*branch);
  add(pic,tb*branch);
  return pic;
}

add(Pythagorean(12));
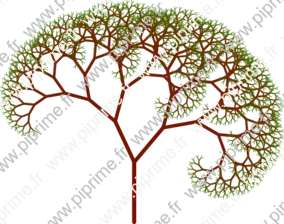
fractales-fig002
Show fractales/fig0020.asy on Github.
Generated with Asymptote 3.00-0.
Categories : Surveys | Fractals
Tags : #Fractals | #Recursion | #Transform | #Function (creating)
size(10cm,0);

transform scale(pair center, real k) {
  return shift(center)*scale(k)*shift(-center);
}

path trk=(0,0)--(0,1);

void tree(path p, int n, real a=30, real b=40, real r=.75) {
  if (n!=0) {
    pair h=point(p,length(p));
    transform tb=rotate(180-b,h)*scale(h,r);
    transform ta=rotate(-180+a,h)*scale(h,r);
    draw(p,n/3+1/(n+1)*green+n/(n+1)*brown);
    tree(tb*reverse(p),n-1,a,b,r);
    tree(ta*reverse(p),n-1,a,b,r);
  }
}

tree(trk,12,a=25,b=40,r=.75);
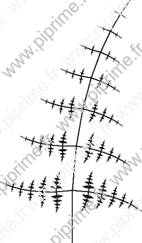
fractales-fig003
Show fractales/fig0030.asy on Github.
Generated with Asymptote 3.00-0.
Categories : Surveys | Fractals
Tags : #Fractals | #Recursion | #Transform | #Picture | #Function (creating)
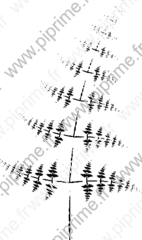
// Barnsley's fern
// Fougère de Barnsley

size(5cm,0);

real ab=85, ac=-5;
real rc=.85, rb=-.31;
path trk=(0,0)--(0,1);

transform ta=shift(0,1)*rotate(ab)*scale(rb);
transform tb=shift(0,1)*rotate(-ab)*scale(rb);
transform tc=shift(0,1)*rotate(ac)*scale(rc);

picture fern(int n) {
  picture opic;
  draw(opic,trk^^ta*trk^^tb*trk^^tc*trk);
  if (n==0) return opic;
  picture branch=fern(n-1);
  add(opic,branch);
  add(opic,ta*branch);
  add(opic,tb*branch);
  add(opic,tc*branch);
  return opic;
}

add(fern(6));
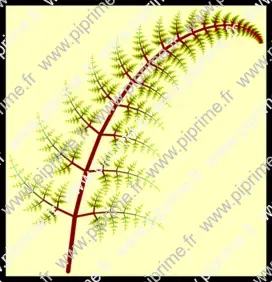
fractales-fig004
Show fractales/fig0040.asy on Github.
Generated with Asymptote 3.00-0.
Categories : Surveys | Fractals
Tags : #Fractals | #Transform | #Picture
// Barnsley's fern
// Fougère de Barnsley
size(10cm,0);

real ab=72, ac=-7;
real rc=0.85, rb=0.35;
path trk=(0,0)--(0,1);

transform ta=shift(0,1)*rotate(ab)*scale(rb);
transform tb=shift(0,1)*rotate(-ab)*scale(rb);
transform tc=shift(0,1)*rotate(ac)*scale(rc);
transform td=shift(0,1)*rotate((ab+ac)/2)*scale(rb);
transform te=shift(0,1)*rotate(-(ab+ac)/2)*scale(rb);

picture pic;
draw(pic,trk,red+.8green);

//Construct a fern branch as atractor
int nbit=7;
for(int i=1; i<=nbit; ++i) {
  picture pict;
  add(pict,ta*pic);
  add(pict,tb*pic);
  add(pict,tc*pic);
  draw(pict,(0,0)--(0,1), (2*(i/nbit)^2)*bp+((1-i/nbit)*green+i/nbit*brown));
  pic=pict;
}

//Use the fern branch to construct... a fern branch
picture pict;
add(pict,ta*pic);
add(pict,tb*pic);

pair x=(0,1);
nbit=23;
for(int i=1; i<=nbit; ++i) {
  add(shift(x)*rotate(ac*i)*scale(rc^i)*pict);
  draw(tc^i*((0,0)--(0,1)), 2*(1.5-i/nbit)^2*bp+brown);
  x=tc*x;
}

shipout(bbox(3mm, 2mm+black, FillDraw(paleyellow)));
fractales-fig005
Show fractales/fig0050.asy on Github.
Generated with Asymptote 3.00-0.
Categories : Surveys | Fractals
Tags : #Fractals | #Transform | #Picture
// Barnsley's fern
// Fougère de Barnsley
size(5cm,0);

real ab=85, ac=-5;
real rc=0.8, rb=0.3;
path trk=(0,0)--(0,1);

transform [] t;
t[1] =shift(0,1)*rotate(ab)*scale(rb);
t[2] =shift(0,1)*rotate(-ab)*scale(rb);
t[3] =shift(0,1)*rotate(ac)*scale(rc);
real sum=0;

for(int i=0; i<100; ++i) sum+=(rc*cos(ac*pi/180))^i;
t[4] =xscale(0.01)*yscale(1/sum);

picture pic;
draw(pic,trk);
pair pt=(0,0);

for(int i=0; i < 1000; ++i) {
  pt=t[ 1+floor((3.0*rand()/randMax)) ]*pt;
}

int nbt;
for(int i=0; i < 200000; ++i) {
  nbt=1+floor((4.0*rand()/randMax));
  pt=t[nbt]*pt;
  draw(pt);
}
fractales-fig009
Show fractales/fig0090.asy on Github.
Generated with Asymptote 3.00-0.
Categories : Surveys | Fractals
Tags : #Fractals | #Recursion | #Transform | #Picture | #Array
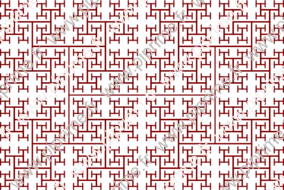
size(10cm,0);

real a=-1.5, b=2a/3;

picture H(pen p=currentpen) {
  picture H;
  draw(H,(-a,0)--(a,0)^^(-a,-b)--(-a,b)^^(a,-b)--(a,b),p);
  return H;
}

transform sc=scale(0.5);
transform[] t={identity(),
               shift(-a,b)*sc, shift(-a,-b)*sc,
               shift(a,b)*sc,  shift(a,-b)*sc};

picture Hfractal(int n, pen p=currentpen)
{
  picture pic;
  if(n == 0) return H(p);
  picture Ht=Hfractal(n-1,p);
  for (int i=0; i < 5; ++i) add(pic,t[i]*Ht);
  return pic;
}

add(Hfractal(4, bp+0.5*red));
fractales-fig010
Show fractales/fig0100.asy on Github.
Generated with Asymptote 3.00-0.
Categories : Surveys | Fractals
Tags : #Fractals | #Recursion | #Transform | #Picture | #Array
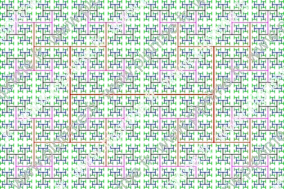
size(10cm,0);

real a=-1.5, b=2a/3;

path[] H=(-a,0)--(a,0)^^(-a,-b)--(-a,b)^^(a,-b)--(a,b);

transform sc=scale(0.5);
transform[] t={shift(-a,b)*sc, shift(-a,-b)*sc,
               shift(a,b)*sc,  shift(a,-b)*sc};

void Hfractal(path[] g, int n, pen[] p=new pen[]{currentpen})
{
  p.cyclic=true;
  if(n == 0) draw(H,p[0]); else {
    for (int i=0; i < 4; ++i) {
      draw(t[i]*g,p[n]);
      Hfractal(t[i]*g,n-1,p);
    }
  }
}

Hfractal(H, 5, new pen[] {0.8*red, 0.8*green, 0.8*blue, black, blue+red});
generalities-fig020

Show generalities/fig0200.asy on Github.
Generated with Asymptote 3.00-0.
Categories : Examples 2D | Generalities
Tags : #Basis | #Point/Dot | #Line type | #Transform/scale/shift/rotate | #Unitsize | #Path
unitsize(3cm);

pair A=(0,0), B=(1,0), C=(0,1);
path trig;
trig=A--B--C--cycle;
draw(trig);
dot(trig,linewidth(4bp));
dot(shift(3,0)*trig,red+4bp);
generalities-fig057
Show generalities/fig0570.asy on Github.
Generated with Asymptote 3.00-0.
Categories : Examples 2D | Generalities
Tags : #Basis | #Fill/Unfill | #Shading | #Transform/scale/shift/rotate | #Direction
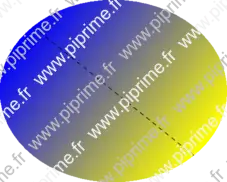
size(8cm,0);

transform t=xscale(1.25);
pen p1=blue, p2=yellow;
pair pa=t*dir(135), pb=t*dir(-45);

axialshade(t*unitcircle,p1,pa,p2,pb);
draw(pa--pb, dashed);
generalities-fig058
Show generalities/fig0580.asy on Github.
Generated with Asymptote 3.00-0.
Categories : Examples 2D | Generalities
Tags : #Fill/Unfill | #Shading | #Arc | #Loop/for/while | #Transform/scale/shift/rotate
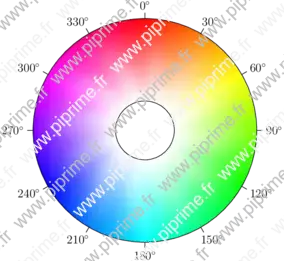
// Author: John Bowman
size(10cm,0);

real r=1;
real R=3.8;

int step=30;
path p=arc(0,r,0,step);
path P=arc(0,R,step,0);
for(int h=0; h < 360; h += step) {
  transform t=rotate(90-h);
  tensorshade(t*p--t*P--cycle,
              new pen[] {white,white,hsv(h-step,1,1),hsv(h,1,1)});
}

for(int h=0; h < 360; h += 30) {
  pair v=R*dir(90-h);
  draw(Label(string(h)+"$^\circ$",EndPoint),(v--1.05v));
}

draw(circle(0,r));
draw(circle(0,R));
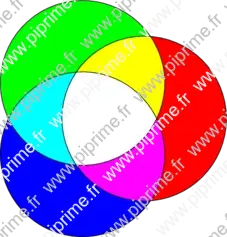
generalities-fig062

Show generalities/fig0620.asy on Github.
Generated with Asymptote 3.00-0.
Categories : Examples 2D | Generalities
Tags : #Basis | #Opacity | #Fill/Unfill | #Circle | #Transform/scale/shift/rotate
size(10cm, 0);

path cle=unitcircle;

draw((-1.5, 0)--(2.5, 0), linewidth(10mm));
filldraw(cle, red+opacity(.5));
filldraw(shift((1, 0))*cle, blue+opacity(.5));

shipout(format="pdf");
generalities-fig076

Show generalities/fig0760.asy on Github.
Generated with Asymptote 3.00-0.
Categories : Examples 2D | Generalities
Tags : #Basis | #Label | #Transform/scale/shift/rotate | #Fill/Unfill
frame f;
label(f,"\textbf{Hello}",yellow,Fill(black));
add(scale(5)*rotate(45)*f);
generalities-fig077

Show generalities/fig0770.asy on Github.
Generated with Asymptote 3.00-0.
Categories : Examples 2D | Generalities
Tags : #Basis | #Label | #Transform/scale/shift/rotate | #Fill/Unfill
frame f;
filldraw(scale(5cm)*unitsquare, black);
label(f,"Hello", 0.8*red, Fill(white));
add(rotate(45) * scale(5) * f, (2.5cm,2.5cm));
generalities-fig082
Show generalities/fig0820.asy on Github.
Generated with Asymptote 3.00-0.
Categories : Examples 2D | Generalities
Tags : #Basis | #Align | #Basealign | #Transform/scale/shift/rotate | #Fontsize
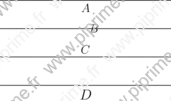
size(0,0);
path line=(0,0)--(6cm,0);
transform T=shift(0,-cm);

draw("$A$",line);
draw("$B$",T*line,dir(0));
draw("$C$",T^2*line,N);
draw(Label("$D$",fontsize(14pt)),T^3*line);
generalities-fig083
Show generalities/fig0830.asy on Github.
Generated with Asymptote 3.00-0.
Categories : Examples 2D | Generalities
Tags : #Basis | #Align | #Basealign | #Fill/Unfill | #Position | #Transform/scale/shift/rotate
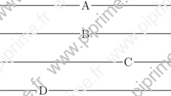
size(0,0);
path line=(0,0)--(6cm,0);
transform T=shift(0,-cm);

draw(Label("A",align=Center,filltype=UnFill), line);
draw(Label("B",UnFill), T*line, Center);
draw(Label("C",align=Center,position=Relative(.75),UnFill), T^2*line);
draw(Label("D",position=Relative(.25),UnFill), align=Center, T^3*line);
generalities-fig084
![]()
Show generalities/fig0840.asy on Github.
Generated with Asymptote 3.00-0.
Categories : Examples 2D | Generalities
Tags : #Basis | #Align | #Basealign | #Transform/scale/shift/rotate | #Shipout
pair c=0;
label("abc xyz ijk",c,Align,basealign);
label("abc xyz ijk",c,Align,red);
draw(c--(c+(2cm,0))); // This is the baseline.

shipout((scale(3)*currentpicture.fit()));
generalities-fig088

Show generalities/fig0880.asy on Github.
Generated with Asymptote 3.00-0.
Categories : Examples 2D | Generalities
Tags : #Basis | #Defaultpen | #Point/Dot | #Transform/scale/shift/rotate | #Arrows/Bars | #Margin
size(0,0);
pair A=(0,0), B=(4cm,0);
path line=A--B;
transform TD=shift(0,-cm);
transform TR=shift(2.5cm,0);

defaultpen(linewidth(3bp));

draw("$AB$",line,.8red,Arrows(3mm));
draw("$A$",A,N); draw("$B$",B,N);

draw("$AB$",TD*line,.8red,Arrows(3mm),PenMargins);
draw("$A$",TD*A,N); draw("$B$",TD*B,N);

draw("$AB$",TD^2*line,.8red,Arrows(3mm),DotMargins);
dot("$A$",TD^2*A,dotfactor*NW); dot("$B$",TD^2*B,dotfactor*NE);

margin BigMargins=Margin(2,2);
draw("$AB$",TD^3*line,.8red,Arrows(3mm),BigMargins);
draw("$A$",TD^3*A,N); draw("$B$",TD^3*B,N);
generalities-fig095
Show generalities/fig0950.asy on Github.
Generated with Asymptote 3.00-0.
Categories : Examples 2D | Generalities
Tags : #Basis | #Size | #Path | #Transform/scale/shift/rotate
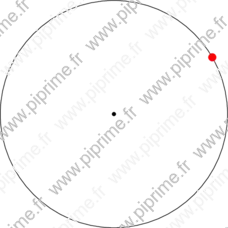
size(0,0);

real R=4cm;

draw(scale(R)*unitcircle);
dot((0,0),linewidth(4bp));
dot((R*cos(pi/6),R*sin(pi/6)),red+8bp);
generalities-fig101
Show generalities/fig1010.asy on Github.
Generated with Asymptote 3.00-0.
Categories : Examples 2D | Generalities
Tags : #Basis | #Circle | #Picture | #Transform/scale/shift/rotate | #Array
size(8cm,0);

picture pic;
pen [] P={.8red,.7green,blue+.5grey,yellow+.6grey};

fill(scale(10)*unitcircle,.2blue);

for (int i = 0; i <= 3; ++i)
  draw(pic, arc((0,0),10,i*90,(i+1)*90), P[i]);

for (real i = 1; i <= 10; i+=.05)
  add(rotate(90*i)*scale(1/i)*pic);
generalities-fig109
Show generalities/fig1100.asy on Github.
Generated with Asymptote 3.00-0.
Categories : Examples 2D | Generalities
Tags : #Basis | #Transform/scale/shift/rotate
size(0,0);
pair A, B, C;
A=(0,0); B=(4cm,0); C=(0,4cm);

draw(A--B--C--cycle);
filldraw(shift(A)*scale(6bp)*unitcircle, white);
filldraw(shift(B)*scale(6bp)*unitcircle, white);
filldraw(shift(C)*scale(6bp)*unitcircle, white);
generalities-fig135
Show generalities/fig1360.asy on Github.
Generated with Asymptote 3.00-0.
Categories : Examples 2D | Generalities
Tags : #Basis | #Path | #Circle | #Point/Dot | #Transform/scale/shift/rotate
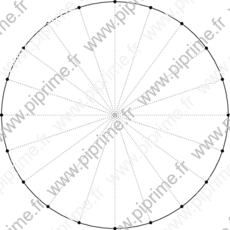
size(0,0);

path cle=scale(4cm)*unitcircle;

draw(cle);

for(real i=0; i<=length(cle); i+=.2)
  {
    dot(point(cle,i));
    draw((0,0)--point(cle,i),dotted);
  }
generalities-fig145
Show generalities/fig1460.asy on Github.
Generated with Asymptote 3.00-0.
Categories : Examples 2D | Generalities
Tags : #Basis | #Transform/scale/shift/rotate | #Point/Dot | #Label | #Position
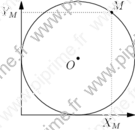
size(0,0);

pair O=(2cm,2cm);
path cle=shift(O)*scale(2cm)*unitcircle;
pair M=point(cle,.6);

dot("$O$",O,SW);
dot("$M$",M,unit(M-O));

draw(cle);
draw((0,0)--(0,4cm),Arrow);
draw((0,0)--(4cm,0),Arrow);

draw(Label("$X_M$",position=EndPoint),M--(xpart(M),0),dotted);
draw(Label("$Y_M$",position=EndPoint),M--(0,ypart(M)),dotted);
generalities-fig146
Show generalities/fig1470.asy on Github.
Generated with Asymptote 3.00-0.
Categories : Examples 2D | Generalities
Tags : #Basis | #Transform/scale/shift/rotate | #Circle
size(0,0);

path p= scale(3cm)*unitcircle;

draw(p,red+1mm);
draw(shift(1mm,2mm)*p);
draw(shift(2*(1mm,2mm))*p);
draw(shift(3*(1mm,2mm))*p);
draw(shift(4*(1mm,2mm))*p);
draw(shift(5*(1mm,2mm))*p);
generalities-fig147
Show generalities/fig1480.asy on Github.
Generated with Asymptote 3.00-0.
Categories : Examples 2D | Generalities
Tags : #Basis | #Path | #Transform/scale/shift/rotate
size(0,0);

path p= (5mm,-5mm){right} .. (4cm,0);

for(int i=10; i<360; i+=10)
  draw(rotate(i)*p);

draw(p,red+1mm);
generalities-fig148
Show generalities/fig1490.asy on Github.
Generated with Asymptote 3.00-0.
Categories : Examples 2D | Generalities
Tags : #Basis | #Path | #Transform/scale/shift/rotate
size(6cm,0);

path p= (1,-1){right} .. (4,0);
pair O=(3,.25);

for(int i=10; i<360; i+=10)
  draw(rotate(i,O)*p);

dot(O,blue);
draw(p,red+1mm);
generalities-fig150
Show generalities/fig1510.asy on Github.
Generated with Asymptote 3.00-0.
Categories : Examples 2D | Generalities
Tags : #Basis | #Path | #Transform/scale/shift/rotate
size(6cm,0);

path cle=unitcircle;

draw(cle,red);
draw(xscale(2)*cle);
draw(yscale(2)*cle);
draw(scale(2)*cle,blue);
generalities-fig151
Show generalities/fig1520.asy on Github.
Generated with Asymptote 3.00-0.
Categories : Examples 2D | Generalities
Tags : #Basis | #Path | #Transform/scale/shift/rotate | #Circle
size(8cm,0);

transform scale(pair center, real k)
{
  return shift(center)*scale(k)*shift(-center);
}

path cle=unitcircle;
pair A=(4,0);
draw(cle);

draw(scale(A,.5)*cle,red);
draw(scale(A,-.75)*cle,blue);

for (real t; t<length(cle); t+=1)
  draw(point(cle,t)--point(scale(A,-.75)*cle,t),dotted);

dot("$A$",A,N);
generalities-fig152
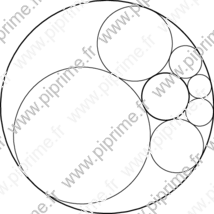
Show generalities/fig1530.asy on Github.
Generated with Asymptote 3.00-0.
Categories : Examples 2D | Generalities
Tags : #Basis | #Path | #Transform/scale/shift/rotate | #Circle | #Function creation
size(0,0);

pair inversion(pair O, real k, pair M)
{
  return (O + k*unit(M-O)/abs(M-O));
}

guide inversion(pair O, real k, path M)
{
  guide opath=inversion(O,k,point(M,0));
  for (real i=0; i<=length(M); i+=length(M)/100)
    opath = opath .. inversion(O,k,point(M,i));
  return opath .. cycle;
}

real u=10cm;
path [] p;
path A = scale(u)*unitcircle;
path B = scale(3)*A;
pair z = rotate(10)*(5u,0);


draw(inversion( z, 2*u^2, A ),linewidth(1pt));
draw(inversion( z, 2*u^2, B ),linewidth(1pt));

p[0] = shift(2u,0)*scale(u)*unitcircle;

for (int i=0; i<=5; ++i)
  {
    if (i!=0) p[i] = rotate(360/6)*p[i-1];
    draw(inversion( z, 2 (u^2), p[i] ));
  }
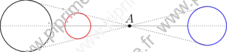
generalities-fig187
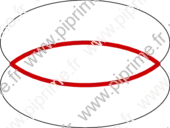
Show generalities/fig1890.asy on Github.
Generated with Asymptote 3.00-0.
Categories : Examples 2D | Generalities
Tags : #Basis | #Path | #Intersection | #Buildcycle | #Transform/scale/shift/rotate | #Circle
size(6cm,0);
path [] c;

c[1] = xscale(2)*unitcircle;
c[2] = shift((0,1))*c[1];
draw(c[1]^^c[2]);
draw(buildcycle(c[1],c[2]), .8red+4bp);
generalities-fig188
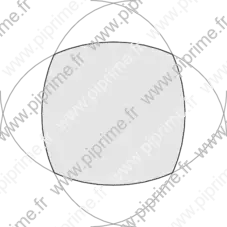
Show generalities/fig1900.asy on Github.
Generated with Asymptote 3.00-0.
Categories : Examples 2D | Generalities
Tags : #Basis | #Path | #Intersection | #Buildcycle | #Transform/scale/shift/rotate | #Array
size(8cm,0);

path a,b,c,d;
a = (-1,-.2){up} .. tension 1.2 .. (1,-.2){down};
transform r90=rotate(90);
b = r90*a;
c = r90*b;
d = r90*c;
path bound=buildcycle(a,b,c,d);
fill(bound, lightgrey);
draw(a^^b^^c^^d,grey);
draw(bound);
generalities-fig189
Show generalities/fig1910.asy on Github.
Generated with Asymptote 3.00-0.
Categories : Examples 2D | Generalities
Tags : #Basis | #Path | #Intersection | #Buildcycle | #Transform/scale/shift/rotate | #Circle | #Fill/Unfill
size(8cm,0);

path a,b,c;
a = shift(1,0)*scale(2)*unitcircle;
b = rotate(120)*a;
c = rotate(120)*b;

fill(a, red);
fill(b, green);
fill(c, blue);
fill(buildcycle(a,b), red + green);
fill(buildcycle(b,c), green + blue);
fill(buildcycle(c,a), blue + red);
fill(buildcycle(a,b,c), white);

draw(a^^b^^c);
generalities-fig191
Show generalities/fig1930.asy on Github.
Generated with Asymptote 3.00-0.
Categories : Examples 2D | Generalities
Tags : #Basis | #Path | #Intersection | #Transform/scale/shift/rotate | #Circle
size(0,0);

path pt1=scale(2cm)*unitcircle;
path pt2=scale(1cm)*unitcircle;

filldraw(pt1^^pt2,evenodd+yellow+.9white);
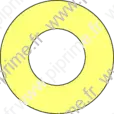
generalities-fig192

Show generalities/fig1940.asy on Github.
Generated with Asymptote 3.00-0.
Categories : Examples 2D | Generalities
Tags : #Basis | #Path | #Intersection | #Transform/scale/shift/rotate | #Circle
size(0,0);

path pt1=scale(2cm)*unitcircle;
path pt2=scale(1cm)*unitcircle;
path pt3=shift(0,.5cm)*pt2;

filldraw(pt1^^pt2^^pt3,evenodd+yellow+.9white);
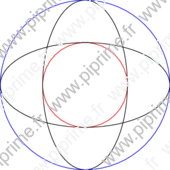
generalities-fig193

Show generalities/fig1950.asy on Github.
Generated with Asymptote 3.00-0.
Categories : Examples 2D | Generalities
Tags : #Basis | #Path | #Intersection | #Transform/scale/shift/rotate | #Circle
size(0,0);

path pt1=scale(2cm)*unitcircle;
path pt2=scale(1cm)*unitcircle;
path pt3=shift(0,1.5cm)*pt2;

filldraw(pt1^^pt2^^pt3,evenodd+yellow+.9white);
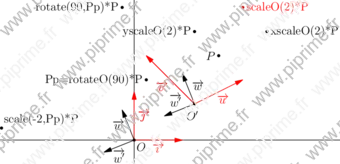
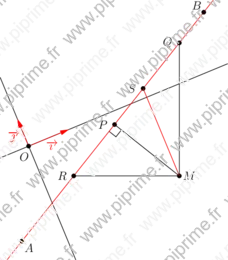
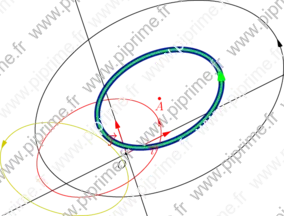
geometry-fig006
Show geometry/fig0060.asy on Github.
Generated with Asymptote 3.00-0.
Categories : Examples 2D | Geometry.asy
Tags : #Geometry | #Coords system | #Point | #Transform/scale/shift/rotate
import geometry;
size(12cm,0);

currentcoordsys=cartesiansystem((1.25,0.75),i=(1,0.5),j=(-1,1));
coordsys Rp=currentcoordsys;
coordsys R=defaultcoordsys;

show(Label("$O$",align=SE), "$\vec{\imath}$", Label("$\vec{\jmath}$",align=E), R);
show("$O'$", "$\vec{u}$", "$\vec{v}$", Rp, xpen=invisible);

vector w=(0.25,0.5);
point P=(1,0.5);

dot("$P$",P,W);
show("$\overrightarrow{w}$", w);

/*<asyxml><view file="modules/geometry.asy" type="transform" signature="rotateO(real)"/></asyxml>*/
point Pp=rotateO(90)*P;

dot("Pp=rotateO(90)*P", Pp, W);

dot("rotate(90,Pp)*P", rotate(90,Pp)*P, W);
/*<asyxml><view file="modules/geometry.asy" type="transform" signature="scale(real,point)"/></asyxml>*/
dot("scale(-2,Pp)*P", scale(-2,Pp)*P, NE);

/*<asyxml><view file="modules/geometry.asy" type="transform" signature="scaleO(real)"/></asyxml>*/
dot("scaleO(2)*P", scaleO(2)*P,red);
/*<asyxml><view file="modules/geometry.asy" type="transform" signature="xscaleO(real)"/></asyxml>*/
dot("xscaleO(2)*P", xscaleO(2)*P);
/*<asyxml><view file="modules/geometry.asy" type="transform" signature="yscaleO(real)"/></asyxml>*/
dot("yscaleO(2)*P", yscaleO(2)*P,W);

vector wp=rotateO(90)*w;

show("$\overrightarrow{w'}$", wp);

draw("$\overrightarrow{w}$", (0,0)--locate(w), W, Arrow);
draw("$\overrightarrow{w'}$", (0,0)--locate(wp), S, Arrow);
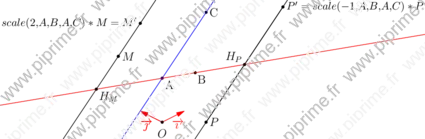
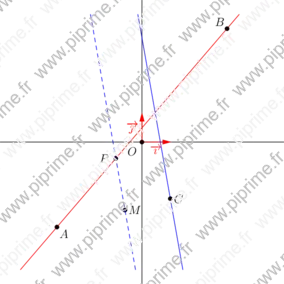
geometry-fig007
Show geometry/fig0070.asy on Github.
Generated with Asymptote 3.00-0.
Categories : Examples 2D | Geometry.asy
Tags : #Geometry | #Coords system | #Point | #Pair | #Transform/scale/shift/rotate
import geometry;
size(15cm);

currentcoordsys=cartesiansystem((0,0),i=(1,0.5),j=(-1,0.5));
coordsys R=currentcoordsys;
show(R, xpen=invisible);

point A=(2,2);
dot("A",A,SE);

point B=(3,1.5);
dot("B",B,SE);

point C=A+(4,2);
dot("C",C);

drawline(A,B,red);
drawline(A,C,blue);

/*<asyxml><view file="modules/geometry.asy" type="transform" signature="scale(real,point,point,point,point,bool)"/></asyxml>*/
transform t=scale(2,A,B,A,C);
/*<asyxml><view file="modules/geometry.asy" type="transform" signature="projection(point,point,point,point,bool)"/></asyxml>*/
transform proj=projection(A,B,A,C);

point M=(2,4);
point Mh=proj*M;
dot("$H_M$",Mh,SE);
dot("$M$",M);
point Mp=t*M;
dot("\small$scale(2,A,B,A,C)*M=M'$",Mp,W);
drawline(M,Mh);

point P=(1,-1);
point Ph=proj*P;
dot("$H_P$",Ph,NW);
drawline(P,Ph);
dot("$P$",P);

transform t=scale(-1,A,B,A,C);
point Pp=t*P;
dot("\small$P'=scale(-1,A,B,A,C)*P$",Pp);
draw(P--Pp);
geometry-fig018
Show geometry/fig0180.asy on Github.
Generated with Asymptote 3.00-0.
Categories : Examples 2D | Geometry.asy
Tags : #Geometry | #Coords system | #Point | #Line | #Parallel | #Perpendicular | #Transform/scale/shift/rotate
unitsize(1cm);
import geometry;
dotfactor*=1.5;

currentcoordsys=cartesiansystem((0,0),i=expi(pi/8)*(1.5,0),j=expi(pi/8)*(0,1));
show(currentcoordsys);

point A=(-1,-3), B=(5,2);
line l1=line(A,B);

draw(l1,red);
dot("$A$",A,SE);
dot("$B$",B,NW);

point M=(3,-3);
dot("$M$",M);

/*<asyxml><view file="modules/geometry.asy" type="transform" signature="projection(line)"/></asyxml>*/
point P=projection(l1)*M;
dot("$P$",P,2W);
draw(M--P);
markrightangle(l1.A,P,M);


/*<asyxml><view file="modules/geometry.asy" type="transform" signature="vprojection(line,bool)"/></asyxml>*/
point Q=vprojection(l1)*M;
dot("$Q$",Q,2W);
draw(M--Q);

/*<asyxml><view file="modules/geometry.asy" type="transform" signature="hprojection(line,bool)"/></asyxml>*/
point R=hprojection(l1)*M;
dot("$R$",R,2W);
draw(M--R);

/*<asyxml><view file="modules/geometry.asy" type="transform" signature="projection(line,line,bool)"/></asyxml>*/
point S=projection(l1,line((0,0),(0,1)))*M;
dot("$S$",S,2W);
draw(M--S,red);

draw(box((-1,-4),(7,5)),invisible);
geometry-fig019
Show geometry/fig0190.asy on Github.
Generated with Asymptote 3.00-0.
Categories : Examples 2D | Geometry.asy
Tags : #Geometry | #Point | #Line | #Parallel | #Transform/scale/shift/rotate
unitsize(1cm);
import geometry;
dotfactor*=1.5;
linemargin=5mm;

// currentcoordsys=cartesiansystem((2,1),i=(1,0.5),j=(-1,1));
show(currentcoordsys);

point A=(-3,-3), B=(3,4), C=(1,-2);

line l1=line(A,B);
draw(l1,red);
dot("$A$",A,SE);
dot("$B$",B,NW);

/*<asyxml><view file="modules/geometry.asy" type="line" signature="line(real,point)"/></asyxml>*/
line l2=line(100,C);
draw(l2,blue);
dot("$C$",C);

point M=relpoint(A--C,0.6);
dot("$M$",M);

/*<asyxml><view file="modules/geometry.asy" type="transform" signature="projection(line,line,bool)"/></asyxml>*/
point P=projection(l1,l2)*M;
dot("$P$",P,2W);
draw(line(M,P),blue+dashed);

draw(box((-5,-5),(5,5)),invisible);
geometry-fig029
Show geometry/fig0290.asy on Github.
Generated with Asymptote 3.00-0.
Categories : Examples 2D | Geometry.asy
Tags : #Geometry | #Coords system | #Transform/scale/shift/rotate | #Ellipse | #Circle
import geometry;
size(8cm,0);

currentcoordsys=cartesiansystem((2,1),i=(1,0.5),j=(-0.25,.75));
show(currentcoordsys);

point A=(1,1);
dot("$A$",A,S,red);

real R=2;
circle C=circle(A,R);
draw(C,Arrow);

/*<asyxml><view file="modules/geometry.asy" type="ellipse" signature="*(transform,circle)"/></asyxml>*/
ellipse el=xscale(2)*C;
draw(el,blue,Arrow);

// /*<asyxml><view file="modules/geometry.asy" type="transform" signature="xscale(real,point)"/></asyxml>*/
ellipse el=xscale(2,A)*C;
draw(el,red,Arrow);
geometry-fig030
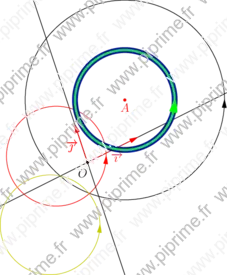
Show geometry/fig0300.asy on Github.
Generated with Asymptote 3.00-0.
Categories : Examples 2D | Geometry.asy
Tags : #Geometry | #Coords system | #Transform/scale/shift/rotate | #Ellipse | #Circle
import geometry;
size(8cm,0);

currentcoordsys=cartesiansystem((2,1),i=(1,0.5),j=(-0.25,.75));
show(currentcoordsys);

point A=(1,1);
dot("$A$",A,S,red);

real R=2;
circle C=circle(A,R);
draw(C,Arrow);

/*<asyxml><view file="modules/geometry.asy" type="ellipse" signature="*(transform,circle)"/></asyxml>*/
draw(scale(0.5)*C,red,Arrow);

draw(scale(0.5,A)*C,2mm+0.8*blue);

/*<asyxml><view file="modules/geometry.asy" type="circle" signature="/(explicit circle,real)"/></asyxml>*/
draw(C/2,0.75mm+green,Arrow(4mm));

// Note that the point 'point(C,0)' is always at the same place relatively to 'C'.
draw(rotateO(180)*C/2,0.8*yellow,Arrow);
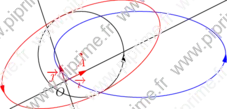
geometry-fig031
Show geometry/fig0310.asy on Github.
Generated with Asymptote 3.00-0.
Categories : Examples 2D | Geometry.asy
Tags : #Geometry | #Coords system | #Transform/scale/shift/rotate | #Ellipse | #Circle
import geometry;
size(10cm,0);

currentcoordsys=cartesiansystem((2,1),i=(1,0.5),j=(-0.25,.75));
show(currentcoordsys);

point A=(1,1);
dot("$A$",A,S,red);

real a=3, b=2;
ellipse el=ellipse(A,a,b,0);
draw(el,Arrow);

/*<asyxml><view file="modules/geometry.asy" type="ellipse" signature="*(transform,ellipse)"/></asyxml>*/
draw(scale(0.5)*el,red,Arrow);

draw(scale(0.5,A)*el,2mm+0.8*blue);

/*<asyxml><view file="modules/geometry.asy" type="ellipse" signature="/(ellipse,real)"/></asyxml>*/
draw(el/2,0.75mm+green,Arrow(4mm));

// Note that the point 'point(el,0)' is always at the same place relatively to 'el'.
draw(rotateO(135)*el/2,0.8*yellow,Arrow);
geometry-fig080
Show geometry/fig0800.asy on Github.
Generated with Asymptote 3.00-0.
Categories : Examples 2D | Geometry.asy
Tags : #Geometry | #Arc | #Circle | #Ellipse | #Transform/scale/shift/rotate
import geometry;
size(8cm,0);

// currentcoordsys=cartesiansystem((1,2),i=(1,0.5),j=(-0.5,.75));
show(currentcoordsys, xpen=invisible);

point A=(1,1);
dot("$A$",A,S,0.8red);

real R=2;
/*<asyxml><view file="modules/geometry.asy" type="" signature="struct arc"/></asyxml>*/
arc C=arc(circle(A,R),45,180);/*<asyxml><view file="modules/geometry.asy" type="arc" signature="arc(ellipse,real,real,polarconicroutine,bool)"/></asyxml>*/
draw(C,Arrow);

/*<asyxml><view file="modules/geometry.asy" type="arc" signature="complementary(arc)"/></asyxml>*/
draw(complementary(C),dashed+grey,Arrow(position=Relative(0.75)));

/*<asyxml><view file="modules/geometry.asy" type="arc" signature="*(transform,explicit arc)"/></asyxml>*/
arc Cp=scale(0.5,A)*C;
draw(Cp,0.8red,Arrow);

arc Cp=scale(-0.5,A)*C;
draw(Cp,0.8blue,Arrow);

arc Cp=scale(1.1,A)*C;
/*<asyxml><view file="modules/geometry.asy" type="arc" signature="reverse(arc)"/></asyxml>*/
draw(reverse(Cp),0.8*yellow,Arrow);

arc Cp=scale(0.9,A)*C;
draw(rotate(225,A)*Cp,0.8green,Arrow);
geometry-fig081
Show geometry/fig0810.asy on Github.
Generated with Asymptote 3.00-0.
Categories : Examples 2D | Geometry.asy
Tags : #Geometry | #Arc | #Circle | #Ellipse | #Transform/scale/shift/rotate
import geometry;
size(8cm,0);

// currentcoordsys=cartesiansystem((1,2),i=(1,0.5),j=(-0.5,.75));
show(currentcoordsys, xpen=invisible);

point A=(1,1);
dot("$A$",A,S,0.8red);

real R=2;
/*<asyxml><view file="modules/geometry.asy" type="" signature="struct arc"/></asyxml>*/
arc C=arc(ellipse(A,2R,R),45,180,fromCenter);
draw(C,Arrow);

/*<asyxml><view file="modules/geometry.asy" type="arc" signature="complementary(arc)"/></asyxml>*/
draw(complementary(C),dashed+grey,Arrow(position=Relative(0.75)));

/*<asyxml><view file="modules/geometry.asy" type="arc" signature="*(transform,explicit arc)"/></asyxml>*/
arc Cp=scale(0.5,A)*C;
draw(Cp,0.8red,Arrow);

arc Cp=scale(-0.5,A)*C;
draw(Cp,0.8blue,Arrow);

arc Cp=scale(1.1,A)*C;
/*<asyxml><view file="modules/geometry.asy" type="arc" signature="reverse(arc)"/></asyxml>*/
draw(reverse(Cp),0.8*yellow,Arrow);

arc Cp=scale(0.9,A)*C;
draw(rotate(225,A)*Cp,0.8green,Arrow);
geometry-fig082
Show geometry/fig0820.asy on Github.
Generated with Asymptote 3.00-0.
Categories : Examples 2D | Geometry.asy
Tags : #Geometry | #Arc | #Circle | #Transform/scale/shift/rotate | #Markers
import geometry;
size(8cm,0);

// currentcoordsys=cartesiansystem((1,2),i=(1,0.5),j=(-0.5,.75));
show(currentcoordsys, xpen=invisible);

point A=(1,1);
dot("$A$",A,S,red);

real R=2;
arc C=arc(circle(A,R), 45, 210);
draw(C,linewidth(4mm));

/*<asyxml><view file="modules/geometry.asy" type="void" signature="markarc(picture,Label,int,real,real,arc,arrowbar,pen,pen,margin,marker)"/></asyxml>*/
markarc(format("%0g",degrees(C)), C, Arrow);

/*<asyxml><view file="modules/geometry.asy" type="arc" signature="*(real, explicit arc)"/></asyxml>*/
draw(0.5*C,2mm+yellow);

arc Cp=C/3;
draw(Cp,1mm+blue);
markarc(format("%0g",degrees(Cp)), radius=25mm, Cp, blue, Arrow);
geometry-fig083
Show geometry/fig0830.asy on Github.
Generated with Asymptote 3.00-0.
Categories : Examples 2D | Geometry.asy
Tags : #Geometry | #Arc | #Circle | #Transform/scale/shift/rotate | #Markers
import geometry;
size(8cm,0);

// currentcoordsys=cartesiansystem((1,2),i=(1,0.5),j=(-0.5,.75));
show(currentcoordsys, xpen=invisible);

point A=(1,1);
dot("$A$", A, NW, red);

real R=2;
arc C=arc(circle(A,R), 45, 210, CW);
draw(C,linewidth(4mm));

/*<asyxml><view file="modules/geometry.asy" type="void" signature="markarc(picture,Label,int,real,real,arc,arrowbar,pen,pen,margin,marker)"/></asyxml>*/
markarc(format("%0g",degrees(C)), C, radius=markangleradius(), Arrow);

/*<asyxml><view file="modules/geometry.asy" type="arc" signature="*(real, explicit arc)"/></asyxml>*/
draw(0.5*C, 2mm+yellow);

arc Cp=C/3;
draw(Cp, 1mm+blue);
markarc(format("%0g",degrees(Cp)), radius=-25mm, Cp, blue, Arrow);
geometry-fig084
Show geometry/fig0840.asy on Github.
Generated with Asymptote 3.00-0.
Categories : Examples 2D | Geometry.asy
Tags : #Geometry | #Arc | #Ellipse | #Transform/scale/shift/rotate | #Markers
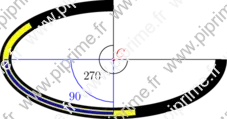
import geometry;
size(8cm,0);

// currentcoordsys=cartesiansystem((1,2),i=(1,0.5),j=(-0.5,.75));
// show(currentcoordsys, xpen=invisible);

point C=(1,1);
dot("$C$", C, NE, red);

real R=2;
arc a=arc(ellipse(C,R,R/2), 90, 0, fromCenter);
draw(a, linewidth(4mm));

/*<asyxml><view file="modules/geometry.asy" type="void" signature="markarc(picture,Label,int,real,real,arc,arrowbar,pen,pen,margin,marker)"/></asyxml>*/
markarc(format("%0g", degrees(a)), radius=-0.5*markangleradius(), a);

/*<asyxml><view file="modules/geometry.asy" type="arc" signature="*(real, explicit arc)"/></asyxml>*/
draw(0.5*a, 2mm+yellow);

arc ap=a/3;
draw(ap, 1mm+blue);
markarc(format("%0g", degrees(ap)), radius=1.5*markangleradius(), ap, blue);
geometry-fig085
Show geometry/fig0850.asy on Github.
Generated with Asymptote 3.00-0.
Categories : Examples 2D | Geometry.asy
Tags : #Geometry | #Arc | #Circle | #Transform/scale/shift/rotate | #Markers
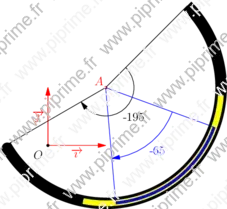
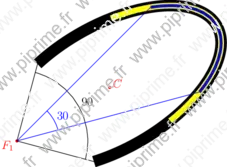
import geometry;
size(8cm,0);

// currentcoordsys=cartesiansystem((1,2),i=(1,0.5),j=(-0.5,.75));
// show(currentcoordsys, xpen=invisible);

point C=(1,1);
dot("$C$", C, dir(30), red);

arc a=arc(ellipse(C,2,1,30), -45, 45);
draw(a, linewidth(4mm));
dot("$F_1$", a.el.F1, dir(210), red);

/*<asyxml><view file="modules/geometry.asy" type="void" signature="markarc(picture,Label,int,real,real,arc,arrowbar,pen,pen,margin,marker)"/></asyxml>*/
markarc(format("%0g", degrees(a)), radius=2.5*markangleradius(), a);

/*<asyxml><view file="modules/geometry.asy" type="arc" signature="*(real, explicit arc)"/></asyxml>*/
draw(0.5*a, 2mm+yellow);

arc ap=a/3;
draw(ap, 1mm+blue);
markarc(format("%0g", degrees(ap)), radius=1.5*markangleradius(), ap, blue);
geometry-fig113
Show geometry/fig1130.asy on Github.
Generated with Asymptote 3.00-0.
Categories : Examples 2D | Geometry.asy
Tags : #Geometry | #Triangle | #Line | #Markers | #Transform/scale/shift/rotate | #Perpendicular
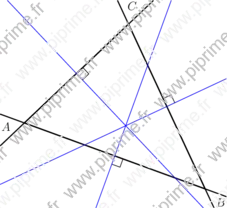
import geometry;
size(8cm,0);

// currentcoordsys=cartesiansystem((2,1),i=(1,0.5),j=(-0.25,0.75));
// show(currentcoordsys);

triangle t=rotate(-20)*triangle((-1,0), (2,0), (0,2));
drawline(t, linewidth(bp));
label(t,alignFactor=4);

line bab=bisector(t.AB);
draw(bab, blue);
perpendicularmark(t.AB,bab,quarter=4);

line bac=bisector(t.AC);
draw(bac, blue);
perpendicularmark(t.AC,bac,quarter=4);

line bbc=bisector(t.BC);
draw(bbc, blue);
perpendicularmark(t.BC,bbc,quarter=4);
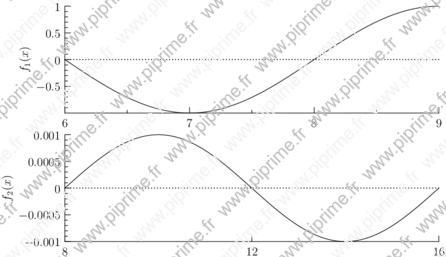
graph-fig034
Show graph/fig0350.asy on Github.
Generated with Asymptote 3.00-0.
Categories : Examples 2D | Graph.asy
Tags : #Graph | #Function (drawing) | #Align | #Picture | #Transform/scale/shift/rotate/projection
// From Asymptote's FAQ
import graph;

real width=15cm;
real aspect=0.3;

picture pic1,pic2;

size(pic1,width,aspect*width,IgnoreAspect);
size(pic2,width,aspect*width,IgnoreAspect);

scale(pic1,false);
scale(pic2,false);

real xmin1=6;
real xmax1=9;
real xmin2=8;
real xmax2=16;

real a1=1;
real a2=0.001;

real f1(real x) {return a1*sin(x/2*pi);}
real f2(real x) {return a2*sin(x/4*pi);}

draw(pic1,graph(pic1,f1,xmin1,xmax1));
draw(pic2,graph(pic2,f2,xmin2,xmax2));

xaxis(pic1,Bottom,LeftTicks());
yaxis(pic1,"$f_1(x)$",Left,RightTicks);

xaxis(pic2,Bottom,LeftTicks(Step=4));
yaxis(pic2,"$f_2(x)$",Left,RightTicks);

yequals(pic1,0,Dotted);
yequals(pic2,0,Dotted);

pair min1=point(pic1,SW);
pair max1=point(pic1,NE);

pair min2=point(pic2,SW);
pair max2=point(pic2,NE);

real scale=(max1.x-min1.x)/(max2.x-min2.x);
real shift=min1.x/scale-min2.x;

transform t1 = pic1.calculateTransform();
transform t2 = pic2.calculateTransform();
transform T=xscale(scale*t1.xx)*yscale(t2.yy);

add(pic1.fit());
real height=truepoint(N).y-truepoint(S).y;
add(shift(0,-height)*(shift(shift)*pic2).fit(T));
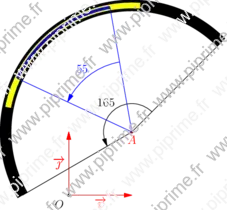
tiling-fig007
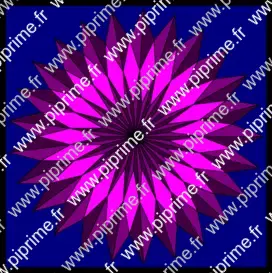
Author: Guillaume Connan.
Show tiling/fig0070.asy on Github.
Generated with Asymptote 3.00-0.
Categories : Surveys | Tiling
Tags : #Tiling | #Transform | #Shipout | #Fill/Unfill
size(10cm,0);

void zigzag(int k)
{
  real t=180/k;
  pair o=(0,0), m=dir(t),
    n=rotate(180-2*t,m)*o,
    b=rotate(4*t-180,n)*m,
    c=rotate(180-6*t,b)*n,
    nn=reflect(o,b)*n;

  path lo=m--n--b--nn--cycle,
    p=o--m--n--b--c--cycle,
    pp=reflect(o,b)*p;

  for (int i=0; i <= k; ++i){
    filldraw(rotate(2*t*i,o)*p,.5*(red+blue));
    filldraw(rotate(2*t*i,o)*pp,0.25(red+blue));
    filldraw(rotate(2*t*i,o)*lo,(red+blue));
  }
}

zigzag(25);
shipout(bbox(3mm,2mm+miterjoin+black,FillDraw(0.5*blue)));
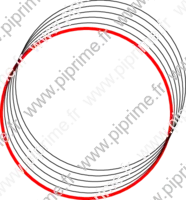
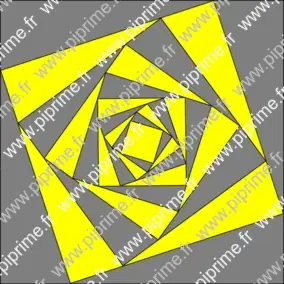
various-fig001
Show various/fig0100.asy on Github.
Generated with Asymptote 3.00-0.
Categories : Miscellaneous
Tags : #Loop/for/while | #Transform | #Fill/Unfill
size(10cm);

path g=box((-1,-1),(1,1));
pen [] col= new pen[]{gray,yellow};
real k=sqrt(10)/4;
transform T=scale(k)*rotate(degrees(acos(17/(16*k*sqrt(2)))));
int nb=10;

for (int i=0; i<nb; ++i) filldraw(T^i*g,col[i%2]);
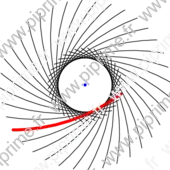
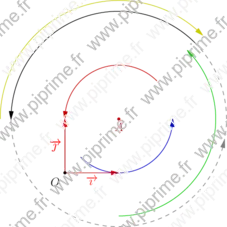
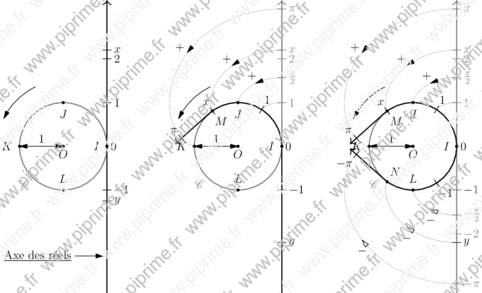
various-fig008
Show various/fig0405.asy on Github.
Generated with Asymptote 3.00-0.
Categories : Miscellaneous
Tags : #Transform | #Picture
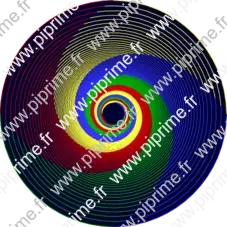
// PDF version of this picture: /home/pi/code/pi/asymptote/asymptote-exemples-builder/build/asy/various/fig0405.pdf
import labelpath;

size(17cm,0);
usepackage("mathrsfs, amsfonts,amsmath,amssymb");
picture pic, pic1, pic2, pic3;
real u=1, Y=pi+0.2;
path cle=scale(u)*unitcircle;
path arcg=arc((0,0),1.5*u,115,155);

void addtick(picture pic=currentpicture, Label L, pair z, pair dir=E, pen p=currentpen)
{
  transform R=rotate(degrees(dir));
  real width=1.5mm;
  Label L=L.copy();
  L.position(z);
  L.align(NoAlign,E);
  L.align.dir=R*L.align.dir*1.3*width/mm;
  L.p(p);
  pic.add(new void(frame f, transform t) {
      path g=(-width,0)--(width,0);
      picture opic;
      draw(opic,shift(t*z)*R*g,p);
      add(f,opic.fit());
    });
  add(pic,L);
}

path roll(picture pic=currentpicture, real x, int nb=50)
{
  real stp=x/(nb-1);
  return operator --(...
                     sequence(new guide(int t){
                         real tt=t*stp;
                         return shift(expi(tt))*((x-tt)*(-sin(tt),cos(tt)));
                       },nb));
}

labelpath("\tiny Sens direct",reverse(arcg));
draw(arcg, Arrow());
draw(Label("$\mathscr{C}$",Relative(0.625)), cle,bp+grey);

dot("$O$", (0,0), S);
dot("$0$", point(cle,0));
dot("$I$", point(cle,0), 2*W);
dot("$J$", point(cle,1), 2*S);
dot("$K$", point(cle,2), 2*W);
dot("$L$", point(cle,3), 2*N);

draw("$1$",(0,0)--point(cle,2),Arrows);

pic.add(currentpicture);// Save the common picture.

// Starting picture 1
pair yM=(u,Y*u), ym=(u,-Y*u);
draw(ym--yM, linewidth(bp), Arrow(TeXHead));
arrow("\underline{Axe des r\'eels}",(u,-0.75*Y*u),W,1cm);

real x=2.2, y=-1.25;
addtick(Label("$1$", align=E),(u,1));
addtick(Label("$2$", align=E),(u,2));
addtick(Label("$-1$", align=E),(u,-1));
addtick(Label("$x$", align=E),(u,x));
addtick(Label("$y$", align=E),(u,y));

pic1.add(currentpicture);
erase();

// Starting picture 2
add(pic);
real t=x+0.1;

draw((u,0)--yM, bp+grey, Arrow(TeXHead));
path tg=arc((0,0),u,0,degrees(t));
draw(tg,linewidth(bp));
addtick(Label("$1$", align=E),u*(cos(1),sin(1)),dir(degrees(1.0)));
addtick(Label("$1$", align=E),(u,1), grey);

addtick(Label("$2$", align=E),(u,2),grey);
addtick(Label("$\frac{\pi}{2}$", align=E),(u,pi/2),grey);
addtick(Label("$\pi$", align=E),(u,pi),grey);
addtick(Label("$-1$", align=E),(u,-1));
addtick(Label("$x$", align=E),(u,x), grey);
addtick(Label("$x$", align=E),u*(cos(x),sin(x)),dir(degrees(x)));
addtick(Label("$y$", align=E),(u,-x));

dot("$M$", u*expi(x), -2*u*expi(x));

draw(Label("+",Relative(0.5)), roll(x), dotted, Arrow(Relative(0.5)));
draw(roll(1), dotted);
draw(Label("+",Relative(0.5)), roll(pi/2), dotted, Arrow(Relative(0.5)));
draw(Label("+",Relative(0.5)), roll(pi,100), dotted, Arrow(Relative(0.5)));

path g=u*expi(t)--shift(u*expi(t))*((Y-t)*u*expi(pi/2+t));
draw(g,linewidth(bp), Arrow(TeXHead));
addtick(Label("$\pi$", align=E),arcpoint(g,(pi-t)*u),expi(t));

pic3.add(currentpicture);
draw(ym--(u,0), linewidth(bp));
pic2.add(currentpicture);
erase();

// Starting picture 3

draw(ym--(u,0), linewidth(bp)+grey);
path tg=arc((0,0),u,0,degrees(-t));
draw(tg,linewidth(bp));
addtick(Label("$-1$", align=E),u*(cos(-1),sin(-1)),dir(degrees(-1.0)));
addtick(Label("$-1$", align=E),(u,-1), grey);

addtick(Label("$-2$", align=E),(u,-2),grey);
addtick(Label("$-\frac{\pi}{2}$", align=E),(u,-pi/2),grey);
addtick(Label("$-\pi$", align=E),(u,-pi),grey);

dot("$N$", u*expi(-x), -2*u*expi(-x));

g=roll(-x);
draw(Label("$-$",align=2*I*dir(g,0.5),Relative(0.5)), g, dotted, Arrow(NoFill,Relative(0.5)));
g=roll(-1);
draw(g, dotted);
g=roll(-pi/2);
draw(Label("$-$",align=2*I*dir(g,0.5),Relative(0.5)), g, dotted, Arrow(NoFill,Relative(0.5)));
g=roll(-pi,100);
draw(Label("$-$",align=2*I*dir(g,0.5),Relative(0.5)), g, dotted, Arrow(NoFill,Relative(0.5)));

g=u*expi(-t)--shift(u*expi(-t))*((Y-t)*u*expi(-pi/2-t));
draw(g, linewidth(bp), Arrow(TeXHead));
addtick(Label("$-\pi$", align=E),arcpoint(g,(pi-t)*u),expi(-t));


////////////////////////////////////////////////////////////
pic3.add(currentpicture);
erase();

add(pic1);
add(shift(4*u,0)*pic2);
add(shift(8*u,0)*pic3);
shipout(format="pdf");
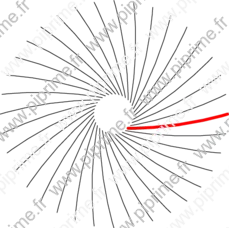
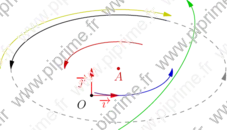
various-fig009
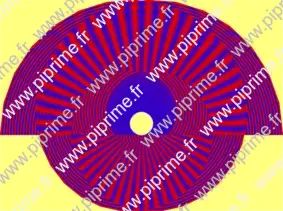
Show various/fig0410.asy on Github.
Generated with Asymptote 3.00-0.
Categories : Miscellaneous
Tags : #Transform | #Picture
size(10cm);
path cle=unitcircle;

path roll(picture pic=currentpicture, real x, int nb=50)
{
  real stp=x/(nb-1);
  return operator --(...
                     sequence(new guide(int t){
                         real tt=t*stp;
                         return shift(expi(tt))*((x-tt)*(-sin(tt),cos(tt)));
                       },nb));
}

real y=4*pi;
pair yM=(1,y), ym=(1,-y);

int nb=100;
real stp=2*y/nb;

path[] g;
for (int i=1; i <= nb; ++i) {
  real t=-y+i*stp;
  g.push(roll(-y+i*stp/2,50+round(20*i*stp))--reverse(roll(y-i*stp/2,50+round(20*i*stp)))--cycle);
}

pen p1=blue, p2=0.9*red;
fill(g,p1);
fill(g,fillrule(1)+p2);
unfill(cle);
draw(cle,white);
shipout(rotate(-90)*bbox(Fill(lightyellow)));