Asymptote Gallery Tagged by “Grid” #136
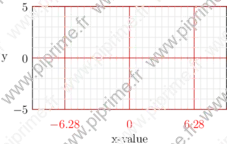
graph-fig006
Show graph/fig0060.asy on Github.
Generated with Asymptote 3.00-0.
Categories : Examples 2D | Graph.asy
Tags : #Graph | #Axis | #Grid
size(8cm,0);
import graph;

xlimits( -3pi, 3pi);
ylimits( -5, 5);
yaxis( "y" , LeftRight(), RightTicks(pTick=.8red, ptick=lightgrey, extend=true));
xaxis( "x-value", BottomTop(), Ticks(Label("$%.2f$",red), Step=2pi, step=pi/5, pTick=.8red, ptick=lightgrey, extend=true));
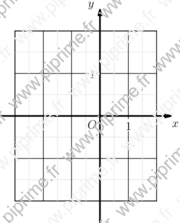
graph-fig018
Show graph/fig0190.asy on Github.
Generated with Asymptote 3.00-0.
Categories : Examples 2D | Graph.asy
Tags : #Graph | #Axis | #Label | #Grid
import graph;
unitsize(x=1cm, y=1.5cm);

xlimits( -3, 2);
ylimits( -2, 2);
xaxis(BottomTop, Ticks("%",extend=true, ptick=lightgrey));
yaxis(LeftRight, Ticks("%",extend=true, ptick=lightgrey));
xequals(Label("$y$",align=2NW),0,ymin=-2.5, ymax=2.5, p=linewidth(1.5pt), Arrow(2mm));
yequals(Label("$x$",align=2SE),0,xmin=-3.5, xmax=2.5, p=linewidth(1.5pt), Arrow(2mm));
labelx(Label("$1$",UnFill), 1);
labely(Label("$1$",UnFill), 1);
labelx("$O$",0,SW);
dot((0,0));
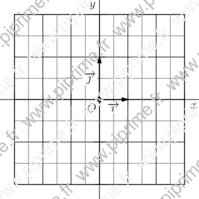
graph-fig019
Show graph/fig0200.asy on Github.
Generated with Asymptote 3.00-0.
Categories : Examples 2D | Graph.asy
Tags : #Graph | #Axis | #Label | #Grid | #Vector
import graph;

void graphicrules(picture pic=currentpicture, string prefix=defaultfilename, real unit=1cm,
                  real xunit=unit != 0 ? unit : 0,
                  real yunit=unit != 0 ? unit : 0,
                  real xmin, real xmax, real ymin, real ymax)
{
  xlimits(xmin, xmax);
  ylimits(ymin, ymax);
  unitsize(x=xunit, y=yunit);
}

void grid(picture pic=currentpicture,
          real xmin=pic.userMin().x, real xmax=pic.userMax().x,
          real ymin=pic.userMin().y, real ymax=pic.userMax().y,
          real xStep=1, real xstep=.5,
          real yStep=1, real ystep=.5,
          pen pTick=nullpen, pen ptick=grey, bool above=false)
{
  draw(pic,box((xmin,ymin),(xmax,ymax)),invisible);
  xaxis(pic, BottomTop, xmin, xmax, Ticks("%",extend=true,Step=xStep,step=xstep,pTick=pTick,ptick=ptick), above=above);
  yaxis(pic, LeftRight, ymin, ymax, Ticks("%",extend=true,Step=yStep,step=ystep,pTick=pTick,ptick=ptick), above=above);
}

void cartesianaxis(picture pic=currentpicture,
                   Label Lx=Label("$x$",align=S),
                   Label Ly=Label("$y$",align=W),
                   real xmin=pic.userMin().x, real xmax=pic.userMax().x,
                   real ymin=pic.userMin().y, real ymax=pic.userMax().y,
                   real extrawidth=1, real extraheight=extrawidth,
                   pen p=currentpen,
                   ticks xticks=Ticks("%",pTick=nullpen, ptick=grey),
                   ticks yticks=Ticks("%",pTick=nullpen, ptick=grey),
                   bool above=true,
                   arrowbar arrow=Arrow)
{
  extraheight= cm*extraheight/(2*pic.yunitsize);
  extrawidth = cm*extrawidth/(2*pic.xunitsize);
  yequals(pic, Lx, 0, xmin-extrawidth, xmax+extrawidth, p, above, arrow=arrow);
  xequals(pic, Ly, 0, ymin-extraheight, ymax+extraheight, p, above, arrow=arrow);
  yequals(pic, 0, xmin, xmax, p, xticks, above);
  xequals(pic, 0, ymin, ymax, p, yticks, above);
}

void labeloij(picture pic=currentpicture,
              Label Lo=Label("$O$",NoFill),
              Label Li=Label("$\vec{\imath}$",NoFill),
              Label Lj=Label("$\vec{\jmath}$",NoFill),
              pair diro=SW, pair diri=S, pair dirj=W,
              pen p=scale(2)*currentpen,
              filltype filltype=NoFill, arrowbar arrow=Arrow(2mm))
{
  if (Lo.filltype==NoFill) Lo.filltype=filltype;
  if (Li.filltype==NoFill) Li.filltype=filltype;
  if (Lj.filltype==NoFill) Lj.filltype=filltype;
  labelx(pic, Lo, 0, diro, p);
  draw(pic, Li, (0,0)--(1,0), diri, p, arrow);
  draw(pic, Lj, (0,0)--(0,1), dirj, p, arrow);
  dot(pic, (0,0), dotsize(p)+p);
}

//The figure starts here
graphicrules(yunit=1.5cm, xmin=-3, xmax=3, ymin=-2, ymax=2);
grid();
cartesianaxis(arrow=None);
labeloij(UnFill);
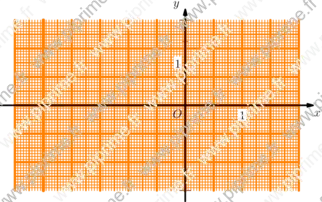
graph-fig020
Show graph/fig0210.asy on Github.
Generated with Asymptote 3.00-0.
Categories : Examples 2D | Graph.asy
Tags : #Graph | #Grid
import graph;

void graphicrules(picture pic=currentpicture, real unit=1cm,
                  real xunit=unit != 0 ? unit : 0,
                  real yunit=unit != 0 ? unit : 0,
                  real xmin, real xmax, real ymin, real ymax)
{
  xlimits(xmin, xmax);
  ylimits(ymin, ymax);
  pic.unitsize(x=xunit,y=yunit);
}

picture millimeterpaper(picture pic=currentpicture, pair O=(0,0),
                        real xmin=infinity, real xmax=infinity,
                        real ymin=infinity, real ymax=infinity,
                        pen p=.5bp+orange)
{
  picture opic;
  real
    cofx=pic.xunitsize/cm,
    cofy=pic.yunitsize/cm;
  real
    xmin= (xmin == infinity) ? pic.userMin().x*cofx : xmin*cofx,
    xmax= (xmax == infinity) ? pic.userMax().x*cofx : xmax*cofx,
    ymin= (ymin == infinity) ? pic.userMin().y*cofy : ymin*cofy,
    ymax= (ymax == infinity) ? pic.userMax().y*cofy : ymax*cofy;
  path
    ph=(xmin*cm,0)--(xmax*cm,0),
    pv=(0,ymin*cm)--(0,ymax*cm);
  real [] step={5, 1, .5, .1};
  pen [] p_={ p, scale(.7)*p, scale(.4)*p, scale(.2)*p};

  for (int j=0; j<4; ++j)
    {
      for (real i=O.y; i<= ymax; i+=step[j])
        draw(opic, shift(0,i*cm)*ph, p_[j]);
      for (real i=O.y; i>=ymin ; i-=step[j])
        draw(opic, shift(0,i*cm)*ph, p_[j]);
      for (real i=O.x; i<=xmax; i+=step[j])
        draw(opic, shift(i*cm,0)*pv, p_[j]);
      for (real i=O.x; i>=xmin; i-=step[j])
        draw(opic, shift(i*cm,0)*pv, p_[j]);
    }

  return opic;
}

graphicrules(xunit=2cm, yunit=1.5cm, xmin=-3, xmax=2, ymin=-2, ymax=2);
add(millimeterpaper(p=3bp+orange),(0,0));
xaxis(xmin=-3, xmax=2, Ticks("%"));
yaxis(ymin=-2, ymax=2, Ticks("%"));
xequals(Label("$y$",align=2NW),0,ymin=-2.25, ymax=2.25, p=linewidth(1.5pt), Arrow(2mm));
yequals(Label("$x$",align=2SE),0,xmin=-3.25, xmax=2.25, p=linewidth(1.5pt), Arrow(2mm));
labelx(Label("$1$",UnFill), 1);
labely(Label("$1$",UnFill), 1);
labelx("$O$",0,SW);
dot((0,0));
graph-fig021
Show graph/fig0220.asy on Github.
Generated with Asymptote 3.00-0.
Categories : Examples 2D | Graph.asy
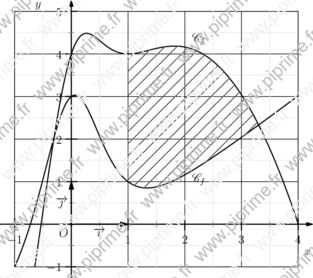
Tags : #Graph | #Function (drawing) | #Buildcycle | #Pattern | #Tex/latex features | #Grid
import graph;
import patterns;
usepackage("mathrsfs");

unitsize(2cm,1.5cm);
real xmin=-1,xmax=4;
real ymin=-1,ymax=5;

// Definition of fonctions f and g :
real f(real x) {return 4x-x^2+4/(x^2+1)^2;}
real g(real x) {return x-1+4/(x^2+1)^2;}

// Trace the curves :
path Cf=graph(f,xmin,xmax,n=400);
path Cg=graph(g,xmin,xmax,n=400);
draw(Cf,linewidth(1bp));
draw(Cg,linewidth(1bp));
xlimits(xmin,xmax,Crop);
ylimits(ymin,ymax,Crop);

// The grid :
xaxis(BottomTop, xmin, xmax, Ticks("%", Step=1, step=0.5, extend=true, ptick=lightgrey));
yaxis(LeftRight, ymin, ymax, Ticks("%", Step=1, step=0.5, extend=true, ptick=lightgrey));
// The axis.
xequals(Label("$y$",align=W),0,ymin=ymin-0.25, ymax=ymax+0.25,
        Ticks(NoZero,pTick=nullpen, ptick=grey),
        p=linewidth(1pt), Arrow(2mm));
yequals(Label("$x$",align=S),0,xmin=xmin-0.25, xmax=xmax+0.25,
        Ticks(NoZero,pTick=nullpen, ptick=grey),
        p=linewidth(1pt), Arrow(2mm));

labelx(Label("$O$",NoFill), 0, SW);
draw(Label("$\vec{\imath}$",align=S,UnFill),
     (0,0)--(1,0),scale(2)*currentpen,Arrow);
draw(Label("$\vec{\jmath}$",align=W,UnFill),
     (0,0)--(0,1),scale(2)*currentpen,Arrow);
dot((0,0));

label("$\mathscr{C}_f$",(2.25,f(2.25)),2N);
label("$\mathscr{C}_f$",(2.25,g(2.25)),2S);

// Les hachures.
path vline=(1,-1)--(1,5);
add("hachure",hatch(3mm));
fill(buildcycle(vline,graph(f,1,4),graph(g,1,4)),pattern("hachure"));