🔗Asymptote Gallery Tagged by “Number format” #66
🔗generalities-fig104

Show generalities/fig1040.asy on Github.
Generated with Asymptote 3.00-0.
Categories : Examples 2D | Generalities
Tags : #Basis | #Loop/for/while | #Fill/Unfill | #Arc | #Label | #Number format | #Align
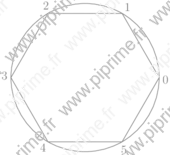
size(6cm,0);

real a=360/6;
for (int i = -1; i < 5; ++i)
  draw(Label(format("%i",i+1)),arc((0,0),10,i*a,(i+1)*a)--cycle,grey);
🔗generalities-fig105

Show generalities/fig1050.asy on Github.
Generated with Asymptote 3.00-0.
Categories : Examples 2D | Generalities
Tags : #Basis | #Number format
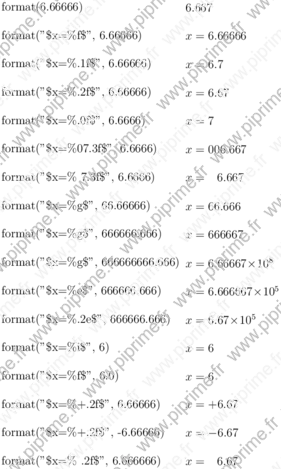
size(0,0);

pair x=0;
pair y=(-6.5cm,0);

label(format(6.66666), x, E);
label("format(6.66666)", y, E);

x+=(0,-1cm);y+=(0,-1cm);
label(format("$x=%f$", 6.66666), x, E);
label("format(\"\$x=\%f\$\", 6.66666)", y, E);

x+=(0,-1cm);y+=(0,-1cm);
label(format("$x=%.1f$", 6.66666), x, E);
label("format(\"\$x=\%.1f\$\", 6.66666)", y, E);

x+=(0,-1cm);y+=(0,-1cm);
label(format("$x=%.2f$", 6.66666), x, E);
label("format(\"\$x=\%.2f\$\", 6.66666)", y, E);

x+=(0,-1cm);y+=(0,-1cm);
label(format("$x=%.0f$", 6.66666), x, E);
label("format(\"\$x=\%.0f\$\", 6.6666)", y, E);

x+=(0,-1cm);y+=(0,-1cm);
label(format("$x=%07.3f$", 6.66666), x, E);
label("format(\"\$x=\%07.3f\$\", 6.6666)", y, E);

x+=(0,-1cm);y+=(0,-1cm);
label(format("$x=%7.3f$", 6.66666), x, E);
label("format(\"\$x=\% 7.3f\$\", 6.6666)", y, E);

x+=(0,-1cm);y+=(0,-1cm);
label(format("$x=%g$", 66.666), x, E);
label("format(\"\$x=\%g\$\", 66.66666)", y, E);

x+=(0,-1cm);y+=(0,-1cm);
label(format("$x=%g$", 666666.666), x, E);
label("format(\"\$x=\%g\$\", 666666.666)", y, E);

x+=(0,-1cm);y+=(0,-1cm);
label(format("$x=%g$", 666666666.666), x, E);
label("format(\"\$x=\%g\$\", 666666666.666)", y, E);

x+=(0,-1cm);y+=(0,-1cm);
label(format("$x=%e$", 666666.666), x, E);
label("format(\"\$x=\%e\$\", 666666.666)", y, E);

x+=(0,-1cm);y+=(0,-1cm);
label(format("$x=%.2e$", 666666.666), x, E);
label("format(\"\$x=\%.2e\$\", 666666.666)", y, E);

x+=(0,-1cm);y+=(0,-1cm);
label(format("$x=%i$", 6), x, E);
label("format(\"\$x=\%i\$\", 6)", y, E);

x+=(0,-1cm);y+=(0,-1cm);
label(format("$x=%f$", 6.0), x, E);
label("format(\"\$x=\%f\$\", 6.0)", y, E);

x+=(0,-1cm);y+=(0,-1cm);
label(format("$x=%+.2f$", 6.66666), x, E);
label("format(\"\$x=\%+.2f\$\", 6.66666)", y, E);

x+=(0,-1cm);y+=(0,-1cm);
label(format("$x=%+.2f$", -6.66666), x, E);
label("format(\"\$x=\%+.2f\$\", -6.66666)", y, E);

x+=(0,-1cm);y+=(0,-1cm);
label(format("$x=% .2f$", 6.666666), x, E);
label("format(\"\$x=\% .2f\$\", 6.666666)", y, E);
🔗generalities-fig107

Show generalities/fig1080.asy on Github.
Generated with Asymptote 3.00-0.
Categories : Examples 2D | Generalities
Tags : #Basis | #Number format | #Fraction
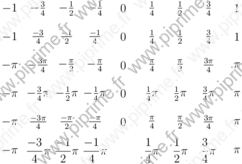
size(0,0);

int pgcd(int a, int b)
{
  int a_=abs(a), b_=abs(b), r=a_;
  if (b_>a_) {a_=b_; b_=r; r=a_;}
  while (r>0)
    {
      r=a_%b_;
      a_=b_;
      b_=r;
    }
  return a_;
}

string texfrac(int p, int q,
               string factor="",
               bool signin=false, bool factorin=true,
               bool displaystyle=false,
               bool zero=true)
{
  if (p==0) return (zero ? "$0$" : "");
  string disp= displaystyle ? "$\displaystyle " : "$";
  int pgcd=pgcd(p,q);
  int num= round(p/pgcd), den= round(q/pgcd);
  string nums;
  if (num==1)
    if (factor=="" || (!factorin && (den !=1))) nums="1"; else nums="";
  else
    if (num==-1)
      if (factor=="" || (!factorin && (den !=1))) nums="-1"; else nums="-";
    else nums= (string) num;
  if (den==1) return "$" + nums + factor + "$";
  else
    {
      string dens= (den==1) ? "" : (string) den;
      if (signin || num>0)
        if (factorin)
          return disp + "\frac{" + nums + factor + "}{" + (string) dens + "}$";
        else
          return disp + "\frac{" + nums + "}{" + (string) dens + "}"+ factor + "$";
      else
        {
          if (num==-1)
            if (factor=="" || !factorin) nums="1"; else nums="";
          else nums=(string)(abs(num));
        if (factorin)
          return disp + "-\frac{" + nums + factor + "}{" + (string) dens + "}$";
        else
          return disp + "-\frac{" + nums + "}{" + (string) dens + "}"+ factor + "$";
        }
    }
}

for (int i=-4; i<=4; ++i)
  {
    label(texfrac(i,4), (i*cm,0));
    label(texfrac(i,4,signin=true), (i*cm,-cm));
    label(texfrac(i,4,factor="\pi"), (i*cm,-2cm));
    label(texfrac(i,4,factor="\pi",factorin=false), (i*cm,-3cm));
    label(texfrac(i,4,factor="\pi",signin=true,factorin=true), (i*cm,-4cm));
    label(texfrac(i,4,factor="\pi",signin=true,factorin=false,displaystyle=true,zero=false), (i*cm,-5cm));
  }
🔗generalities-fig159

Show generalities/fig1600.asy on Github.
Generated with Asymptote 3.00-0.
Categories : Examples 2D | Generalities
Tags : #Basis | #Number format | #Label | #Tex/latex features
size(0,6cm);

texpreamble("\usepackage{amsmath}
             \DeclareMathOperator{\e}{e}");

pair A=2*expi(pi/3);

draw((0,-2)--(0,2.5));
draw((0,0)--(1,0),linewidth(1mm),Arrow(2mm));
draw((0,0)--(3.5,0));
draw((0,0)--(0,1),linewidth(1mm),Arrow(2mm));

dot(Label("$A(z_a=2\e^{i\frac{\pi}{3}})$"),A,NE);
label(format("$\vert z_a\vert=%.1f$",length(A)),(.5,-1),E);
label(format("$\arg(z_a)\simeq%.4f$",angle(A)),(.5,-2),E);
🔗generalities-fig160

Show generalities/fig1610.asy on Github.
Generated with Asymptote 3.00-0.
Categories : Examples 2D | Generalities
Tags : #Basis | #Number format | #Label | #Tex/latex features
size(10cm,0);

texpreamble("\usepackage{amsmath}
             \DeclareMathOperator{\e}{e}");

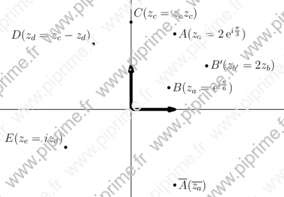
pair A=2*expi(pi/3);
pair B=expi(pi/6);
pair C=A*B;
pair D=C-B;
pair Bp=2*B;
pair E=I*D;

draw((0,-2)--(0,2.5));
draw((0,0)--(1,0),linewidth(1mm),Arrow(2mm));
draw((-3,0)--(3.5,0));
draw((0,0)--(0,1),linewidth(1mm),Arrow(2mm));

dot(Label("$A(z_a=2\e^{i\frac{\pi}{3}})$"),A);
dot(Label("$B(z_a=\e^{i\frac{\pi}{6}})$"),B);
dot(Label("$B'(z_{b'}=2z_b)$"),Bp);
dot(Label("$\overline{A}(\overline{z_a})$"),conj(A));
dot(Label("$C(z_c=z_a z_c)$"),C,NE);
dot(Label("$D(z_d=z_c-z_d)$"),D,NW);
dot(Label("$E(z_e=iz_d)$"),E,NW);
🔗graph-fig007
Show graph/fig0070.asy on Github.
Generated with Asymptote 3.00-0.
Categories : Examples 2D | Graph.asy
Tags : #Graph | #Axis | #Number format
size(8cm,0);
import graph;

xlimits( -3pi, 3pi);
xaxis(BottomTop(), Ticks(Label("$%.2f$",red), Step=2pi, step=pi/5, pTick=.8red));
🔗graph-fig008
Show graph/fig0080.asy on Github.
Generated with Asymptote 3.00-0.
Categories : Examples 2D | Graph.asy
Tags : #Graph | #Axis | #Number format | #Tex/latex features
size(8cm,0);
import graph;
texpreamble("\usepackage[frenchb]{babel}");

xlimits( -3pi, 3pi);
xaxis(BottomTop(), Ticks(Label("$\nombre{%.2f}$",red), Step=2pi, step=pi/5, pTick=.8red));
🔗graph-fig009
Show graph/fig0090.asy on Github.
Generated with Asymptote 3.00-0.
Categories : Examples 2D | Graph.asy
Tags : #Graph | #Axis | #Number format | #Tex/latex features
size(8cm,0);
import graph;
texpreamble("\usepackage[frenchb]{babel}");

xlimits( -10000, 10000);
xaxis(BottomTop(), Ticks(Label("$\nombre{%0.f}$",red), Step=5000, step=500, pTick=.8red));
🔗graph-fig010
Show graph/fig0110.asy on Github.
Generated with Asymptote 3.00-0.
Categories : Examples 2D | Graph.asy
Tags : #Graph | #Axis | #Number format | #Tex/latex features
// An other solution...
size(8cm,0);
import graph;
usepackage("icomma");

xlimits( -3pi, 3pi);

xaxis(Ticks(Label(red), Step=2pi,step=pi/5,pTick=.8red));