Asymptote Gallery Tagged by “Buildcycle” #107
generalities-fig187
Show generalities/fig1890.asy on Github.
Generated with Asymptote 3.00-0.
Categories : Examples 2D | Generalities
Tags : #Basis | #Path | #Intersection | #Buildcycle | #Transform/scale/shift/rotate | #Circle
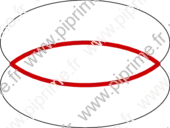
size(6cm,0);
path [] c;

c[1] = xscale(2)*unitcircle;
c[2] = shift((0,1))*c[1];
draw(c[1]^^c[2]);
draw(buildcycle(c[1],c[2]), .8red+4bp);
generalities-fig188
Show generalities/fig1900.asy on Github.
Generated with Asymptote 3.00-0.
Categories : Examples 2D | Generalities
Tags : #Basis | #Path | #Intersection | #Buildcycle | #Transform/scale/shift/rotate | #Array
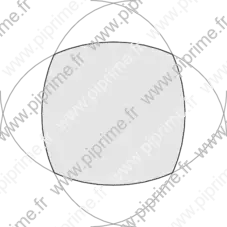
size(8cm,0);

path a,b,c,d;
a = (-1,-.2){up} .. tension 1.2 .. (1,-.2){down};
transform r90=rotate(90);
b = r90*a;
c = r90*b;
d = r90*c;
path bound=buildcycle(a,b,c,d);
fill(bound, lightgrey);
draw(a^^b^^c^^d,grey);
draw(bound);
generalities-fig189
Show generalities/fig1910.asy on Github.
Generated with Asymptote 3.00-0.
Categories : Examples 2D | Generalities
Tags : #Basis | #Path | #Intersection | #Buildcycle | #Transform/scale/shift/rotate | #Circle | #Fill/Unfill
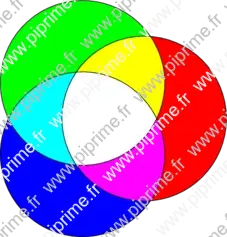
size(8cm,0);

path a,b,c;
a = shift(1,0)*scale(2)*unitcircle;
b = rotate(120)*a;
c = rotate(120)*b;

fill(a, red);
fill(b, green);
fill(c, blue);
fill(buildcycle(a,b), red + green);
fill(buildcycle(b,c), green + blue);
fill(buildcycle(c,a), blue + red);
fill(buildcycle(a,b,c), white);

draw(a^^b^^c);
graph-fig021
Show graph/fig0220.asy on Github.
Generated with Asymptote 3.00-0.
Categories : Examples 2D | Graph.asy
Tags : #Graph | #Function (drawing) | #Buildcycle | #Pattern | #Tex/latex features | #Grid
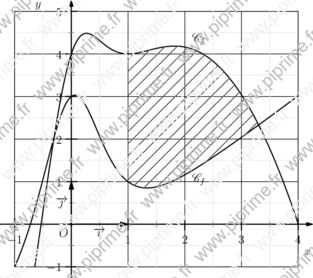
import graph;
import patterns;
usepackage("mathrsfs");

unitsize(2cm,1.5cm);
real xmin=-1,xmax=4;
real ymin=-1,ymax=5;

// Definition of fonctions f and g :
real f(real x) {return 4x-x^2+4/(x^2+1)^2;}
real g(real x) {return x-1+4/(x^2+1)^2;}

// Trace the curves :
path Cf=graph(f,xmin,xmax,n=400);
path Cg=graph(g,xmin,xmax,n=400);
draw(Cf,linewidth(1bp));
draw(Cg,linewidth(1bp));
xlimits(xmin,xmax,Crop);
ylimits(ymin,ymax,Crop);

// The grid :
xaxis(BottomTop, xmin, xmax, Ticks("%", Step=1, step=0.5, extend=true, ptick=lightgrey));
yaxis(LeftRight, ymin, ymax, Ticks("%", Step=1, step=0.5, extend=true, ptick=lightgrey));
// The axis.
xequals(Label("$y$",align=W),0,ymin=ymin-0.25, ymax=ymax+0.25,
        Ticks(NoZero,pTick=nullpen, ptick=grey),
        p=linewidth(1pt), Arrow(2mm));
yequals(Label("$x$",align=S),0,xmin=xmin-0.25, xmax=xmax+0.25,
        Ticks(NoZero,pTick=nullpen, ptick=grey),
        p=linewidth(1pt), Arrow(2mm));

labelx(Label("$O$",NoFill), 0, SW);
draw(Label("$\vec{\imath}$",align=S,UnFill),
     (0,0)--(1,0),scale(2)*currentpen,Arrow);
draw(Label("$\vec{\jmath}$",align=W,UnFill),
     (0,0)--(0,1),scale(2)*currentpen,Arrow);
dot((0,0));

label("$\mathscr{C}_f$",(2.25,f(2.25)),2N);
label("$\mathscr{C}_f$",(2.25,g(2.25)),2S);

// Les hachures.
path vline=(1,-1)--(1,5);
add("hachure",hatch(3mm));
fill(buildcycle(vline,graph(f,1,4),graph(g,1,4)),pattern("hachure"));