Asymptote Gallery Tagged by “Array” #112
fractales-fig009
Show fractales/fig0090.asy on Github.
Generated with Asymptote 3.00-0.
Categories : Surveys | Fractals
Tags : #Fractals | #Recursion | #Transform | #Picture | #Array
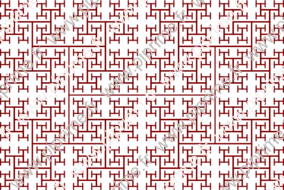
size(10cm,0);

real a=-1.5, b=2a/3;

picture H(pen p=currentpen) {
  picture H;
  draw(H,(-a,0)--(a,0)^^(-a,-b)--(-a,b)^^(a,-b)--(a,b),p);
  return H;
}

transform sc=scale(0.5);
transform[] t={identity(),
               shift(-a,b)*sc, shift(-a,-b)*sc,
               shift(a,b)*sc,  shift(a,-b)*sc};

picture Hfractal(int n, pen p=currentpen)
{
  picture pic;
  if(n == 0) return H(p);
  picture Ht=Hfractal(n-1,p);
  for (int i=0; i < 5; ++i) add(pic,t[i]*Ht);
  return pic;
}

add(Hfractal(4, bp+0.5*red));
fractales-fig010
Show fractales/fig0100.asy on Github.
Generated with Asymptote 3.00-0.
Categories : Surveys | Fractals
Tags : #Fractals | #Recursion | #Transform | #Picture | #Array
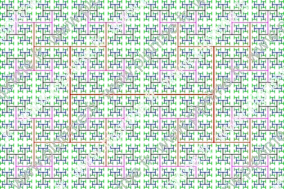
size(10cm,0);

real a=-1.5, b=2a/3;

path[] H=(-a,0)--(a,0)^^(-a,-b)--(-a,b)^^(a,-b)--(a,b);

transform sc=scale(0.5);
transform[] t={shift(-a,b)*sc, shift(-a,-b)*sc,
               shift(a,b)*sc,  shift(a,-b)*sc};

void Hfractal(path[] g, int n, pen[] p=new pen[]{currentpen})
{
  p.cyclic=true;
  if(n == 0) draw(H,p[0]); else {
    for (int i=0; i < 4; ++i) {
      draw(t[i]*g,p[n]);
      Hfractal(t[i]*g,n-1,p);
    }
  }
}

Hfractal(H, 5, new pen[] {0.8*red, 0.8*green, 0.8*blue, black, blue+red});
fractales-fig011
Show fractales/fig0110.asy on Github.
Generated with Asymptote 3.00-0.
Categories : Surveys | Fractals
Tags : #Fractals | #Recursion | #Geometry | #Triangle | #Array | #Loop/for/while
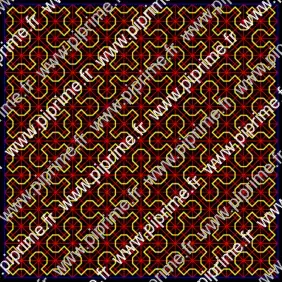
import geometry;
size(10cm,0);

triangle[] dissect(triangle T, int n)
{
  if(n <= 0) return new triangle[]{T};
  triangle[] OT;
  point M=midpoint(T.BC);
  triangle[] Tp=dissect(triangle(M,T.A,T.B),n-1);
  for(triangle t : Tp) OT.insert(0,t);
  triangle[] Tp=dissect(triangle(M,T.C,T.A),n-1);
  for(triangle t : Tp) OT.insert(0,t);
  return OT;
}

triangle T=rotate(45)*triangle((1,1),(0,0),(2,0));
triangle[] DT=dissect(T,9);
path g;
transform R=reflect(T.BC);

for(int i : DT.keys) {
  draw(DT[i],miterjoin+0.9*red);
  draw(R*DT[i],miterjoin+0.9*red);
  g=g--centroid(DT[i]);
}

draw(scale(sqrt(2))*unitsquare,bp+miterjoin+0.8*blue);
draw(g--reverse(R*g)--cycle,bp+miterjoin+yellow);

shipout(bbox(sqrt(2)*mm, Fill(black)));
fractales-fig012
Show fractales/fig0120.asy on Github.
Generated with Asymptote 3.00-0.
Categories : Surveys | Fractals
Tags : #Fractals | #Recursion | #Geometry | #Triangle | #Array | #Loop/for/while
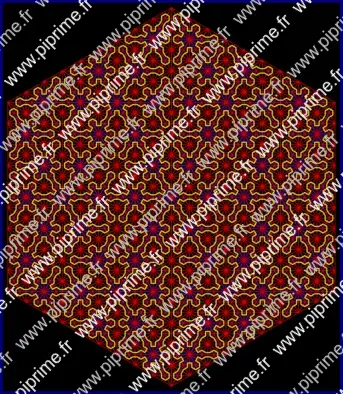
size(12cm,0);

import geometry;

triangle T=triangleAbc(90,Tan(30),1);

triangle[] reverse(triangle[] arr)
{
  triangle[] or;
  int l=arr.length;
  for(int i=0; i < l; ++i) {
    or.push(arr[l-i-1]);
  }
  return or;
}

triangle[] dissect(triangle T, int n, bool reverse=false)
{
  if(n <= 0) return new triangle[]{T};
  triangle[] OT;

  point M=curpoint(T.AB,T.b()*Tan(30));
  point H=projection(T.BC)*M;
  triangle[] OT1, OT2, OT3;
  OT.append(dissect(triangle(H,T.B,M),n-1,!reverse));
  OT.append(reverse((dissect(triangle(H,T.C,M),n-1,!reverse))));
  OT.append(dissect(triangle(T.A,T.C,M),n-1,!reverse));
  return OT;
}

triangle[] DT=dissect(T,5);
point O=centroid(DT[0]);
path g;
transform Ro=rotate(30,T.B), Re=reflect(T.BC), Roj;

for(int i : DT.keys) {
  O=incenter(DT[i]);
  g=g--O;
}

g=reverse(g);
path G, g=g--Re*reverse(g) ;
for (int j=0; j < 12; j += 2) G=G--Ro^(-j)*g;

fill(G--cycle,0.3*blue);

for(int i : DT.keys) {
  for (int j=0; j < 12; j += 2) {
    Roj=Ro^j;
    draw(Roj*DT[i],miterjoin+0.8*red);
    draw(Roj*(Re*DT[i]),miterjoin+0.8*red);
  }
}

draw(G--cycle,bp+miterjoin+0.9*yellow);

shipout(bbox(2mm, FillDraw(black, 1mm+miterjoin+deepblue)));
generalities-fig016
Show generalities/fig0160.asy on Github.
Generated with Asymptote 3.00-0.
Categories : Examples 2D | Generalities
Tags : #Basis | #Array | #Path
size(6cm, 6cm);

pair [] A;
A[0]=(-1, -1);
A[1]=( 1, -1);
A[2]=( 1,  1);
A[3]=(-1,  1);
draw (A[0]--A[1]--A[2]--A[3]--cycle);
draw (A[0]--A[2]);
draw (A[1]--A[3]);
generalities-fig052

Show generalities/fig0520.asy on Github.
Generated with Asymptote 3.00-0.
Categories : Examples 2D | Generalities
Tags : #Basis | #Fill/Unfill | #Shading | #Array | #Path
pen[][] p={{rgb(black)}, {rgb(.8red)}};

latticeshade((0,0)--(0,6cm)--(6cm,0)--cycle, p);
generalities-fig053
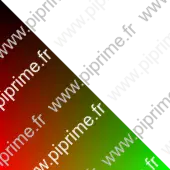
Show generalities/fig0530.asy on Github.
Generated with Asymptote 3.00-0.
Categories : Examples 2D | Generalities
Tags : #Basis | #Fill/Unfill | #Shading | #Array
pen[][] p={{rgb(black),rgb(black)}, {rgb(red),rgb(green)}};

latticeshade((0,0)--(0,6cm)--(6cm,0)--cycle,p);
generalities-fig059

Show generalities/fig0590.asy on Github.
Generated with Asymptote 3.00-0.
Categories : Examples 2D | Generalities
Tags : #Basis | #Shading | #Tex/latex features | #Texpath | #Fill/Unfill | #Array
size(16cm,0);

path[] P=texpath("$\displaystyle\int_{-\infty}^{+\infty}e^{-\alpha x^2}\,dx=
\sqrt{\frac{\pi}{\alpha}}$");
pair m=min(P), M=max(P);

axialshade(P,yellow,m,red,(m.x,M.y));
draw(P,0.5*blue);
shipout(bbox(3mm,Fill));
generalities-fig101
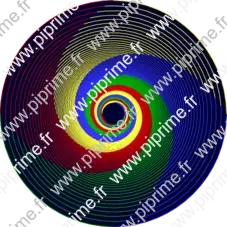
Show generalities/fig1010.asy on Github.
Generated with Asymptote 3.00-0.
Categories : Examples 2D | Generalities
Tags : #Basis | #Circle | #Picture | #Transform/scale/shift/rotate | #Array
size(8cm,0);

picture pic;
pen [] P={.8red,.7green,blue+.5grey,yellow+.6grey};

fill(scale(10)*unitcircle,.2blue);

for (int i = 0; i <= 3; ++i)
  draw(pic, arc((0,0),10,i*90,(i+1)*90), P[i]);

for (real i = 1; i <= 10; i+=.05)
  add(rotate(90*i)*scale(1/i)*pic);
generalities-fig154
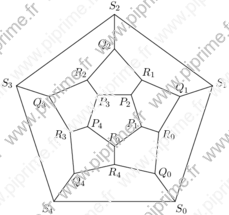
Show generalities/fig1550.asy on Github.
Generated with Asymptote 3.00-0.
Categories : Examples 2D | Generalities
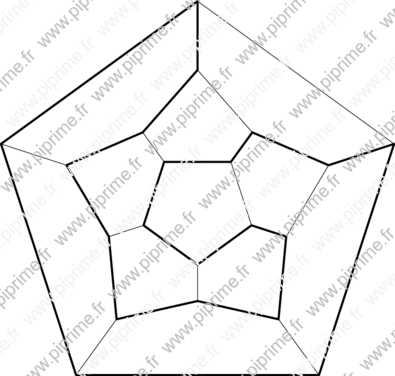
Tags : #Basis | #Array | #Path | #Loop/for/while | #Direction | #Label
size(0,0);

pair [] P, Q, R, S;
real u=1cm;

for (int i=0; i<=4; ++i)
  P[i] = rotate(i*360/5)*(0,-u);

P[5] = P[0];
for (int i=0; i<=4; ++i)
  Q[i] = 3*midpoint(P[i]--P[i+1]);

Q[5] = Q[0];
for (int i=0; i<=4; ++i)
  R[i] = 1/3*( Q[i] + Q[i+1] + P[i+1] );

R[5] = R[0];
for (int i=0; i<=5; ++i)
  S[i] = 1.5*Q[i];

for (int i=0; i<=4; ++i)
  {
    draw(P[i]   -- P[i+1]);
    draw(P[i+1] -- R[i]);
    draw(Q[i]   -- R[i]);
    draw(R[i]   -- Q[i+1]);
    draw(Q[i]   -- S[i]);
    draw(S[i]   -- S[i+1]);
    label(format("\small$P_%i$",i),P[i],-unit(P[i]));
    label(format("\small$Q_%i$",i),Q[i],rotate(60)*unit(Q[i]));
    label(format("\small$R_%i$",i),R[i],unit(R[i]));
    label(format("\small$S_%i$",i),S[i],unit(S[i]));
  }
generalities-fig155
Show generalities/fig1560.asy on Github.
Generated with Asymptote 3.00-0.
Categories : Examples 2D | Generalities
Tags : #Basis | #Array | #Path
size(0,0);

pair [] P, Q, R, S;
real u=2cm;

for (int i=0; i<=4; ++i)
  P[i] = rotate(i*360/5)*(0,-u);

P[5] = P[0];
for (int i=0; i<=4; ++i)
  Q[i] = 3*midpoint(P[i]--P[i+1]);

Q[5] = Q[0];
for (int i=0; i<=4; ++i)
  R[i] = 1/3*( Q[i] + Q[i+1] + P[i+1] );

R[5] = R[0];
for (int i=0; i<=5; ++i)
  S[i] = 1.5*Q[i];

for (int i=0; i<=4; ++i)
  {
    draw(P[i]   -- P[i+1]);
    draw(P[i+1] -- R[i]);
    draw(Q[i]   -- R[i]);
    draw(R[i]   -- Q[i+1]);
    draw(Q[i]   -- S[i]);
    draw(S[i]   -- S[i+1]);
  }

draw(P[2] -- P[3] -- P[4] -- P[0] -- P[1] --
     R[0] -- Q[0] -- R[4] -- Q[4] -- R[3]
     -- Q[3] -- R[2] -- Q[2] --
     S[2] -- S[3] -- S[4] -- S[0] -- S[1] --
     Q[1] -- R[1] -- cycle,
     linewidth(2bp));
generalities-fig156
Show generalities/fig1570.asy on Github.
Generated with Asymptote 3.00-0.
Categories : Examples 2D | Generalities
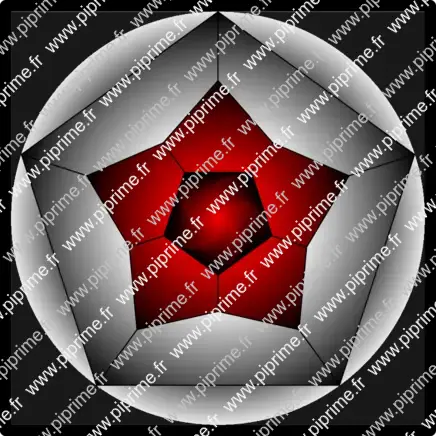
Tags : #Basis | #Array | #Loop/for/while | #Fill/Unfill | #Shading
size(0,0);

pair [] P, Q, R, S;
real u=2cm;

for (int i=0; i<=4; ++i)
  P[i] = rotate(i*360/5)*(0,-u);

P[5] = P[0];
for (int i=0; i<=4; ++i)
  Q[i] = 3*midpoint(P[i]--P[i+1]);

Q[5] = Q[0];
for (int i=0; i<=4; ++i)
  R[i] = 1/3*( Q[i] + Q[i+1] + P[i+1] );

R[5] = R[0];
for (int i=0; i<=5; ++i)
  S[i] = 1.5*Q[i];

fill(shift(-abs(S[0]),-abs(S[0]))*scale(2*abs(S[0]))*unitsquare,.2grey);

radialshade(scale(abs(S[0]))*unitcircle,lightgrey,(0,0),abs(S[0]),
            black,(0,0),abs(.85*midpoint(S[0]--S[1])));

P[6]=P[1];
for (int i=0; i<=4; ++i)
  {
    radialshade(S[i]--Q[i]--R[i]--Q[i+1]--S[i+1]--cycle,
                lightgrey,(0,0),abs(R[i]),
                black,(0,0),abs(S[i]));
    radialshade(R[i]--Q[i+1]--R[i+1]--P[i+2]--P[i+1]--cycle,
                .8red,(0,0),sqrt(1-(2-2cos(pi/5))/4)*u,
                black,(0,0),abs(Q[i+1]));
  }

for (real i=1; i>0; i-=.05)
  fill(rotate(90*(1-i))*scale(i)*(P[0]--P[1]--P[2]--P[3]--P[4]--cycle),
       (1-i)*red);

pen p=linewidth(1pt);
for (int i=0; i<=4; ++i)
  {
    draw(P[i]   -- P[i+1],p);
    draw(P[i+1] -- R[i],p);
    draw(Q[i]   -- R[i],p);
    draw(R[i]   -- Q[i+1],p);
    draw(Q[i]   -- S[i],p);
    draw(S[i]   -- S[i+1],p);
  }

shipout(bbox(0,black+4mm));
generalities-fig184
Show generalities/fig1860.asy on Github.
Generated with Asymptote 3.00-0.
Categories : Examples 2D | Generalities
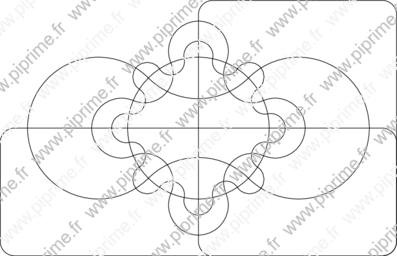
Tags : #Basis | #Venn diagram | #Path | #Array
// Venn diagram // Diagramme de Venn
// Edwards' construction // Construction d'Edwards
import roundedpath;
size(14cm,0);

path [] EdVenn(int n)
{
  path [] opath;
  if (n>=1)
    opath.push(shift(-1.4,-.9)*roundedpath(xscale(2.8)*yscale(.9)*unitsquare,.1));
  if (n>=2)
    opath.push(shift(0,-.9)*roundedpath(xscale(1.4)*yscale(1.8)*unitsquare,.1));
  if (n>=3)
    opath.push(scale(.5)*unitcircle);
  for (int i=1; i<=n-3; ++i)
    {
      pair pcle=point(opath[2],1/(2^i)),
        ccle=intersectionpoint(pcle--(pcle-dir(opath[2],1/(2^i))), (0,0)--(1,0));
      path cle=shift(ccle)*scale(abs(pcle-ccle))*unitcircle;
      real[] p1=intersect(cle, opath[2]);
      path ocle=subpath(cle,-p1[0],p1[0]);
      guide tpath;
      real step=360/(2^i), a=0;
      for (int j=0; j<2^i; ++j)
        {
          tpath=tpath..rotate(a)*ocle;
          a+=step;
        }
      opath.push(tpath..cycle);
    }
    return opath;
}

draw(EdVenn(6));
generalities-fig188
Show generalities/fig1900.asy on Github.
Generated with Asymptote 3.00-0.
Categories : Examples 2D | Generalities
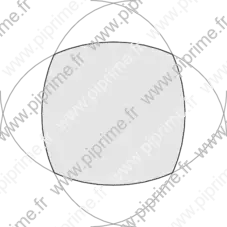
Tags : #Basis | #Path | #Intersection | #Buildcycle | #Transform/scale/shift/rotate | #Array
size(8cm,0);

path a,b,c,d;
a = (-1,-.2){up} .. tension 1.2 .. (1,-.2){down};
transform r90=rotate(90);
b = r90*a;
c = r90*b;
d = r90*c;
path bound=buildcycle(a,b,c,d);
fill(bound, lightgrey);
draw(a^^b^^c^^d,grey);
draw(bound);
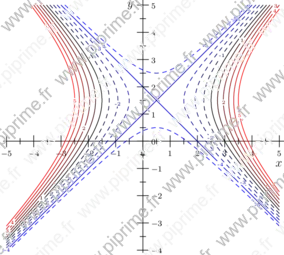
graph-fig025
Show graph/fig0260.asy on Github.
Generated with Asymptote 3.00-0.
Categories : Examples 2D | Graph.asy
Tags : #Graph | #Function (drawing) | #Hyperbola | #Contour | #Function (implicit) | #Array
size(10cm,0);
import contour;
import stats;
import graph;

xlimits( -5, 5);
ylimits( -4, 5);
yaxis( "$y$" , Ticks(Label(currentpen+fontsize(8),align=E)));
xaxis( "$x$", Ticks(Label(currentpen+fontsize(8))));

real f(real x, real y) {return x^2-x-y^2+3y-6;}

int min=-5,
  max=5,
  n=max-min+1;

real[] value=sequence(min,max);

pen[] p=sequence(new pen(int i) {
    return (value[i] >= 0 ? solid : dashed) +
    (value[i] >= 0 ? (value[i]/max)*red : (value[i]/min)*blue) +
    fontsize(4);
  },n);

Label[] Labels=sequence(new Label(int i) {
    return Label(value[i] != 0 ? (string) value[i] : "",Relative(unitrand()),(0,0),
                 UnFill(1bp));
  },n);

draw(Labels,contour(f,(-5,-5),(5,5),value),p);
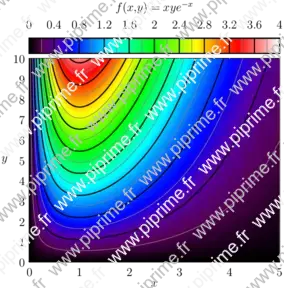
graph3-fig010
Show graph3/fig0100.asy on Github.
Generated with Asymptote 3.00-0.
Categories : Examples 3D | Graph3.asy
Tags : #Graph | #Contour | #Function (implicit) | #Palette | #Axis | #Array
// From documentation of Asymptote
import graph;
import palette;
import contour;
texpreamble("\usepackage{icomma}");

size(10cm,10cm,IgnoreAspect);

pair a=(0,0);
pair b=(5,10);

real fz(pair z) {
  return z.x*z.y*exp(-z.x);
}
real f(real x, real y) {return fz((x,y));}

int N=200;
int Divs=10;
int divs=2;

defaultpen(1bp);
pen Tickpen=black;
pen tickpen=gray+0.5*linewidth(currentpen);
pen[] Palette=BWRainbow();

scale(false);

bounds range=image(f,Automatic,a,b,N,Palette);

xaxis("$x$",BottomTop,LeftTicks(pTick=grey, ptick=invisible, extend=true));
yaxis("$y$",LeftRight,RightTicks(pTick=grey, ptick=invisible, extend=true));

// Major contours
real[] Cvals;
Cvals=sequence(11)/10 * (range.max-range.min) + range.min;
draw(contour(f,a,b,Cvals,N,operator ..),Tickpen);

// Minor contours
real[] cvals;
real[] sumarr=sequence(1,divs-1)/divs * (range.max-range.min)/Divs;
for (int ival=0; ival < Cvals.length-1; ++ival)
    cvals.append(Cvals[ival]+sumarr);
draw(contour(f,a,b,cvals,N,operator ..),tickpen);

palette("$f(x,y)=xye^{-x}$",range,point(NW)+(0,1),point(NE)+(0,0.25),Top,Palette,
        PaletteTicks(N=Divs,n=divs,Tickpen,tickpen));
graph3-fig015

Show graph3/fig0150.asy on Github.
Generated with Asymptote 3.00-0.
Categories : Examples 3D | Graph3.asy
Tags : #Graph (3D) | #Palette | #Surface | #Shading (3D) | #Array | #Spherical harmonics
settings.render=0;
import graph3;
size(15cm);

currentprojection=orthographic(4,2,4);

real r(real Theta, real Phi){return 1+0.5*(sin(2*Theta)*sin(2*Phi))^2;}
triple f(pair z) {return r(z.x,z.y)*expi(z.x,z.y);}

pen[] pens(triple[] z)
{
  return sequence(new pen(int i) {
      real a=abs(z[i]);
      return a < 1+1e-3 ? black : interp(blue, red, 2*(a-1));
    },z.length);
}

surface s=surface(f,(0,0),(pi,2pi),100,Spline);
// Interpolate the corners, and coloring each patch with one color
// produce some artefacts
draw(s,pens(s.cornermean()));

if(!is3D())
  shipout(bbox(3mm,Fill(black)));
graph3-fig016
Show graph3/fig0160.asy on Github.
Generated with Asymptote 3.00-0.
Categories : Examples 3D | Graph3.asy
Tags : #Graph (3D) | #Palette | #Surface | #Shading (3D) | #Array | #Spherical harmonics
settings.render=0;
import graph3;
size(15cm);

currentprojection=orthographic(4,2,4);

real r(real Theta, real Phi){return 1+0.5*(sin(2*Theta)*sin(2*Phi))^2;}
triple f(pair z) {return r(z.x,z.y)*expi(z.x,z.y);}

pen[][] pens(triple[][] z)
{
  pen[][] p=new pen[z.length][];
  for(int i=0; i < z.length; ++i) {
    triple[] zi=z[i];
    p[i]=sequence(new pen(int j) {
	real a=abs(zi[j]);
	return a < 1+1e-3 ? black : interp(blue, red, 2*(a-1));},
      zi.length);
  }
  return p;
}

surface s=surface(f,(0,0),(pi,2pi),100,Spline);
// Here we interpolate the pens, this looks smoother, with fewer artifacts
draw(s,mean(pens(s.corners())));

if(!is3D())
  shipout(bbox(3mm,Fill(black)));
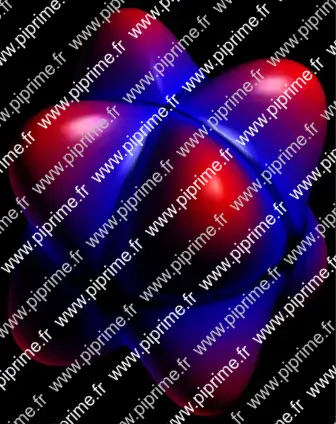
graph3-fig017

Show graph3/fig0170.asy on Github.
Generated with Asymptote 3.00-0.
Categories : Examples 3D | Graph3.asy
Tags : #Graph (3D) | #Palette | #Surface | #Shading (3D) | #Array | #Spherical harmonics
import graph3;
size(16cm, 0);

currentprojection=orthographic(4, 2, 4);

real r(real Theta, real Phi){return 1+0.5*(sin(2*Theta)*sin(2*Phi))^2;}
triple f(pair z) {return r(z.x, z.y)*expi(z.x, z.y);}

pen[][] pens(triple[][] z)
{
  pen[][] p=new pen[z.length][];
  for(int i=0; i < z.length; ++i) {
    triple[] zi=z[i];
    p[i]=sequence(new pen(int j) {
    real a=abs(zi[j]);

    return a < 1+1e-3 ? black : interp(blue, red, 2*(a-1));}, zi.length);
  }

  return p;
}

surface s=surface(f, (0, 0), (pi, 2pi), 100, Spline);
// Here we determine the colors of vertexes (vertex shading).
// Since the PRC output format does not support vertex shading of Bezier surfaces, PRC patches
// are shaded with the mean of the four vertex colors.
s.colors(pens(s.corners()));
draw(s);

if(!is3D())
  shipout(bbox(1mm, Fill(black)));
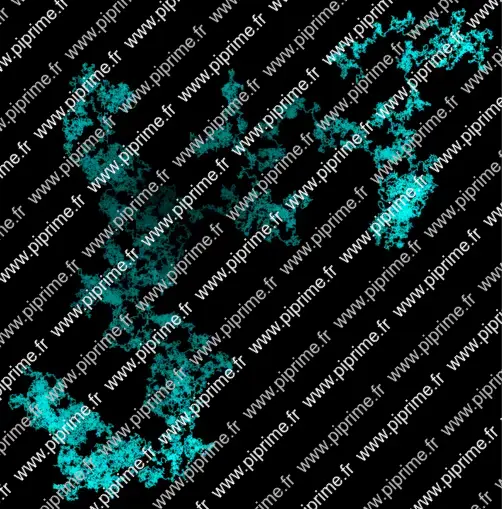
randomwalk-fig001
Show randomwalk/fig0010.asy on Github.
Generated with Asymptote 3.00-0.
Categories : Surveys | Random Walk (3D)
Tags : #Random | #Function (creating) | #Array | #Loop/for/while
import three;
settings.render=0;

// The available directions of steps
triple[] dirs={X,-X,Y,-Y,Z,-Z};
dirs.cyclic=true;

// Return the nodes of the path
triple[] randWalk(real Srnd(), int n)
{
  triple[] randPath;
  triple camera=1e10*currentprojection.camera;
  triple pos=O, tpos;
  int R;
  for (int i=0; i < n; ++i) {
    R=round(Srnd());
    tpos=pos+dirs[R];
    randPath.push(tpos);
    pos=tpos;
  }
  return randPath;
}
triple[] randWalk(int Srnd(), int n)
{
  real R(){ return Srnd();}
  return randWalk(R,n);
}

void drawWalk(triple[] nodes, pen p=white)
{
  triple camera=currentprojection.camera;
  if(currentprojection.infinity)
    camera *= max(abs(minbound(nodes)),abs(maxbound(nodes)));
  real[][] depth;
  for(int i=0; i < nodes.length-1; ++i) {
    real d=abs(camera-0.5*(nodes[i]+nodes[i+1]));
    depth.push(new real[] {d,i});
  }
  depth=sort(depth);
  triple M=nodes[round(depth[0][1])];
  triple m=nodes[round(depth[depth.length-1][1]+1)];
  // Draw from farthest to nearest
  while(depth.length > 0) {
    real[] a=depth.pop();
    int i=round(a[1]);
    draw(nodes[i]--nodes[i+1],abs(nodes[i]-m)/abs(M-m)*p);
  }
}


size(18cm);
currentprojection=orthographic((1,1,1));

drawWalk(randWalk(rand,50000),cyan);
shipout(bbox(3mm,Fill));
tube-fig009
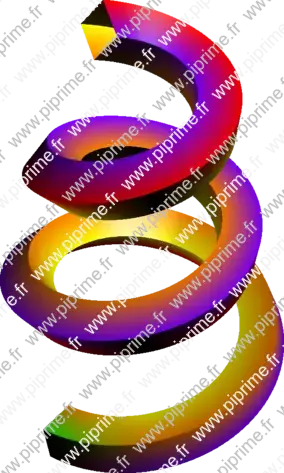
Show tube/fig0090.asy on Github.
Generated with Asymptote 3.00-0.
Categories : Examples 3D | Tube.asy
Tags : #Tube | #Graph (3D) | #Shading (3D) | #Array
import tube;
import graph3;

size(10cm,0);
currentprojection=perspective(4,3,4);
real x(real t) {return (1/sqrt(1+0.5*t^2))*cos(2pi*t);}
real y(real t) {return (1/sqrt(1+0.5*t^2))*sin(2pi*t);}
real z(real t) {return t;}

path3 p=graph(x,y,z,0,2.7,operator ..);
path section=scale(0.2)*polygon(4);

// Define an array of pen wich depends of a real t. t represent the "reltime" of the path3 p.
pen[] pens(real t){
  return new pen[] {interp(blue,red,t),
      interp(orange,yellow,t),
      interp(green,orange,t),
      interp(red,purple,t)};
}

// "pen[] pens(real t)" allows to color each nodes or segments with a real parameter (the reltime)
// Note that all arrays of pens are convert to cyclical arrays.
draw(tube(p,coloredpath(section,
                        pens,
                        colortype=coloredNodes)));