Asymptote Gallery Tagged by “Fraction” #96
generalities-fig067

Show generalities/fig0670.asy on Github.
Generated with Asymptote 3.00-0.
Categories : Examples 2D | Generalities
Tags : #Basis | #Point/Dot | #Label | #Tex/latex features | #Fraction
pair O=0;
dot(O);
label(scale(5) * "$\frac{\pi^2}{2}$", O);
generalities-fig068

Show generalities/fig0680.asy on Github.
Generated with Asymptote 3.00-0.
Categories : Examples 2D | Generalities
Tags : #Basis | #Point/Dot | #Label | #Tex/latex features | #Fraction | #Align
dot(Label(scale(5) * "$\frac{\pi^2}{2}$", (0,0), align=E));
generalities-fig107

Show generalities/fig1080.asy on Github.
Generated with Asymptote 3.00-0.
Categories : Examples 2D | Generalities
Tags : #Basis | #Number format | #Fraction
size(0,0);

int pgcd(int a, int b)
{
  int a_=abs(a), b_=abs(b), r=a_;
  if (b_>a_) {a_=b_; b_=r; r=a_;}
  while (r>0)
    {
      r=a_%b_;
      a_=b_;
      b_=r;
    }
  return a_;
}

string texfrac(int p, int q,
               string factor="",
               bool signin=false, bool factorin=true,
               bool displaystyle=false,
               bool zero=true)
{
  if (p==0) return (zero ? "$0$" : "");
  string disp= displaystyle ? "$\displaystyle " : "$";
  int pgcd=pgcd(p,q);
  int num= round(p/pgcd), den= round(q/pgcd);
  string nums;
  if (num==1)
    if (factor=="" || (!factorin && (den !=1))) nums="1"; else nums="";
  else
    if (num==-1)
      if (factor=="" || (!factorin && (den !=1))) nums="-1"; else nums="-";
    else nums= (string) num;
  if (den==1) return "$" + nums + factor + "$";
  else
    {
      string dens= (den==1) ? "" : (string) den;
      if (signin || num>0)
        if (factorin)
          return disp + "\frac{" + nums + factor + "}{" + (string) dens + "}$";
        else
          return disp + "\frac{" + nums + "}{" + (string) dens + "}"+ factor + "$";
      else
        {
          if (num==-1)
            if (factor=="" || !factorin) nums="1"; else nums="";
          else nums=(string)(abs(num));
        if (factorin)
          return disp + "-\frac{" + nums + factor + "}{" + (string) dens + "}$";
        else
          return disp + "-\frac{" + nums + "}{" + (string) dens + "}"+ factor + "$";
        }
    }
}

for (int i=-4; i<=4; ++i)
  {
    label(texfrac(i,4), (i*cm,0));
    label(texfrac(i,4,signin=true), (i*cm,-cm));
    label(texfrac(i,4,factor="\pi"), (i*cm,-2cm));
    label(texfrac(i,4,factor="\pi",factorin=false), (i*cm,-3cm));
    label(texfrac(i,4,factor="\pi",signin=true,factorin=true), (i*cm,-4cm));
    label(texfrac(i,4,factor="\pi",signin=true,factorin=false,displaystyle=true,zero=false), (i*cm,-5cm));
  }
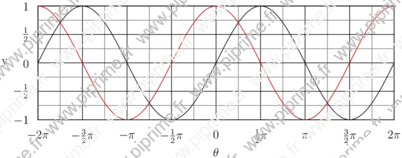
graph-fig022
Show graph/fig0230.asy on Github.
Generated with Asymptote 3.00-0.
Categories : Examples 2D | Graph.asy
Tags : #Graph | #Function (drawing) | #Fraction | #Label | #Tex/latex features | #Struct
import graph;
unitsize(x=1cm,y=2cm);

struct rational
{
  int p;
  int q;
  real ep=1/10^5;
};

rational operator init() {return new rational;}

rational rational(real x, real ep=1/10^5)
{
  rational orat;
  int q=1;
  while (abs(round(q*x)-q*x)>ep)
    {
      ++q;
    }
  orat.p=round(q*x);
  orat.q=q;
  orat.ep=ep;
  return orat;
}

int pgcd(int a, int b)
{
  int a_=abs(a), b_=abs(b), r=a_;
  if (b_>a_) {a_=b_; b_=r; r=a_;}
  while (r>0)
    {
      r=a_%b_;
      a_=b_;
      b_=r;
    }
  return a_;
}

string texfrac(int p, int q,
               string factor="",
               bool signin=false, bool factorin=true,
               bool displaystyle=false,
               bool zero=true)
{
  if (p==0) return (zero ? "$0$" : "");
  string disp= displaystyle ? "$\displaystyle " : "$";
  int pgcd=pgcd(p,q);
  int num= round(p/pgcd), den= round(q/pgcd);
  string nums;
  if (num==1)
    if (factor=="" || (!factorin && (den !=1))) nums="1"; else nums="";
  else
    if (num==-1)
      if (factor=="" || (!factorin && (den !=1))) nums="-1"; else nums="-";
    else nums= (string) num;
  if (den==1) return "$" + nums + factor + "$";
  else
    {
      string dens= (den==1) ? "" : (string) den;
      if (signin || num>0)
        if (factorin)
          return disp + "\frac{" + nums + factor + "}{" + (string) dens + "}$";
        else
          return disp + "\frac{" + nums + "}{" + (string) dens + "}"+ factor + "$";
      else
        {
          if (num==-1)
            if (factor=="" || !factorin) nums="1"; else nums="";
          else nums=(string)(abs(num));
        if (factorin)
          return disp + "-\frac{" + nums + factor + "}{" + (string) dens + "}$";
        else
          return disp + "-\frac{" + nums + "}{" + (string) dens + "}"+ factor + "$";
        }
    }
}

string texfrac(rational x,
               string factor="",
               bool signin=false, bool factorin=true,
               bool displaystyle=false,
               bool zero=true)
{
  return texfrac(x.p, x.q, factor, signin, factorin, displaystyle, zero);
}

ticklabel labelfrac(real ep=1/10^5, real factor=1.0,
                    string symbol="",
                    bool signin=false, bool symbolin=true,
                    bool displaystyle=false,
                    bool zero=true)
{
  return new string(real x)
    {
      return texfrac(rational(x/factor), symbol, signin, symbolin, displaystyle, zero);
    };
}

ticklabel labelfrac=labelfrac();

xlimits( -2pi, 2pi);
ylimits( -1, 1);

yaxis("y",LeftRight , Ticks(labelfrac,Step=.5,step=.25, ptick=grey, extend=true));

xaxis("$\theta$",BottomTop, Ticks(labelfrac(factor=pi,symbol="\pi",symbolin=false),
                           Step=pi/2, step=pi/4, ptick=grey, extend=true));

draw(graph(new real(real x){return sin(x);},-2pi,2pi));
draw(graph(new real(real x){return cos(x);},-2pi,2pi), .8red);
graph-fig023

Show graph/fig0240.asy on Github.
Generated with Asymptote 3.00-0.
Categories : Examples 2D | Graph.asy
Tags : #Graph | #Function (drawing) | #Fraction | #Label | #Tex/latex features | #Struct
import graph;

// public real xunit=1cm,yunit=1cm;

void graphicrules(picture pic=currentpicture, string prefix=defaultfilename, real unit=1cm,
                  real xunit=unit != 0 ? unit : 0,
                  real yunit=unit != 0 ? unit : 0,
                  real xmin, real xmax, real ymin, real ymax)
{
  xlimits(xmin, xmax);
  ylimits(ymin, ymax);
  unitsize(x=xunit, y=yunit);
}

struct rational
{
  int p;
  int q;
  real ep=1/10^5;
};

rational operator init() {return new rational;}

rational rational(real x, real ep=1/10^5)
{
  rational orat;
  int q=1;
  while (abs(round(q*x)-q*x)>ep)
    {
      ++q;
    }
  orat.p=round(q*x);
  orat.q=q;
  orat.ep=ep;
  return orat;
}

int pgcd(int a, int b)
{
  int a_=abs(a), b_=abs(b), r=a_;
  if (b_>a_) {a_=b_; b_=r; r=a_;}
  while (r>0)
    {
      r=a_%b_;
      a_=b_;
      b_=r;
    }
  return a_;
}

string texfrac(int p, int q,
               string factor="",
               bool signin=false, bool factorin=true,
               bool displaystyle=false,
               bool zero=true)
{
  if (p==0) return (zero ? "$0$" : "");
  string disp= displaystyle ? "$\displaystyle " : "$";
  int pgcd=pgcd(p,q);
  int num= round(p/pgcd), den= round(q/pgcd);
  string nums;
  if (num==1)
    if (factor=="" || (!factorin && (den !=1))) nums="1"; else nums="";
  else
    if (num==-1)
      if (factor=="" || (!factorin && (den !=1))) nums="-1"; else nums="-";
    else nums= (string) num;
  if (den==1) return "$" + nums + factor + "$";
  else
    {
      string dens= (den==1) ? "" : (string) den;
      if (signin || num>0)
        if (factorin)
          return disp + "\frac{" + nums + factor + "}{" + (string) dens + "}$";
        else
          return disp + "\frac{" + nums + "}{" + (string) dens + "}"+ factor + "$";
      else
        {
          if (num==-1)
            if (factor=="" || !factorin) nums="1"; else nums="";
          else nums=(string)(abs(num));
          if (factorin)
            return disp + "-\frac{" + nums + factor + "}{" + (string) dens + "}$";
          else
            return disp + "-\frac{" + nums + "}{" + (string) dens + "}"+ factor + "$";
        }
    }
}

string texfrac(rational x,
               string factor="",
               bool signin=false, bool factorin=true,
               bool displaystyle=false,
               bool zero=true)
{
  return texfrac(x.p, x.q, factor, signin, factorin, displaystyle, zero);
}

ticklabel labelfrac(real ep=1/10^5, real factor=1.0,
                    string symbol="",
                    bool signin=false, bool symbolin=true,
                    bool displaystyle=false,
                    bool zero=true)
{
  return new string(real x)
    {
      return texfrac(rational(x/factor), symbol, signin, symbolin, displaystyle, zero);
    };
}

ticklabel labelfrac=labelfrac();

void grid(picture pic=currentpicture,
          real xmin=pic.userMin().x, real xmax=pic.userMax().x,
          real ymin=pic.userMin().y, real ymax=pic.userMax().y,
          real xStep=1, real xstep=.5,
          real yStep=1, real ystep=.5,
          pen pTick=nullpen, pen ptick=grey, bool above=true)
{
  xaxis(pic, BottomTop, xmin, xmax, Ticks("%",extend=true,Step=xStep,step=xstep,pTick=pTick,ptick=ptick), above=above);
  yaxis(pic, LeftRight, ymin, ymax, Ticks("%",extend=true,Step=yStep,step=ystep,pTick=pTick,ptick=ptick), above=above);
}

void cartesianaxis(picture pic=currentpicture,
                   Label Lx=Label("$x$",align=S),
                   Label Ly=Label("$y$",align=W),
                   real xmin=pic.userMin().x, real xmax=pic.userMax().x,
                   real ymin=pic.userMin().y, real ymax=pic.userMax().y,
                   real extrawidth=1, real extraheight=extrawidth,
                   pen p=currentpen,
                   ticks xticks=Ticks("%",pTick=nullpen, ptick=grey),
                   ticks yticks=Ticks("%",pTick=nullpen, ptick=grey),
                   bool above=true,
                   arrowbar arrow=Arrow)
{
  extraheight= cm*extraheight/(2*pic.yunitsize);
  extrawidth = cm*extrawidth/(2*pic.xunitsize);
  yequals(pic, Lx, 0, xmin-extrawidth, xmax+extrawidth, p, above, arrow=arrow);
  yequals(pic, 0, xmin, xmax, p, xticks, above);
  xequals(pic, Ly, 0, ymin-extraheight, ymax+extraheight, p, above, arrow=arrow);
  xequals(pic, 0, ymin, ymax, p, yticks, above);
}

void labeloij(picture pic=currentpicture,
              Label Lo=Label("$O$",NoFill),
              Label Li=Label("$\vec{\imath}$",NoFill),
              Label Lj=Label("$\vec{\jmath}$",NoFill),
              pair diro=SW, pair diri=S, pair dirj=W,
              pen p=scale(2)*currentpen,
              filltype filltype=NoFill, arrowbar arrow=Arrow(2mm))
{
  if (Lo.filltype==NoFill) Lo.filltype=filltype;
  if (Li.filltype==NoFill) Li.filltype=filltype;
  if (Lj.filltype==NoFill) Lj.filltype=filltype;
  labelx(pic, Lo, 0, diro, p);
  draw(pic, Li, (0,0)--(1,0), diri, p, arrow);
  draw(pic, Lj, (0,0)--(0,1), dirj, p, arrow);
  dot(pic, (0,0), dotsize(p)+p);
}

void labeloIJ(picture pic=currentpicture,
              Label Lo=Label("$O$",NoFill),
              Label LI=Label("$I$",NoFill),
              Label LJ=Label("$J$",NoFill),
              pair diro=SW, pair dirI=S, pair dirJ=W,
              pen p=currentpen,
              filltype filltype=NoFill, arrowbar arrow=Arrow)
{
  if (Lo.filltype==NoFill) Lo.filltype=filltype;
  if (LI.filltype==NoFill) LI.filltype=filltype;
  if (LJ.filltype==NoFill) LJ.filltype=filltype;
  labelx(pic, LI, 1, dirI, p);
  labely(pic, LJ, 1, dirJ, p);
  labelx(pic, Lo, 0, diro, p);
  dot(pic, (0,0), dotsize(p)+p);
}

graphicrules(xunit=1cm, yunit=3cm,
             xmin=-2pi, xmax=2pi, ymin=-1, ymax=1);
grid(xStep=pi/2, xstep=pi/4, yStep=.5, ystep=.25);
cartesianaxis(xticks=Ticks(Label(UnFill),labelfrac(factor=pi,symbol="\pi",symbolin=true, zero=false),Step=pi/2, step=pi/4, ptick=grey),
              yticks=Ticks(Label(UnFill),labelfrac(zero=false),Step=.5,step=.25, ptick=grey), arrow=None);
dot("$O$",(0,0),2SW);