Asymptote Gallery Tagged by “Vector” #120
geometry-fig008
Show geometry/fig0080.asy on Github.
Generated with Asymptote 3.00-0.
Categories : Examples 2D | Geometry.asy
Tags : #Geometry | #Coords system | #Point | #Pair | #Vector
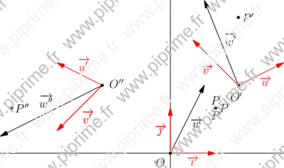
import geometry;
size(10cm,0);

currentcoordsys=cartesiansystem((1.5,1.5),i=(1,0.5),j=(-1,1));
coordsys Rp=currentcoordsys;
coordsys Rs=cartesiansystem((-1.5,1.5),i=(-1,0.5),j=(-1,-1));
coordsys R=defaultcoordsys;

show("$O$","$\vec{\imath}$", "$\vec{\jmath}$", R);
show("$O'$","$\vec{u}$","$\vec{v}$", Rp, xpen=invisible);
show("$O''$","$\vec{u'}$","$\vec{v'}$", Rs, xpen=invisible);

pair w=(0.75,1.5);
draw("$\overrightarrow{w}$",(0,0)--w,Arrow);

pair P=(1,1);
dot("$P$",P);
dot("$P$",point(Rp,P/Rp),N);
dot("$P$",point(Rs,P/Rs),S);

show("$\overrightarrow{w'}$", vector(w));
show("$\overrightarrow{w''}$", vector(Rs,w));

dot("$P'$",point(Rp,P));
dot("$P''$",point(Rs,P));
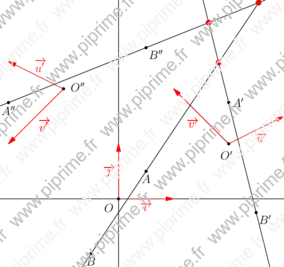
geometry-fig009
Show geometry/fig0090.asy on Github.
Generated with Asymptote 3.00-0.
Categories : Examples 2D | Geometry.asy
Tags : #Geometry | #Coords system | #Point | #Pair | #Vector
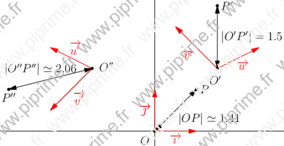
import geometry;
size(10cm,0);

currentcoordsys=cartesiansystem((1.5,1.5),i=(1,0.5),j=(-1,1));
coordsys Rp=currentcoordsys;
coordsys Rs=cartesiansystem((-1.5,1.5),i=(-1,0.5),j=(-1,-1));
coordsys R=defaultcoordsys;

show("$O$","$\vec{\imath}$", "$\vec{\jmath}$", R);
show("$O'$","$\vec{u}$","$\vec{v}$", Rp, xpen=invisible);
show("$O''$","$\vec{u'}$","$\vec{v'}$", Rs, xpen=invisible);

pair P=(1,1);
dot("$P$",P);

draw(format("$\vert OP\vert\simeq %.2f$",abs(P)),(0,0)--P,Arrows);

point Pp=P;
dot("$P'$",Pp);
vector wp=Pp;
show(format("$\vert O'P'\vert= %.2f$",abs(Pp)), wp, Arrows);

point Ps=point(Rs,P);
dot("$P''$",Ps,S);
vector ws=Ps;
show(format("$\vert O''P''\vert\simeq %.2f$",abs(Ps)), ws, Arrows);
geometry-fig010
Show geometry/fig0100.asy on Github.
Generated with Asymptote 3.00-0.
Categories : Examples 2D | Geometry.asy
Tags : #Geometry | #Coords system | #Point | #Pair | #Vector
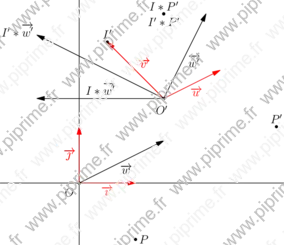
import geometry;
size(10cm,0);

currentcoordsys=cartesiansystem((1.5,1.5),i=(1,0.5),j=(-1,1));
coordsys Rp=currentcoordsys;
coordsys R=defaultcoordsys;

show("$O$","$\vec{\imath}$", "$\vec{\jmath}$", R);
show("$O'$", "$\vec{u}$", Label("$\vec{v}$",align=NE), Rp, xpen=invisible);

pair w=(1.5,0.75);
draw("$\overrightarrow{w}$",(0,0)--w,Arrow);

pair P=(1,-1);
dot("$P$",P);

show("$\overrightarrow{w'}$", vector(w));

dot("$P'$",point(Rp,P),N);

point Ip=I;
dot("$I'$",Ip,N);
dot("$I'*P'$",Ip*point(Rp,P),S);
dot("$I*P'$",I*point(Rp,P),N);

vector wp=Ip*vector(w);
show(Label("$I'*\overrightarrow{w'}$",EndPoint), wp);

vector foo=I*vector(w);
show("$I*\overrightarrow{w'}$", foo);
geometry-fig012
Show geometry/fig0120.asy on Github.
Generated with Asymptote 3.00-0.
Categories : Examples 2D | Geometry.asy
Tags : #Geometry | #Coords system | #Point | #Vector | #Line
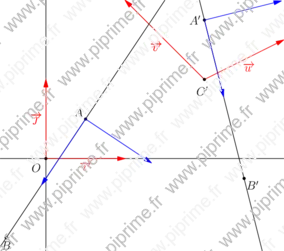
import geometry;
size(10cm,0);

currentcoordsys=cartesiansystem((2,1),i=(1,0.5),j=(-1,1));
coordsys Rp=currentcoordsys;
coordsys R=defaultcoordsys;

show("$O$","$\vec{\imath}$", "$\vec{\jmath}$", R);
show("$O'$", "$\vec{u}$", "$\vec{v}$", Rp, xpen=invisible);

pair a=(0.5,0.5);
pair b=(-0.5,-1);

point A=point(R,a), B=point(R,b);
dot("$A$",A,NW); dot("$B$",B,S);
line l=line(A,B);

point Ap=a, Bp=b;
dot("$A'$",Ap,W); dot("$B'$",Bp,SE);
line lp=line(Ap,Bp);

draw(l^^lp);

draw(l.A--l.A+l.u,blue,Arrow);
draw(l.A--l.A+l.v,blue,Arrow);
draw(lp.A--lp.A+lp.u,blue,Arrow);
draw(lp.A--lp.A+lp.v,blue,Arrow);
geometry-fig013
Show geometry/fig0130.asy on Github.
Generated with Asymptote 3.00-0.
Categories : Examples 2D | Geometry.asy
Tags : #Geometry | #Coords system | #Point | #Vector | #Line | #Intersection
import geometry;
size(10cm,0);

currentcoordsys=cartesiansystem((2,1),i=(1,0.5),j=(-1,1));
coordsys Rp=currentcoordsys;
coordsys Rs=cartesiansystem((-1,2),i=(-1,0.5),j=(-1,-1));
coordsys R=defaultcoordsys;

show("$O$","$\vec{\imath}$", "$\vec{\jmath}$", R);
show("$O'$","$\vec{u}$","$\vec{v}$", Rp, xpen=invisible);
show("$O''$", "$\vec{u'}$", "$\vec{v'}$", Rs, xpen=invisible);

pair a=(0.5,0.5);
pair b=(-0.5,-1);

point A=point(R,a), B=point(R,b);
dot("$A$",A,S); dot("$B$",B,S);
line l=line(A,B);

point Ap=a, Bp=b;
dot("$A'$",Ap); dot("$B'$",Bp,SE);
line lp=line(Ap,Bp);

point As=point(Rs,a), Bs=point(Rs,b);
dot("$A''$",As,S); dot("$B''$",Bs,SE);
line ls=line(As,Bs);

draw(l^^lp^^ls);

dot(intersectionpoint(l,lp),2mm+red);
dot(intersectionpoint(l,ls),2mm+red);
dot(intersectionpoint(lp,ls),2mm+red);
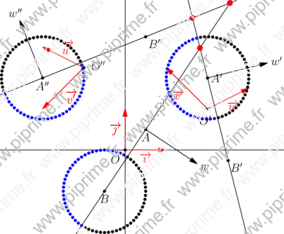
geometry-fig014
Show geometry/fig0140.asy on Github.
Generated with Asymptote 3.00-0.
Categories : Examples 2D | Geometry.asy
Tags : #Geometry | #Coords system | #Point | #Vector | #Line | #Intersection
include fig0130;

point w=l.A+1.5*l.v;
draw(Label("$w$",EndPoint),l.A--w,Arrow);

point wp=lp.A+1.5*lp.v;
draw(Label("$w'$",EndPoint),lp.A--wp,Arrow);

point ws=ls.A+1.5*ls.v;
draw(Label("$w''$",EndPoint),ls.A--ws,Arrow);

int n=64;
real step=2pi/n;

for (int i=0; i<n; ++i) {
  point p=B+point(R,R.polar(1,step*i));
  dot(p,sameside(p,w,l) ? black : blue);

  point p=Ap+point(Rp,Rp.polar(1,step*i));
  dot(p,sameside(p,wp,lp) ? black : blue);

  point p=As+point(Rs,Rs.polar(1,step*i));
  dot(p,sameside(p,ws,ls) ? black : blue);
}
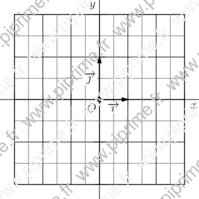
graph-fig019
Show graph/fig0200.asy on Github.
Generated with Asymptote 3.00-0.
Categories : Examples 2D | Graph.asy
Tags : #Graph | #Axis | #Label | #Grid | #Vector
import graph;

void graphicrules(picture pic=currentpicture, string prefix=defaultfilename, real unit=1cm,
                  real xunit=unit != 0 ? unit : 0,
                  real yunit=unit != 0 ? unit : 0,
                  real xmin, real xmax, real ymin, real ymax)
{
  xlimits(xmin, xmax);
  ylimits(ymin, ymax);
  unitsize(x=xunit, y=yunit);
}

void grid(picture pic=currentpicture,
          real xmin=pic.userMin().x, real xmax=pic.userMax().x,
          real ymin=pic.userMin().y, real ymax=pic.userMax().y,
          real xStep=1, real xstep=.5,
          real yStep=1, real ystep=.5,
          pen pTick=nullpen, pen ptick=grey, bool above=false)
{
  draw(pic,box((xmin,ymin),(xmax,ymax)),invisible);
  xaxis(pic, BottomTop, xmin, xmax, Ticks("%",extend=true,Step=xStep,step=xstep,pTick=pTick,ptick=ptick), above=above);
  yaxis(pic, LeftRight, ymin, ymax, Ticks("%",extend=true,Step=yStep,step=ystep,pTick=pTick,ptick=ptick), above=above);
}

void cartesianaxis(picture pic=currentpicture,
                   Label Lx=Label("$x$",align=S),
                   Label Ly=Label("$y$",align=W),
                   real xmin=pic.userMin().x, real xmax=pic.userMax().x,
                   real ymin=pic.userMin().y, real ymax=pic.userMax().y,
                   real extrawidth=1, real extraheight=extrawidth,
                   pen p=currentpen,
                   ticks xticks=Ticks("%",pTick=nullpen, ptick=grey),
                   ticks yticks=Ticks("%",pTick=nullpen, ptick=grey),
                   bool above=true,
                   arrowbar arrow=Arrow)
{
  extraheight= cm*extraheight/(2*pic.yunitsize);
  extrawidth = cm*extrawidth/(2*pic.xunitsize);
  yequals(pic, Lx, 0, xmin-extrawidth, xmax+extrawidth, p, above, arrow=arrow);
  xequals(pic, Ly, 0, ymin-extraheight, ymax+extraheight, p, above, arrow=arrow);
  yequals(pic, 0, xmin, xmax, p, xticks, above);
  xequals(pic, 0, ymin, ymax, p, yticks, above);
}

void labeloij(picture pic=currentpicture,
              Label Lo=Label("$O$",NoFill),
              Label Li=Label("$\vec{\imath}$",NoFill),
              Label Lj=Label("$\vec{\jmath}$",NoFill),
              pair diro=SW, pair diri=S, pair dirj=W,
              pen p=scale(2)*currentpen,
              filltype filltype=NoFill, arrowbar arrow=Arrow(2mm))
{
  if (Lo.filltype==NoFill) Lo.filltype=filltype;
  if (Li.filltype==NoFill) Li.filltype=filltype;
  if (Lj.filltype==NoFill) Lj.filltype=filltype;
  labelx(pic, Lo, 0, diro, p);
  draw(pic, Li, (0,0)--(1,0), diri, p, arrow);
  draw(pic, Lj, (0,0)--(0,1), dirj, p, arrow);
  dot(pic, (0,0), dotsize(p)+p);
}

//The figure starts here
graphicrules(yunit=1.5cm, xmin=-3, xmax=3, ymin=-2, ymax=2);
grid();
cartesianaxis(arrow=None);
labeloij(UnFill);