Asymptote Gallery Tagged by “Segment” #124
animations-fig007
Show animations/fig0080.asy on Github.
Generated with Asymptote 3.00-0.
Categories : Animation
Tags : #Graph (3D) | #Function (graphing) | #Animation | #Sphere | #Surface | #Path3 | #Segment
size(16cm);
import graph3;
import animation;
import solids;

settings.render=0;
animation A;

int nbpts=500;
real q=2/5;
real pas=5*2*pi/nbpts;
int angle=3;
real R=3;

real x(real t){return R*cos(q*t)*cos(t);}
real y(real t){return R*cos(q*t)*sin(t);}
real z(real t){return R*sin(q*t);}

triple[] P;
real t=-pi;
for (int i=0; i<nbpts; ++i) {
  t+=pas;
  P.push((x(t),y(t),z(t)));
}

currentprojection=orthographic((0,5,2));
currentlight=(3,3,5);

pen p=rgb(0.1,0.1,0.58);
transform3 t=rotate(angle,(0,0,0),(1,0.25,0.25));

filldraw(box((-R-0.5,-R-0.5),(R+0.5,R+0.5)), p, 3mm+black+miterjoin);

revolution r=sphere(O,R);
draw(surface(r),p);

for (int phi=0; phi<360; phi+=angle) {
  bool[] back,front;
  save();

  for (int i=0; i<nbpts; ++i) {
    P[i]=t*P[i];
    bool test=dot(P[i],currentprojection.camera) > 0;
    front.push(test);
  }

  draw(segment(P,front,operator ..),linewidth(1mm));
  draw(segment(P,!front,operator ..),grey);
  A.add();
  restore();
}

A.movie();
animations-fig008
Show animations/fig0090.asy on Github.
Generated with Asymptote 3.00-0.
Categories : Animation
Tags : #Graph (3D) | #Function (graphing) | #Animation | #Sphere | #Surface | #Path3 | #Segment | #Projection (3D) | #Plane
size(16cm);
import graph3;
import animation;
import solids;

currentlight.background=black;
settings.render=0;
animation A;
A.global=false;

int nbpts=500;
real q=2/5;
real pas=5*2*pi/nbpts;
int angle=4;
real R=0.5;
pen p=rgb(0.1,0.1,0.58);
triple center=(1,1,1);
transform3 T=rotate(angle,center,center+X+0.25*Y+0.3*Z);

real x(real t){return center.x+R*cos(q*t)*cos(t);}
real y(real t){return center.y+R*cos(q*t)*sin(t);}
real z(real t){return center.z+R*sin(q*t);}

currentprojection=orthographic(1,1,1);
currentlight=(0,center.y-0.5,2*(center.z+R));

triple U=(center.x+1.1*R,0,0), V=(0,center.y+1.1*R,0);
path3 xy=plane(U,V,(0,0,0));
path3 xz=rotate(90,X)*xy;
path3 yz=rotate(-90,Y)*xy;

triple[] P;
path3 curve;
real t=-pi;
for (int i=0; i < nbpts; ++i) {
  t+=pas;
  triple M=(x(t),y(t),z(t));
  P.push(M);
  curve = curve..M;
}

curve=curve..cycle;

draw(surface(xy), grey);
draw(surface(xz), grey);
draw(surface(yz), grey);

triple xyc=(center.x,center.y,0);
path3 cle=shift(xyc)*scale3(R)*unitcircle3;
surface scle=surface(cle);
draw(scle, black);
draw(rotate(90,X)*scle, black);
draw(rotate(-90,Y)*scle, black);

draw(surface(sphere(center,R)), p);

triple vcam=1e5*currentprojection.camera-center;
for (int phi=0; phi<360; phi+=angle) {
  bool[] back,front;
  save();

  for (int i=0; i<nbpts; ++i) {
    P[i]=T*P[i];
    bool test=dot(P[i]-center,vcam) > 0;
    front.push(test);
  }

  curve=T*curve;
  draw(segment(P,front,operator ..), paleyellow);
  draw(segment(P,!front,operator ..),0.5*(paleyellow+p));
  draw((planeproject(xy)*curve)^^
       (planeproject(xz)*curve)^^
       (planeproject(yz)*curve), paleyellow);

  A.add();
  restore();
}

A.movie();
geometry-fig024
Show geometry/fig0240.asy on Github.
Generated with Asymptote 3.00-0.
Categories : Examples 2D | Geometry.asy
Tags : #Geometry | #Coords system | #Line | #Segment | #Draw (2D)
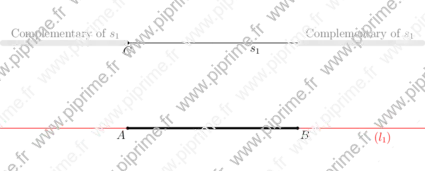
import geometry;
size(15cm,0);

// currentcoordsys=cartesiansystem((2,1),i=(1,0.25),j=(-0.25,.75));
// show(lj=Label("$\vec{\jmath}$",EndPoint), currentcoordsys);

point A=(-1,-0.5);
point B=(1,-0.5);
point C=(-1,0.5);

line l1=line(A,B);
draw("$(l_1)$",l1,red);

/*<asyxml><view file="modules/geometry.asy" type="" signature="struct segment"/></asyxml>*/
segment s=segment(A,B);
draw(s, linewidth(2bp));
dot("$A$", A, SW);
dot("$B$", B, SE);
dot("$C$", C, S);

segment s1=parallel(C,s);
draw(Label("$s_1$",Relative(0.75)),s1);

Label lt=Label("Complementary of $s_1$",Relative(0.5),align=N,grey);
Label[] L={lt, lt};

/*<asyxml><view file="modules/geometry.asy" type="line[]" signature="complementary(explicit segment)"/></asyxml>*/
line[] cs1=complementary(s1);

/*<asyxml><view file="modules/geometry.asy" type="void" signature="draw(picture,Label[],line[],align,pen,arrowbar,Label,marker)"/></asyxml>*/
draw(L, cs1, 2mm+lightgrey);

draw(box(locate((-2.5,-1)),locate((2.5,1))), invisible);
geometry-fig025
Show geometry/fig0250.asy on Github.
Generated with Asymptote 3.00-0.
Categories : Examples 2D | Geometry.asy
Tags : #Geometry | #Line | #Segment | #Perpendicular
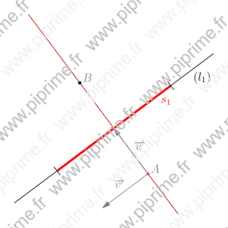
unitsize(2cm);
import geometry;
linemargin=5mm;

// currentcoordsys=cartesiansystem((2,1),i=(1,0.25),j=(-0.25,.75));
// show(li=Label("$\vec{\imath}$",align=S,EndPoint), currentcoordsys);

point A=(-1,-1), B=(1,0.5);
line l1=line(A,B);

draw("$(l_1)$",l1);
draw("$s_1$",(segment) l1, 2pt+red,
     marker(stickframe,markuniform(2,true)));

/*<asyxml><view file="modules/geometry.asy" type="line" signature="bisector(segment,real)"/></asyxml>*/
line bis=bisector((segment) l1);
draw(bis,red);

/*<asyxml><view file="modules/geometry.asy" type="void" signature="show(picture,line,pen)"/></asyxml>*/
show(bis,grey);

/*<asyxml><view file="modules/geometry.asy" type="point" signature="point(line,real)"/></asyxml>*/
dot(point(bis,1.5));

draw(box(locate((-2,-2)),locate((2,2))),invisible);
geometry-fig105
Show geometry/fig1050.asy on Github.
Generated with Asymptote 3.00-0.
Categories : Examples 2D | Geometry.asy
Tags : #Geometry | #Segment | #Intersection | #Line | #Markers | #Point
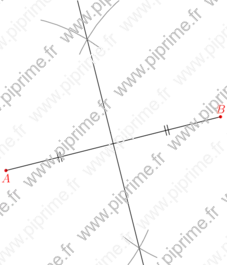
import geometry;
size(8cm,0);

// currentcoordsys=cartesiansystem((1,2),i=(1,0.5),j=(-0.5,.75));
// show(currentcoordsys, xpen=invisible);

point A=(0.25,0.25);
point B=A+(1,0.25);
dot("$A$",A,S,red);
dot("$B$",B,N,red);

segment s=segment(A,B);
line bis=bisector(s);

draw(s,StickIntervalMarker(2,2));
draw(bis);

/*<asyxml><view file="modules/geometry.asy" type="path" signature="compassmark(pair,pair,real,real)"/></asyxml>*/
draw(compassmark(A, point(bis,0.75), position=0.25,angle=25), grey);
draw(compassmark(B, point(bis,0.75), position=0.75,angle=25), grey);

/*<asyxml><view file="modules/geometry.asy" type="point" signature="point(line,real)"/></asyxml>*/
draw(compassmark(A, point(bis,0.25), position=0.5,angle=15), grey);
draw(compassmark(B, point(bis,0.25), position=0.5,angle=15), grey);
geometry-fig110
Show geometry/fig1100.asy on Github.
Generated with Asymptote 3.00-0.
Categories : Examples 2D | Geometry.asy
Tags : #Geometry | #Triangle | #Markers | #Label | #Segment
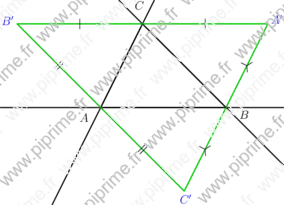
import geometry;
size(10cm,0);

// currentcoordsys=cartesiansystem((2,1),i=(1,0.5),j=(-0.25,0.75));
// show(currentcoordsys);

triangle t=triangle((-1,0), (2,0), (0,2));

drawline(t, linewidth(bp));
/*<asyxml><view file="modules/geometry.asy" type="void" signature="label(picture,Label,Label,Label,triangle,real,real,pen,filltype)"/></asyxml>*/
label(t, alignFactor=4);

/*<asyxml><view file="modules/geometry.asy" type="triangle" signature="anticomplementary(triangle)"/></asyxml>*/
triangle at=anticomplementary(t);
draw(at, bp+0.8green);
label("$A'$", "$B'$", "$C'$", at, blue);

draw(segment(at.AB), bp+0.8green, StickIntervalMarker(2,1));
draw(segment(at.BC), bp+0.8green, StickIntervalMarker(2,2));
draw(segment(at.CA), bp+0.8green, CrossIntervalMarker(2,3));