Asymptote Gallery Tagged by “Parabola” #126
geometry-fig032
Show geometry/fig0320.asy on Github.
Generated with Asymptote 3.00-0.
Categories : Examples 2D | Geometry.asy
Tags : #Geometry | #Coords system | #Parabola
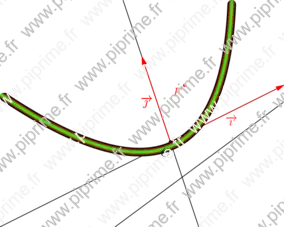
import geometry;
size(10cm,0);

currentcoordsys=cartesiansystem((2,1),i=(1,0.5),j=(-0.25,.75));
show(currentcoordsys);

point F=(0.25,0.5);

dot("$F$",F,SW,red);

// Enlarge the bounding box of the current picture
draw(box(locate((-1.5,0)),locate((1,1))), invisible);

line l=rotateO(10)*line((0,-0.4),(1,-0.4));
draw(l);

/*<asyxml><view file="modules/geometry.asy" type="parabola" signature="parabola(point,line)"/></asyxml>*/
parabola p=parabola(F,l);
draw(p,linewidth(3mm));

/*<asyxml><view file="modules/geometry.asy" type="parabola" signature="parabola(point,point)"/></asyxml>*/
draw(parabola(p.F,p.V),2mm+red);

/*<asyxml><view file="modules/geometry.asy" type="parabola" signature="parabola(point,real,real)"/></asyxml>*/
draw(parabola(p.F,p.a,p.angle),1mm+green);
geometry-fig033
Show geometry/fig0330.asy on Github.
Generated with Asymptote 3.00-0.
Categories : Examples 2D | Geometry.asy
Tags : #Geometry | #Draw (2D) | #Clip | #Deferred drawing | #Parabola
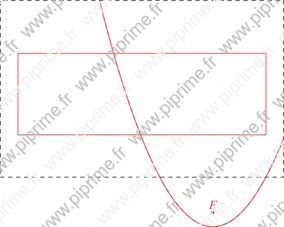
import geometry;
size(10cm);

point F=(2,-1.5);
dot("$F$",F,N,red);

// Enlarge the bounding box of the current picture.
draw(box((-1,-1),(3,1.5)),dashed);//,invisible);

parabola p=parabola(F,0.2,90);

// Define the bounding box to draw the parabola.
// Try finalbounds(); to determine the final bounding box.
p.bmin=(-0.75,-0.4);
p.bmax=(2.75,0.75);

draw(box(p.bmin,p.bmax),red);

draw(p,dashed);/* Defered drawing to adjust the path to the final
                  bounding box.*/

draw((path)p,red); /* The path of 'p' is restricted to the box whose
                  the corners are p.bmin, p.bmax.*/
geometry-fig037
Show geometry/fig0370.asy on Github.
Generated with Asymptote 3.00-0.
Categories : Examples 2D | Geometry.asy
Tags : #Geometry | #Line | #Parabola | #Intersection
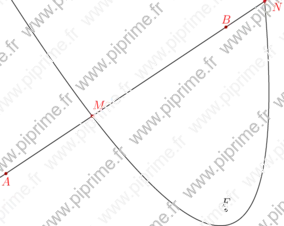
import geometry;
size(10cm);

// currentcoordsys=cartesiansystem((2,1),i=(1,0.5),j=(-0.25,.75));
// show(currentcoordsys);

point A=(-1,-1);
point B=(2,1);
dot("$A$",A,S,red);
dot("$B$",B,N,red);

line l=line(A,B);
draw(l);

point F=(2,-1.5);
dot("$F$",F,N);

parabola p=parabola(F,0.2,110);
draw(p);

/*<asyxml><view file="modules/geometry.asy" type="point[]" signature="intersectionpoints(line,parabola)"/></asyxml>*/
point[] inter=intersectionpoints(l,p);
dot("$M$", inter[0], 2N+E, red);
dot("$N$", inter[1], S+2E, red);
geometry-fig041
Show geometry/fig0410.asy on Github.
Generated with Asymptote 3.00-0.
Categories : Examples 2D | Geometry.asy
Tags : #Geometry | #Line | #Intersection | #Parabola
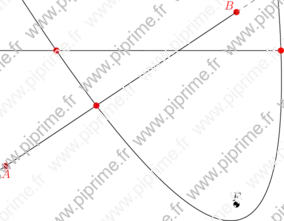
import geometry;
size(10cm);

// currentcoordsys=cartesiansystem((2,1),i=(1,0.5),j=(-0.25,.75));
// show(currentcoordsys);

point A=(-1,-1);
point B=(2,1);
dot("$A$",A,S,red);
dot("$B$",B,NW,red);

line l=line(A,B,false);
line ll=hline()+0.5*B;
draw(l^^ll);
draw(complementary(l),dashed+grey);

point F=(2,-1.5);
dot("$F$",F,N);

parabola p=parabola(F,0.2,110);
draw(p);

dotfactor*=2;

/*<asyxml><view file="modules/geometry.asy" type="point[]" signature="intersectionpoints(line,parabola)"/></asyxml>*/
dot(intersectionpoints(l,p), red);
dot(intersectionpoints(ll,p), red);
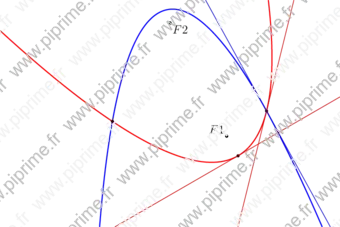
geometry-fig047
Show geometry/fig0470.asy on Github.
Generated with Asymptote 3.00-0.
Categories : Examples 2D | Geometry.asy
Tags : #Geometry | #Line | #Intersection | #Parabola | #Abscissa | #Point | #Tangent
import geometry;
size(12cm);

// currentcoordsys=cartesiansystem((0,0),i=(1,0.5),j=(-0.5,.75));
// show(currentcoordsys, xpen=invisible);

point F1=(0,0);
dot("$F1$",F1,NW);
point F2=(-0.25,0.5);
dot("$F2$",F2,SE);

parabola p=parabola(F1, 0.1, 120);
draw(p, bp+red);

parabola pp=parabola(F2, 0.06, 280);
draw(pp, bp+blue);

abscissa x=angabscissa(180);
dot(point(p,x));
/*<asyxml><view file="modules/geometry.asy" type="line" signature="tangent(parabola,abscissa)"/></asyxml>*/
draw(tangent(p,x), 0.8*red);

point[] P=intersectionpoints(p,pp);
dot(P);

/*<asyxml><view file="modules/geometry.asy" type="line[]" signature="tangents(parabola,point)"/></asyxml>*/
draw(tangents(p,P[0]), 0.8*red);
draw(tangents(pp,P[0]), 0.8*blue);

// Enlarge the bounding box
draw(box((-1,-0.4), (0.5,0.6)),invisible);
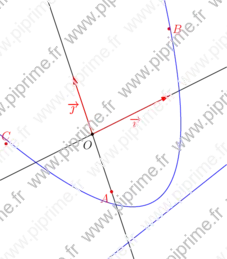
geometry-fig055
Show geometry/fig0550.asy on Github.
Generated with Asymptote 3.00-0.
Categories : Examples 2D | Geometry.asy
Tags : #Geometry | #Coords system | #Parabola | #Point
import geometry;
size(8cm,0);

currentcoordsys=cartesiansystem((2,1),i=(1,0.5),j=(-0.25,.75));
show(currentcoordsys);

// Enlarge the bounding box of the current picture
draw(box(locate((-1,-1.5)),locate((2,1))),invisible);

point A=(0,-1);
point B=(1.25,1);
point C=(-1,0.5);

dot("$A$",A,SW,red);
dot("$B$",B,E,red);
dot("$C$",C,N,red);


line l=rotateO(20)*line((0,0),(1,0));
/*<asyxml><view file="modules/geometry.asy" type="parabola" signature="parabola(point,point,point,line)"/></asyxml>*/
parabola p=parabola(A,B,C,l);
draw(p,blue);
draw(p.D,blue);
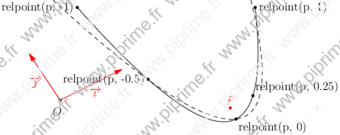
geometry-fig059
Show geometry/fig0590.asy on Github.
Generated with Asymptote 3.00-0.
Categories : Examples 2D | Geometry.asy
Tags : #Geometry | #Parabola | #Abscissa | #Point
import geometry;
size(12cm,0);

currentcoordsys=cartesiansystem((0,0),i=(1,0.5),j=(-0.5,.75));
show(currentcoordsys, xpen=invisible);

point F=(2,-1.5);
dot("$F$",F,N,red);

// Enlarge the bounding box of the current picture.
draw(box((-0.5,-0.4),(4,1.5)),invisible);

parabola p=parabola(F,0.2,90);

// Define the bounding box to draw the parabola.
// Try finalbounds(); to determine the final bounding box.
p.bmin=(-0.5,-0.4);
p.bmax=(3.7,0.75);

draw(p,dashed); /* Defered drawing to adjust the path to the final
                   bounding box.*/

draw((path)p); /* The path of 'p' is restricted to the box whose
                  the corners are p.bmin, p.bmax.*/

/*<asyxml><view file="modules/geometry.asy" type="point" signature="relpoint(explicit parabola,real)"/></asyxml>*/
dot("relpoint(p, 0)",relpoint(p,0),SE);

/*<asyxml><view file="modules/geometry.asy" type="point" signature="point(parabola,abscissa)"/></asyxml>*/
dot("relpoint(p, 0.25)",point(p,Relative(0.25)),NE);
// point(p,Relative(0.25)) can be replaced by relpoint(p,0.25) OR point(p,relabscissa(0.25))

dot("relpoint(p, -0.5)",relpoint(p,-0.5),W);
dot("relpoint(p, -1)",relpoint(p,-1),W);
dot("relpoint(p, 1)",relpoint(p,1),E);
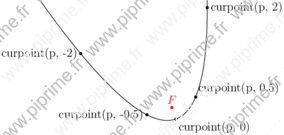
geometry-fig062
Show geometry/fig0620.asy on Github.
Generated with Asymptote 3.00-0.
Categories : Examples 2D | Geometry.asy
Tags : #Geometry | #Parabola | #Abscissa | #Point
import geometry;
size(10cm);

point F=(1,-1.5);
dot("$F$",F,N,red);

parabola p=parabola(F,0.2,110);

draw(p);

/*<asyxml><view file="modules/geometry.asy" type="point" signature="curpoint(explicit parabola,real)"/></asyxml>*/
dot("curpoint(p, 0)",curpoint(p,0),SE);

/*<asyxml><view file="modules/geometry.asy" type="point" signature="point(parabola,abscissa)"/></asyxml>*/
dot("curpoint(p, 0.5)",point(p,curabscissa(0.5)),NE);
// point(p,curabscissa(0.5)) can be replaced by curpoint(p,0.5)

dot("curpoint(p, -0.5)",curpoint(p,-0.5),W);
dot("curpoint(p, -2)",curpoint(p,-2),W);
dot("curpoint(p, 2)",curpoint(p,2),E);
geometry-fig066
Show geometry/fig0660.asy on Github.
Generated with Asymptote 3.00-0.
Categories : Examples 2D | Geometry.asy
Tags : #Geometry | #Abscissa | #Parabola | #Point
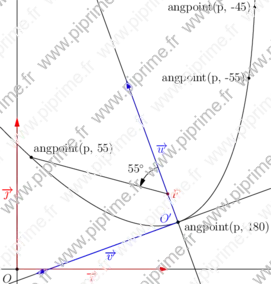
import geometry;
size(10cm);

point F=(1,0.5);
dot("$F$",F,E,red);

parabola p=parabola(F,0.2,110);

draw(p);

coordsys R=currentcoordsys;
show(R);

coordsys Rp=canonicalcartesiansystem(p);
show(Label("$O'$",align=NW+W,blue), Label("$\vec{u}$",blue), Label("$\vec{v}$",blue), Rp, ipen=blue);

/*<asyxml><view file="modules/geometry.asy" type="point" signature="angpoint(explicit parabola,real)"/></asyxml>*/
dot("angpoint(p, 180)",angpoint(p,180),SE+E);

/*<asyxml><view file="modules/geometry.asy" type="point" signature="point(parabola,abscissa)"/></asyxml>*/
point P=point(p,angabscissa(55));
// point(p,angbscissa(0.5)) can be replaced by angpoint(p,0.5)
dot("angpoint(p, 55)",P,NE);

segment s=segment(F,P);
draw(s);
line l=line(F,F+Rp.i);
markangle("$"+(string)degrees(l,s)+"^\circ$",l,(line)s,Arrow);

dot("angpoint(p, -45)",angpoint(p,-45),W);
dot("angpoint(p, -55)",angpoint(p,-55),W);
geometry-fig067
Show geometry/fig0670.asy on Github.
Generated with Asymptote 3.00-0.
Categories : Examples 2D | Geometry.asy
Tags : #Geometry | #Abscissa | #Parabola | #Point | #Arc
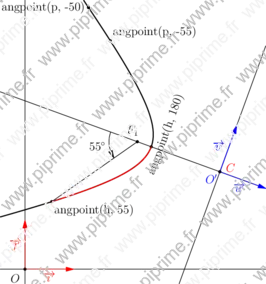
import geometry;
size(10cm);

point C=(4,2);
dot("$C$",C,E+NE,red);

hyperbola h=hyperbola(C,1.5,1,-20);
draw(h, linewidth(bp));

coordsys R=currentcoordsys;
show(R);

coordsys Rp=canonicalcartesiansystem(h);
show(Label("$O'$",align=SW,blue), Label("$\vec{u}$",blue), Label("$\vec{v}$",blue), Rp, ipen=blue);

/*<asyxml><view file="modules/geometry.asy" type="point" signature="angpoint(explicit hyperbola,real,polarconicroutine)"/></asyxml>*/
dot(rotate(70)*"angpoint(h, 180)",angpoint(h,180),E);

/*<asyxml><view file="modules/geometry.asy" type="point" signature="point(hyperbola,abscissa)"/></asyxml>*/
point P=point(h,angabscissa(55));
// point(h,angbscissa(0.5)) can be replaced by angpoint(h,0.5)
dot("angpoint(h, 55)",P,SE);

/*<asyxml><view file="modules/geometry.asy" type="path" signature="arcfromfocus(conic,real,real,int,bool)"/></asyxml>*/
draw(arcfromfocus(h,55,180), bp+red);

segment s=segment(h.F1,P);
draw(s);
dot("$F_1$",h.F1,N+NW);
line l=line(h.F1,h.F1-Rp.i);
markangle("$55^\circ$",l,(line)s,Arrow);

dot("angpoint(p, -50)",angpoint(h,-50),W);
dot("angpoint(p, -55)",angpoint(h,-55),NE);
geometry-fig071
Show geometry/fig0710.asy on Github.
Generated with Asymptote 3.00-0.
Categories : Examples 2D | Geometry.asy
Tags : #Geometry | #Abscissa | #Parabola | #Point
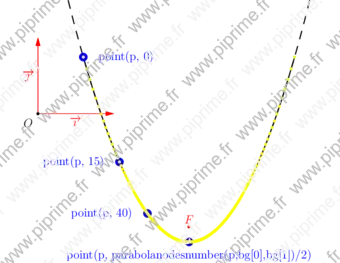
import geometry;
size(12cm);

// currentcoordsys=cartesiansystem((0,0),i=(1,0.5),j=(-0.5,.75));
show(currentcoordsys, xpen=invisible);

point F=(2,-1.5);
dot("$F$",F,N,red);

// Enlarge the bounding box of the current picture.
draw(box((-0.5,-0.4),(4,1.5)),invisible);

parabola p=parabola(F,0.2,90);

draw(p,bp+dashed); /* Defered drawing to adjust the path to the final
                   bounding box.*/

// Define the bounding box to draw the parabola.
// Try finalbounds(); to determine the final bounding box.
p.bmin=(-0.5,-0.4);
p.bmax=(3.7,0.75);
draw((path)p, linewidth(bp)); /* The path of 'p' is restricted to the box whose
                  the corners are p.bmin, p.bmax.*/

/*<asyxml><view file="modules/geometry.asy" type="point" signature="point(explicit parabola,explicit real)"/></asyxml>*/
dot("point(p, 0)", point(p,0),2E,3mm+blue);

dot("point(p, 15)", point(p,15),2W,3mm+blue);

/*<asyxml><view file="modules/geometry.asy" type="abscissa" signature="nodabscissa(real)"/></asyxml>*/
dot("point(p, 40)", point(p,nodabscissa(40)), 2W,3mm+blue);
// point(p,nodabscissa(40)) can be replaced by point(p,40)

/*<asyxml><view file="modules/geometry.asy" type="real[]" signature="bangles(picture,parabola)"/></asyxml>*/
real[] bg=bangles(p);

/*<asyxml><view file="modules/geometry.asy" type="int" signature="parabolanodesnumber(parabola,real,real)"/></asyxml>*/
dot("point(p, parabolanodesnumber(p,bg[0],bg[1])/2)",
    point(p, parabolanodesnumber(p,bg[0],bg[1])/2), S, 3mm+blue);

dot((path)p, yellow);
geometry-fig075
Show geometry/fig0750.asy on Github.
Generated with Asymptote 3.00-0.
Categories : Examples 2D | Geometry.asy
Tags : #Geometry | #Abscissa | #Parabola | #Point/Dot | #Point
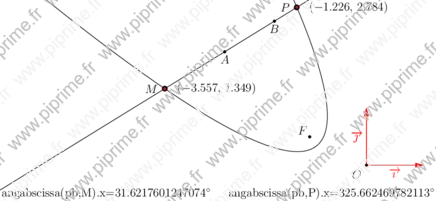
import geometry;
unitsize(2cm);

// currentcoordsys=cartesiansystem((0,0),i=(1,0.5),j=(-0.5,.75));
show(currentcoordsys, xpen=invisible);

point A=(-2.5,2);
dot("$A$",A,S);
point B=A+(cos(0.5),cos(1));
dot("$B$",B,S);

point F=(-1,0.5);
dot("$F$",F,NW);

parabola pb=parabola(F,0.2,130);
draw(pb);
line l=line(A,B);
draw(l);
point M=intersectionpoints(l,pb)[0];
point P=intersectionpoints(l,pb)[1];

/*<asyxml><view file="modules/geometry.asy" type="void" signature="dot(picture,Label,explicit point,align,string,pen)"/></asyxml>*/
dot("",M,2E,linewidth(2mm));
dot("$M$",M,2W);
dot("",P,2E,linewidth(2mm));
dot("$P$",P,2W);

pair p=A-(4,2.5);
transform t=shift((0,-0.3));
transform T=shift((4,0));
real x;

/*<asyxml><view file="modules/geometry.asy" type="abscissa" signature="angabscissa(parabola,point)"/></asyxml>*/
x=angabscissa(pb,M).x;
label("angabscissa(pb,M).x=$"+(string)x+"^\circ$",p,E);
dot(angpoint(pb,x),1mm+red);
x=angabscissa(pb,P).x;
label("angabscissa(pb,P).x=$"+(string)x+"^\circ$",T*p,E);
dot(angpoint(pb,x),1mm+red);

// p=t*p;
// /*<asyxml><view file="modules/geometry.asy" type="abscissa" signature="curabscissa(parabola,point)"/></asyxml>*/
// x=curabscissa(pb,M).x;
// dot(curpoint(pb,x),1mm+red);
// label("curabscissa(pb,M).x="+(string)x,p,E);
// x=curabscissa(pb,P).x;
// label("curabscissa(pb,P).x="+(string)x,T*p,E);
// dot(curpoint(pb,x),1mm+red);

// p=t*p;
// /*<asyxml><view file="modules/geometry.asy" type="abscissa" signature="nodabscissa(parabola,point)"/></asyxml>*/
// x=nodabscissa(pb,M).x;
// label("nodabscissa(pb,M).x="+(string)x,p,E);
// dot(point(pb,x),1mm+red);
// x=nodabscissa(pb,P).x;
// label("nodabscissa(pb,P).x="+(string)x,T*p,E);
// dot(point(pb,x),1mm+red);
geometry-fig076
Show geometry/fig0760.asy on Github.
Generated with Asymptote 3.00-0.
Categories : Examples 2D | Geometry.asy
Tags : #Geometry | #Ellipse | #Draw (2D) | #Circle | #Parabola | #Hyperbola | #Conic | #Intersection
import geometry;
size(12cm);

// currentcoordsys=cartesiansystem((2,1),i=(1,0.5),j=(-0.25,0.75));
// currentcoordsys=cartesiansystem((2,1),i=rotate(45)*(1,0),j=rotate(45)*(0,1));
// show(currentcoordsys);

conic co[];
co[0]=circle((point)(0,0),1);
/*<asyxml><view file="modules/geometry.asy" type="void" signature="draw(picture,Label,explicit conic,align,pen,arrowbar,arrowbar,margin,Label,marker)"/></asyxml>*/
draw(co[0]);

co[1]=ellipse((point)(0,0),4,1);
draw(co[1]);

co[2]=parabola((0,0),1,90);
draw(co[2]);

hyperbola h=hyperbola((-1,0),(1,0),1.2,byvertices);
co[3]=h;
draw(co[3]);
draw(h.A1,grey);
draw(h.A2,grey);

dotfactor *= 1;

for (int i=0; i < 4; ++i) {
  dot(intersectionpoints(h.A1,co[i]),blue);
  dot(intersectionpoints(h.A2,co[i]),blue);
  for (int j=i+1; j < 4; ++j)
    /*<asyxml><view file="modules/geometry.asy" type="point[]" signature="intersectionpoints(conic,conic)"/></asyxml>*/
    dot(intersectionpoints(co[i],co[j]), red);
}