Asymptote Gallery Tagged by “Slopefield” #141
graph-fig032
Show graph/fig0330.asy on Github.
Generated with Asymptote 3.00-0.
Categories : Examples 2D | Graph.asy
Tags : #Graph | #Function (drawing) | #Legend | #Tex/latex features | #Slopefield
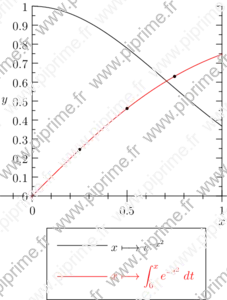
import slopefield;
import graph;
size(8cm,0);
real f(real t) {return exp(-t^2);}
defaultpen();

xlimits( 0,1);
ylimits( 0,1);
yaxis( "$y$" ,LeftRight, RightTicks);
xaxis( "$x$", Ticks());
draw(graph(f,0,1),"$x\longmapsto{}e^{-x^2}$");
draw(curve((0,0),f,(0,0),(1,10)),linecap(0)+red,"$\displaystyle x\longmapsto\int_{0}^{x}e^{-t^2}\;dt$");

//Test with three values calculated with Maxima:
dot((.25,0.13816319508411845*sqrt(pi))^^(.5 , 0.26024993890652326*sqrt(pi)));
dot((.75, 0.3555778168267576*sqrt(pi)));

attach(legend(),point(10S),30S);