Asymptote Gallery Tagged by “Function (implicit)” #139
animations-fig001
Show animations/fig0010.asy on Github.
Generated with Asymptote 3.00-0.
Categories : Animation
Tags : #Animation | #Contour | #Surface | #Function (implicit)
import contour3;
import animate;
// settings.tex="pdflatex";
// settings.outformat="pdf";

size(10cm);
currentprojection=orthographic(15,8,10);
animation A;
A.global=false;

typedef real fct3(real,real,real);
fct3 F(real t)
{
  return new real(real x, real y, real z){return x^2+y^2-t*z^2+t-1;};
}

int n=10;
picture pic;
real tmin=0.1, tmax=2;
real step=(tmax-tmin)/n;
draw(box((-5,-5,-5),(5,5,5)));
for (int i=0; i < n; ++i) {
  save();
  draw(surface(contour3(F(tmin+i*step),(-5,-5,-5),(5,5,5),15)),lightblue);
  pic.erase();
  add(pic,bbox(5mm,FillDraw(lightyellow)));
  A.add(pic);
  restore();
}

A.movie();
graph-fig024
Show graph/fig0250.asy on Github.
Generated with Asymptote 3.00-0.
Categories : Examples 2D | Graph.asy
Tags : #Graph | #Function (drawing) | #Hyperbola | #Contour | #Function (implicit)
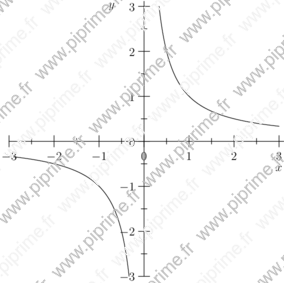
size(10cm,0);
import contour;
import graph;

xlimits( -3, 3);
ylimits( -3, 3);
yaxis( "$y$" , Ticks());
xaxis( "$x$", Ticks());

real f(real x, real y) {return x*y;}

draw(contour(f,(-3,-3),(3,3),new real[] {1}));
graph-fig025
Show graph/fig0260.asy on Github.
Generated with Asymptote 3.00-0.
Categories : Examples 2D | Graph.asy
Tags : #Graph | #Function (drawing) | #Hyperbola | #Contour | #Function (implicit) | #Array
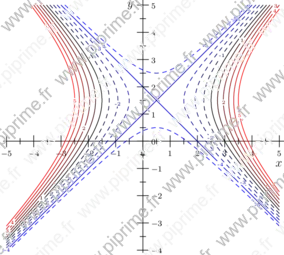
size(10cm,0);
import contour;
import stats;
import graph;

xlimits( -5, 5);
ylimits( -4, 5);
yaxis( "$y$" , Ticks(Label(currentpen+fontsize(8),align=E)));
xaxis( "$x$", Ticks(Label(currentpen+fontsize(8))));

real f(real x, real y) {return x^2-x-y^2+3y-6;}

int min=-5,
  max=5,
  n=max-min+1;

real[] value=sequence(min,max);

pen[] p=sequence(new pen(int i) {
    return (value[i] >= 0 ? solid : dashed) +
    (value[i] >= 0 ? (value[i]/max)*red : (value[i]/min)*blue) +
    fontsize(4);
  },n);

Label[] Labels=sequence(new Label(int i) {
    return Label(value[i] != 0 ? (string) value[i] : "",Relative(unitrand()),(0,0),
                 UnFill(1bp));
  },n);

draw(Labels,contour(f,(-5,-5),(5,5),value),p);
graph3-fig008
Show graph3/fig0080.asy on Github.
Generated with Asymptote 3.00-0.
Categories : Examples 3D | Graph3.asy
Tags : #Graph (3D) | #Surface | #Level set (3D) | #Contour | #Function (implicit)
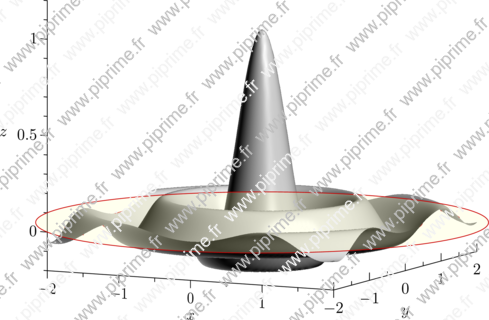
// Adapted from the documentation of Asymptote.
import graph3;
import contour;
texpreamble("\usepackage{icomma}");

size3(12cm, 12cm, 8cm, IgnoreAspect);

real sinc(pair z) {
  real r=2pi*abs(z);
  return r != 0 ? sin(r)/r : 1;
}

limits((-2, -2, -0.2), (2, 2, 1.2));
currentprojection=orthographic(1, -2, 0.5);

xaxis3(rotate(90, X)*"$x$",
       Bounds(Min, Min),
       OutTicks(rotate(90, X)*Label, endlabel=false));

yaxis3("$y$", Bounds(Max, Min), InTicks(Label));
zaxis3("$z$", Bounds(Min, Min), OutTicks());

draw(lift(sinc, contour(sinc, (-2, -2), (2, 2), new real[] {0})), bp+0.8*red);
draw(surface(sinc, (-2, -2), (2, 2), nx=100, Spline), lightgray);

draw(scale3(2*sqrt(2))*unitdisk, paleyellow+opacity(0.25), nolight);
draw(scale3(2*sqrt(2))*unitcircle3, 0.8*red);
graph3-fig009
Show graph3/fig0090.asy on Github.
Generated with Asymptote 3.00-0.
Categories : Examples 3D | Graph3.asy
Tags : #Graph (3D) | #Surface | #Level set (3D) | #Contour | #Function (implicit) | #Palette
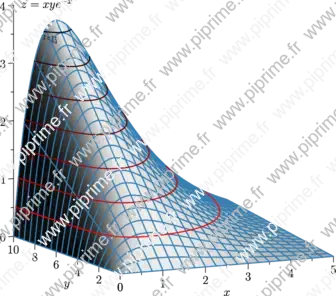
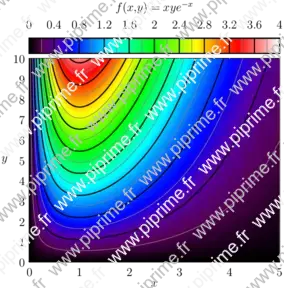
size(12cm,0,false);
import graph3;
import contour;
import palette;

texpreamble("\usepackage{icomma}");

real f(pair z) {return z.x*z.y*exp(-z.x);}

currentprojection=orthographic(-2.5,-5,1);

draw(surface(f,(0,0),(5,10),20,Spline),palegray,bp+rgb(0.2,0.5,0.7));

scale(true);

xaxis3(Label("$x$",MidPoint),OutTicks());
yaxis3(Label("$y$",MidPoint),OutTicks(Step=2));
zaxis3(Label("$z=xye^{-x}$",Relative(1),align=2E),Bounds(Min,Max),OutTicks);

real[] datumz={0.5,1,1.5,2,2.5,3,3.5};

Label[] L=sequence(new Label(int i) {
    return YZ()*(Label(format("$z=%g$",datumz[i]),
                       align=2currentprojection.vector()-1.5Z,Relative(1)));
  },datumz.length);

pen fontsize=bp+fontsize(10);
draw(L,lift(f,contour(f,(0,0),(5,10),datumz)),
     palette(datumz,Gradient(fontsize+red,fontsize+black)));
graph3-fig010
Show graph3/fig0100.asy on Github.
Generated with Asymptote 3.00-0.
Categories : Examples 3D | Graph3.asy
Tags : #Graph | #Contour | #Function (implicit) | #Palette | #Axis | #Array
// From documentation of Asymptote
import graph;
import palette;
import contour;
texpreamble("\usepackage{icomma}");

size(10cm,10cm,IgnoreAspect);

pair a=(0,0);
pair b=(5,10);

real fz(pair z) {
  return z.x*z.y*exp(-z.x);
}
real f(real x, real y) {return fz((x,y));}

int N=200;
int Divs=10;
int divs=2;

defaultpen(1bp);
pen Tickpen=black;
pen tickpen=gray+0.5*linewidth(currentpen);
pen[] Palette=BWRainbow();

scale(false);

bounds range=image(f,Automatic,a,b,N,Palette);

xaxis("$x$",BottomTop,LeftTicks(pTick=grey, ptick=invisible, extend=true));
yaxis("$y$",LeftRight,RightTicks(pTick=grey, ptick=invisible, extend=true));

// Major contours
real[] Cvals;
Cvals=sequence(11)/10 * (range.max-range.min) + range.min;
draw(contour(f,a,b,Cvals,N,operator ..),Tickpen);

// Minor contours
real[] cvals;
real[] sumarr=sequence(1,divs-1)/divs * (range.max-range.min)/Divs;
for (int ival=0; ival < Cvals.length-1; ++ival)
    cvals.append(Cvals[ival]+sumarr);
draw(contour(f,a,b,cvals,N,operator ..),tickpen);

palette("$f(x,y)=xye^{-x}$",range,point(NW)+(0,1),point(NE)+(0,0.25),Top,Palette,
        PaletteTicks(N=Divs,n=divs,Tickpen,tickpen));
graph3-fig011
Show graph3/fig0110.asy on Github.
Generated with Asymptote 3.00-0.
Categories : Examples 3D | Graph3.asy
Tags : #Graph (3D) | #Surface | #Level set (3D) | #Contour | #Function (implicit) | #Palette | #Projection (3D) | #Axis (3D) | #Label (3D) | #Shading (3D) | #Shading
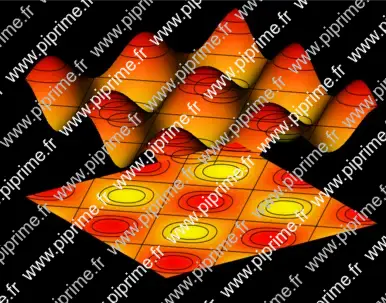
import graph3;
import palette;
import contour;
size(14cm,0);
currentprojection=orthographic(-1,-1.5,0.75);
currentlight=(-1,0,5);

real a=1, b=1;
real f(pair z) { return a*(6+sin(z.x/b)+sin(z.y/b));}
real g(pair z){return f(z)-6a;}

// The axes
limits((0,0,4a),(14,14,8a));
xaxis3(Label("$x$",MidPoint),OutTicks());
yaxis3(Label("$y$",MidPoint),OutTicks(Step=2));
ticklabel relativelabel()
{
  return new string(real x) {return (string)(x-6a);};
}
zaxis3(Label("$z$",Relative(1),align=2E),Bounds(Min,Max),OutTicks(relativelabel()));

// The surface
surface s=surface(f,(0,0),(14,14),100,Spline);

pen[] pens=mean(palette(s.map(zpart),Gradient(yellow,red)));

// Draw the surface
draw(s,pens);
// Project the surface onto the XY plane.
draw(planeproject(unitsquare3)*s,pens,nolight);

// Draw contour for "datumz"
real[] datumz={-1.5, -1, 0, 1, 1.5};
guide[][] pl=contour(g,(0,0),(14,14),datumz);
for (int i=0; i < pl.length; ++i)
  for (int j=0; j < pl[i].length; ++j)
    draw(path3(pl[i][j]));

// Draw the contours on the surface
draw(lift(f,pl));

if(!is3D())
  shipout(bbox(3mm,Fill(black)));