Asymptote Gallery Tagged by “Label” #84
animations-fig017
Show animations/fig0180.asy on Github.
Generated with Asymptote 3.00-0.
Categories : Animation
Tags : #Animation | #Label | #Geometry
import labelpath;
import animate;
animation A;

size(16cm, 0);

usepackage("mathrsfs, amsfonts, amsmath, amssymb");
picture pic, pic1, pic2, pic3;
real u = 1, Y = 2 * pi+0.5;
pair yM = (u, Y * u), ym = (u, -Y * u);
path cle = scale(u) * unitcircle;
path arcg = arc((0, 0), 1.5 * u, 115, 155);

void addtick(picture pic = currentpicture, Label L, pair z, pair dir = E, pen p = currentpen)
{
  transform R = rotate(degrees(dir));
  real width = 1.5mm;
  Label L = L.copy();
  L.position(z);
  L.align(NoAlign, E);
  L.align.dir = R * L.align.dir * 1.3 * width/mm;
  L.p(p);

  pic.add(new void(frame f, transform t) {
      path g = (-width, 0)--(width, 0);
      picture opic;

      draw(opic, shift(t * z) * R * g, p);
      add(f, opic.fit());
    });

  add(pic, L);
}

pair EW(int sign){return sign > 0 ? E : W;}

string pm(int sign){return sign > 0 ? "" : "-";}

pen p(int sign){return sign > 0 ? red : blue;}
pen pw(int sign){return p(sign)+(sign > 0 ? currentpen : white);}

// Define common picture
draw(scale(1.25) * "+", arcg, Arrow());
dot("$0$", point(cle, 0));

draw((-u, 0)--(u, 0)^^(0, -u)--(0, u));
draw("$1$", (0, 0)--point(cle, 1.5), Arrows(FillDraw(white)));

pic.add(currentpicture);// Save the common picture in 'pic'.

// Starting picture 1
draw((u, 0)--yM, linewidth(bp)+p(1), Arrow(TeXHead));
draw(ym--(u, 0), linewidth(bp)+p(-1));
arrow("\underline{Axe des reels}", (u, -0.75 * Y * u), W, 1cm);

real x = 2.2, y = -x, maxe = 2 * pi+0.2;
addtick(Label("$1$", align = E), (u, 1), p(1));
addtick(Label("$\frac{\pi}{2}$", align = E), (u, pi/2), p(1));
addtick(Label("$\pi$", align = E), (u, pi), p(1));
addtick(Label("$\frac{3\pi}{2}$", align = E), (u, 3pi/2), p(1));
addtick(Label("$2\pi$", align = E), (u, 2pi), p(1));
addtick(Label("$-1$", align = W), (u, -1), p(-1));
addtick(Label("$-\frac{\pi}{2}$", align = W), (u, -pi/2), p(-1));
addtick(Label("$-\pi$", align = W), (u, -pi), p(-1));
addtick(Label("$-\frac{3\pi}{2}$", align = W), (u, -3pi/2), p(-1));
addtick(Label("$-2\pi$", align = W), (u, -2pi), p(-1));

draw(Label("$\mathscr{C}$", Relative(0.625)), cle, linewidth(bp));
A.add();
erase();

// Define the common picture for rolling part.
picture picanim(int sign)
{
  picture opic = pic.copy();
  pen pmoins = sign > 0 ? p(-1) : p(-1)+white;
  draw(opic, (u, 0)--yM, bp+white+p(1), Arrow(TeXHead));
  draw(opic, ym--(u, 0), linewidth(bp)+pmoins);
  arrow(opic, "\underline{Axe des reels}", (u, -0.75 * Y * u), W, 1cm);
  addtick(opic, Label("$1$", align = E), (u, 1), white+p(1));
  addtick(opic, Label("$\frac{\pi}{2}$", align = E), (u, pi/2), white+p(1));
  addtick(opic, Label("$\pi$", align = E), (u, pi), white+p(1));
  addtick(opic, Label("$\frac{3\pi}{2}$", align = E), (u, 3pi/2), white+p(1));
  addtick(opic, Label("$2\pi$", align = E), (u, 2 * pi), white+p(1));
  addtick(opic, Label("$-1$", align = W), (u, -1), pmoins);
  addtick(opic, Label("$-\frac{\pi}{2}$", align = W), (u, -pi/2), pmoins);
  addtick(opic, Label("$-\pi$", align = W), (u, -pi), pmoins);
  addtick(opic, Label("$-\frac{3\pi}{2}$", align = W), (u, -3pi/2), pmoins);
  addtick(opic, Label("$-2\pi$", align = W), (u, -2 * pi), pmoins);
  return opic;
}

erase();
pic2 = picanim(1);

int nb = 50; // Number of picture for rolling.
real step = maxe/nb;

for (int sign = 1; sign > -2; sign -= 2) {// Rolling axis part (1 for positive values, -1 for ...);
  guide r1, rpis2, rpi, rpi32, rpi2;
  pair z;

  for (int i = 0; i <= nb ; ++i) {
    real t = sign * i * step; // Where is the tangency.

    if(sign > 0) draw(Label("$\mathscr{C}$", Relative(0.625)), cle, linewidth(bp));
    path tg = i == nb ? cle : arc((0, 0), u, 0, degrees(t)); // The rolled part.
    path g = u * expi(t)--shift(u * expi(t)) * ((Y-abs(t)) * u * expi(sign * pi/2+t)); // The straight part.
    draw(g, linewidth(bp)+p(sign), sign > 0 ? Arrow(TeXHead) : None);

    if(t > 0) {
      if(abs(t) <= 1) {
        z = arcpoint(g, (1-abs(t)) * u);
        addtick(Label(pm(sign) + "$1$", align = EW(sign)), z, expi(sign), p(sign));
        r1 = r1..z;
      } else addtick(Label(pm(sign) + "$1$", align = EW(sign), UnFill),
                     u * (cos(sign), sin(sign)), dir(degrees(sign * 1.0)), p(sign));}

    draw(r1, dashed+p(sign));

    if(abs(t) <= pi/2) {
      z = arcpoint(g, (pi / 2 - abs(t)) * u);
      addtick(Label("$"+pm(sign)+"\frac{\pi}{2}$", align = EW(sign)), z, expi(t), p(sign));
      rpis2 = rpis2..z;
    } else addtick(Label("$"+pm(sign)+"\frac{\pi}{2}$", align = EW(sign), UnFill),
                   (0, sign*u), sign*N, p(sign));

    draw(rpis2, dashed+p(sign));

    if(abs(t) <= pi) {
      z = arcpoint(g, (pi-abs(t))*u);
      addtick(Label("$"+pm(sign)+"\pi$", align = EW(sign)), z, expi(t), p(sign));
      rpi = rpi..z;
    } else addtick(Label("$"+pm(sign)+"\pi$", align = EW(sign), UnFill),
                   (-u, 0), W, p(sign));

    draw(rpi, dashed);

    if(abs(t) <= 3*pi/2) {
      z = arcpoint(g, (3pi/2-abs(t))*u);
      addtick(Label("$"+pm(sign)+"\frac{3\pi}{2}$", align = EW(sign)), z, expi(t), p(sign));
      rpi32 = rpi32..z;
    } else addtick(Label("$"+pm(sign)+"\frac{3\pi}{2}$", align = EW(sign), UnFill),
                   (0, -sign*u), sign*S, p(sign));

    draw(rpi32, dashed+p(sign));

    if(abs(t)-2*pi < -1e-5) {
      z = arcpoint(g, (2*pi-abs(t))*u);
      addtick(Label("$"+pm(sign)+"2\pi$", align = EW(sign)), z, expi(t), p(sign));
      rpi2 = rpi2..z;
    } else addtick(Label("$"+pm(sign)+"2\pi$", align = (sign > 0 ? 2 : 1)*EW(sign), UnFill),
                   (u, 0), E, p(sign));

    draw(rpi2, dashed+p(sign));

    if(i == nb && sign == 1) {
      draw(tg, linewidth(2*bp)+p(sign));
      pic3.add(currentpicture);
      add(pic2);
      pic2 = picanim(-1);
      pic2.add(pic3);
    } else add(pic2); // Add the common picture 'pic2'.

    draw(tg, linewidth(bp) + p(sign));

    A.add();
    if(sign > 0 || i != nb) erase();
  }
}

for (int i = 0; i < 20; ++i) A.add();

// eval(quote{
//     addtick(Label("$-\pi$", align = EW(-1), UnFill), (-u, 0), W, p(-1));
//     addtick(Label("$-2\pi$", align = EW(-1), UnFill), (u, 0), E, p(-1));
//     defaultfilename = 'temp_';
//     shipout(currentpicture.fit(scale(2cm)));}, true);

// pair center = (min(currentpicture) + max(currentpicture)) / 2;
// int n = 20;
// for (int i = 0; i <= n; ++i) {
//   erase();
//   label(scale(1 + 1.25 * i / n) * graphic("temp_.pdf"), i / n * center);
//   A.add();
// }

// for (int i = 0; i < 20; ++i) A.add();
// for (int i = 0; i < 10; ++i) A.add(A.pictures[0]); // Add the first picture in the animation.

erase();

A.movie();
generalities-fig027
![]()
Show generalities/fig0270.asy on Github.
Generated with Asymptote 3.00-0.
Categories : Examples 2D | Generalities
Tags : #Basis | #Point/Dot | #Label | #Position
size(8cm,0);

pair A=(0,0), B=(1,0);

dot("$A$",A,N);
dot("$B$",B,N);
draw(interp(A,B,-.5)--interp(A,B,1.25));
generalities-fig064

Show generalities/fig0640.asy on Github.
Generated with Asymptote 3.00-0.
Categories : Examples 2D | Generalities
Tags : #Basis | #Point/Dot | #Direction | #Label | #Labelmargin
pair O=0;
labelmargin=2;

dot("N",O,N);
dot("S",O,S);
dot("E",O,E);
dot("W",O,W);
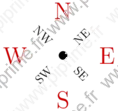
generalities-fig065

Show generalities/fig0650.asy on Github.
Generated with Asymptote 3.00-0.
Categories : Examples 2D | Generalities
Tags : #Basis | #Point/Dot | #Direction | #Label | #Labelmargin
size(10cm,0);

pair O=0;
dot("N",O,10N);
draw("S",O,10S);
draw("E",O,10E);
draw("W",O,10W);

draw("NE",O,5NE);
draw("SE",O,5SE);
draw("NW",O,5NW);
draw("SW",O,5SW);
generalities-fig066
Show generalities/fig0660.asy on Github.
Generated with Asymptote 3.00-0.
Categories : Examples 2D | Generalities
Tags : #Basis | #Point/Dot | #Direction | #Label | #Labelmargin
pair O=0;
draw(scale(2)*Label("N",.8red),O,10*N,linewidth(3mm));
draw(scale(2)*Label("S",.8red),O,10*S);
draw(scale(2)*Label("E",.8red),O,10*E);
draw(scale(2)*Label("W",.8red),O,10*W);

draw(rotate(45)*Label("NE"),O,5NE);
draw(rotate(-45)*Label("SE"),O,5SE);
draw(rotate(-45)*Label("NW"),O,5NW);
draw(rotate(45)*Label("SW"),O,5SW);
generalities-fig067

Show generalities/fig0670.asy on Github.
Generated with Asymptote 3.00-0.
Categories : Examples 2D | Generalities
Tags : #Basis | #Point/Dot | #Label | #Tex/latex features | #Fraction
pair O=0;
dot(O);
label(scale(5) * "$\frac{\pi^2}{2}$", O);
generalities-fig068

Show generalities/fig0680.asy on Github.
Generated with Asymptote 3.00-0.
Categories : Examples 2D | Generalities
Tags : #Basis | #Point/Dot | #Label | #Tex/latex features | #Fraction | #Align
dot(Label(scale(5) * "$\frac{\pi^2}{2}$", (0,0), align=E));
generalities-fig069
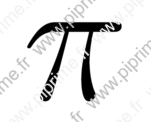
Show generalities/fig0690.asy on Github.
Generated with Asymptote 3.00-0.
Categories : Examples 2D | Generalities
Tags : #Basis | #Label
label(scale(15)*Label("$\pi$"), (0,0));
generalities-fig070
Show generalities/fig0700.asy on Github.
Generated with Asymptote 3.00-0.
Categories : Examples 2D | Generalities
Tags : #Basis | #Label
texpreamble("\usepackage{manfnt}");

label(scale(6)*Label("\textdbend"), (0,0));
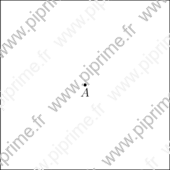
generalities-fig071
![]()
Show generalities/fig0710.asy on Github.
Generated with Asymptote 3.00-0.
Categories : Examples 2D | Generalities
Tags : #Basis | #Point/Dot | #Label | #Tex/latex features | #Align
dot(Label("$A$"), (0,0), S);
generalities-fig072
Show generalities/fig0720.asy on Github.
Generated with Asymptote 3.00-0.
Categories : Examples 2D | Generalities
Tags : #Basis | #Point/Dot | #Label | #Align | #Shipout
size(6cm, 6cm);

dot(Label("$A$"),(0,0),S);
draw(E--W,invisible);
draw(N--S,invisible);

shipout(bbox());
generalities-fig073
![]()
Show generalities/fig0730.asy on Github.
Generated with Asymptote 3.00-0.
Categories : Examples 2D | Generalities
Tags : #Basis | #Point/Dot | #Label | #Tex/latex features | #Align
dot(Label("$A$", fontsize(26pt)), (0,0), NE);
generalities-fig074
![]()
Show generalities/fig0740.asy on Github.
Generated with Asymptote 3.00-0.
Categories : Examples 2D | Generalities
Tags : #Basis | #Point/Dot | #Label | #Tex/latex features | #Align | #Defaultpen
defaultpen(fontsize(26pt));

dot(Label("$A$"),(0,0),NE);
dot(Label("$B$"),(2cm,0),NE+N);
generalities-fig075
Show generalities/fig0750.asy on Github.
Generated with Asymptote 3.00-0.
Categories : Examples 2D | Generalities
Tags : #Basis | #Label
label(rotate(45) * scale(5) * "\textbf{Hello}");
generalities-fig076

Show generalities/fig0760.asy on Github.
Generated with Asymptote 3.00-0.
Categories : Examples 2D | Generalities
Tags : #Basis | #Label | #Transform/scale/shift/rotate | #Fill/Unfill
frame f;
label(f,"\textbf{Hello}",yellow,Fill(black));
add(scale(5)*rotate(45)*f);
generalities-fig077

Show generalities/fig0770.asy on Github.
Generated with Asymptote 3.00-0.
Categories : Examples 2D | Generalities
Tags : #Basis | #Label | #Transform/scale/shift/rotate | #Fill/Unfill
frame f;
filldraw(scale(5cm)*unitsquare, black);
label(f,"Hello", 0.8*red, Fill(white));
add(rotate(45) * scale(5) * f, (2.5cm,2.5cm));
generalities-fig078

Show generalities/fig0780.asy on Github.
Generated with Asymptote 3.00-0.
Categories : Examples 2D | Generalities
Tags : #Basis | #Label | #Layer
label(scale(5)*"\textbf{Cancel}");
draw((min(currentpicture).x,0)--(max(currentpicture).x,0), 6bp + red * 0.8);
generalities-fig079

Show generalities/fig0790.asy on Github.
Generated with Asymptote 3.00-0.
Categories : Examples 2D | Generalities
Tags : #Basis | #Label | #Layer
label(scale(6)*"\textbf{Cancel}");
layer();
draw((min(currentpicture).x,0)--(max(currentpicture).x,0), 6bp + red * 0.8);
generalities-fig085
Show generalities/fig0850.asy on Github.
Generated with Asymptote 3.00-0.
Categories : Examples 2D | Generalities
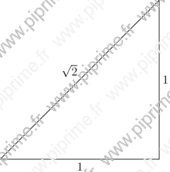
Tags : #Basis | #Label | #Path
size(6cm,0);
pair A=0, B=(1,0), C=(1,1);

draw("$1$",A--B);
draw("$1$",B--C);
draw("$\sqrt{2}$",C--A);
generalities-fig086
Show generalities/fig0860.asy on Github.
Generated with Asymptote 3.00-0.
Categories : Examples 2D | Generalities
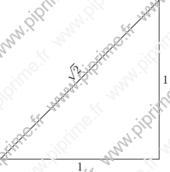
Tags : #Basis | #Label | #Path | #Tex/latex features | #Align | #Rotate
size(6cm,0);
pair A=0, B=(1,0), C=(1,1);

draw("$1$",A--B);
draw("$1$",B--C);

// draw(rotate(dir(C--A))*"$\sqrt{2}$",C--A);
draw(Label("$\sqrt{2}$",Rotate(-dir(C--A))),C--A);
generalities-fig087
Show generalities/fig0870.asy on Github.
Generated with Asymptote 3.00-0.
Categories : Examples 2D | Generalities
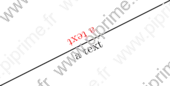
Tags : #Basis | #Label | #Path | #Align | #Rotate
size(6cm,0);
path g=(1,1)--(3,2);
draw(Label("a text",Rotate(dir(g))), g);
draw(Label("a text",red,Rotate(-dir(g)),align=I*dir(g)), g);
generalities-fig090
Show generalities/fig0900.asy on Github.
Generated with Asymptote 3.00-0.
Categories : Examples 2D | Generalities
Tags : #Basis | #Object | #Label
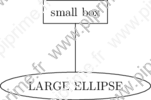
// Author: John Bowman
size(0, 100);
real margin=2mm;
pair z1=(0,1);
pair z0=(0,0);

object label1=draw("small box",box,z1,margin);
object label0=draw("LARGE ELLIPSE",ellipse,z0,margin);

add(new void(frame f, transform t) {
    draw(f,point(label1,S,t)--point(label0,N,t));
  });
generalities-fig104
Show generalities/fig1040.asy on Github.
Generated with Asymptote 3.00-0.
Categories : Examples 2D | Generalities
Tags : #Basis | #Loop/for/while | #Fill/Unfill | #Arc | #Label | #Number format | #Align
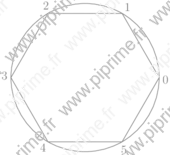
size(6cm,0);

real a=360/6;
for (int i = -1; i < 5; ++i)
  draw(Label(format("%i",i+1)),arc((0,0),10,i*a,(i+1)*a)--cycle,grey);
generalities-fig145
Show generalities/fig1460.asy on Github.
Generated with Asymptote 3.00-0.
Categories : Examples 2D | Generalities
Tags : #Basis | #Transform/scale/shift/rotate | #Point/Dot | #Label | #Position
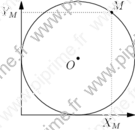
size(0,0);

pair O=(2cm,2cm);
path cle=shift(O)*scale(2cm)*unitcircle;
pair M=point(cle,.6);

dot("$O$",O,SW);
dot("$M$",M,unit(M-O));

draw(cle);
draw((0,0)--(0,4cm),Arrow);
draw((0,0)--(4cm,0),Arrow);

draw(Label("$X_M$",position=EndPoint),M--(xpart(M),0),dotted);
draw(Label("$Y_M$",position=EndPoint),M--(0,ypart(M)),dotted);
generalities-fig154
Show generalities/fig1550.asy on Github.
Generated with Asymptote 3.00-0.
Categories : Examples 2D | Generalities
Tags : #Basis | #Array | #Path | #Loop/for/while | #Direction | #Label
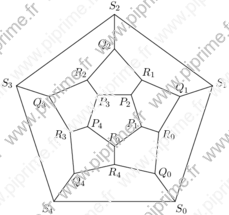
size(0,0);

pair [] P, Q, R, S;
real u=1cm;

for (int i=0; i<=4; ++i)
  P[i] = rotate(i*360/5)*(0,-u);

P[5] = P[0];
for (int i=0; i<=4; ++i)
  Q[i] = 3*midpoint(P[i]--P[i+1]);

Q[5] = Q[0];
for (int i=0; i<=4; ++i)
  R[i] = 1/3*( Q[i] + Q[i+1] + P[i+1] );

R[5] = R[0];
for (int i=0; i<=5; ++i)
  S[i] = 1.5*Q[i];

for (int i=0; i<=4; ++i)
  {
    draw(P[i]   -- P[i+1]);
    draw(P[i+1] -- R[i]);
    draw(Q[i]   -- R[i]);
    draw(R[i]   -- Q[i+1]);
    draw(Q[i]   -- S[i]);
    draw(S[i]   -- S[i+1]);
    label(format("\small$P_%i$",i),P[i],-unit(P[i]));
    label(format("\small$Q_%i$",i),Q[i],rotate(60)*unit(Q[i]));
    label(format("\small$R_%i$",i),R[i],unit(R[i]));
    label(format("\small$S_%i$",i),S[i],unit(S[i]));
  }
generalities-fig157
Show generalities/fig1580.asy on Github.
Generated with Asymptote 3.00-0.
Categories : Examples 2D | Generalities
Tags : #Basis | #Graphic | #Layer | #Label
size(0,0);

label(graphic("dali.eps","width=10cm"));
layer();

draw(scale(2cm)*unitcircle,linewidth(.75mm));
shipout(bbox(.25cm,Fill));
generalities-fig158
Show generalities/fig1590.asy on Github.
Generated with Asymptote 3.00-0.
Categories : Examples 2D | Generalities
Tags : #Basis | #Graphic | #Label
size(0,0);

label(graphic("dali.eps","width=10cm, bb=60 60 235 205, clip=true"));
shipout(bbox(.25cm,Fill));
generalities-fig159
Show generalities/fig1600.asy on Github.
Generated with Asymptote 3.00-0.
Categories : Examples 2D | Generalities
Tags : #Basis | #Number format | #Label | #Tex/latex features
size(0,6cm);

texpreamble("\usepackage{amsmath}
             \DeclareMathOperator{\e}{e}");

pair A=2*expi(pi/3);

draw((0,-2)--(0,2.5));
draw((0,0)--(1,0),linewidth(1mm),Arrow(2mm));
draw((0,0)--(3.5,0));
draw((0,0)--(0,1),linewidth(1mm),Arrow(2mm));

dot(Label("$A(z_a=2\e^{i\frac{\pi}{3}})$"),A,NE);
label(format("$\vert z_a\vert=%.1f$",length(A)),(.5,-1),E);
label(format("$\arg(z_a)\simeq%.4f$",angle(A)),(.5,-2),E);
generalities-fig160
Show generalities/fig1610.asy on Github.
Generated with Asymptote 3.00-0.
Categories : Examples 2D | Generalities
Tags : #Basis | #Number format | #Label | #Tex/latex features
size(10cm,0);

texpreamble("\usepackage{amsmath}
             \DeclareMathOperator{\e}{e}");

pair A=2*expi(pi/3);
pair B=expi(pi/6);
pair C=A*B;
pair D=C-B;
pair Bp=2*B;
pair E=I*D;

draw((0,-2)--(0,2.5));
draw((0,0)--(1,0),linewidth(1mm),Arrow(2mm));
draw((-3,0)--(3.5,0));
draw((0,0)--(0,1),linewidth(1mm),Arrow(2mm));

dot(Label("$A(z_a=2\e^{i\frac{\pi}{3}})$"),A);
dot(Label("$B(z_a=\e^{i\frac{\pi}{6}})$"),B);
dot(Label("$B'(z_{b'}=2z_b)$"),Bp);
dot(Label("$\overline{A}(\overline{z_a})$"),conj(A));
dot(Label("$C(z_c=z_a z_c)$"),C,NE);
dot(Label("$D(z_d=z_c-z_d)$"),D,NW);
dot(Label("$E(z_e=iz_d)$"),E,NW);
generalities-fig167
Show generalities/fig1680.asy on Github.
Generated with Asymptote 3.00-0.
Categories : Examples 2D | Generalities
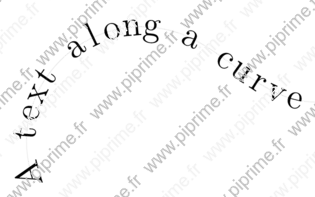
Tags : #Basis | #Path | #Label | #Length
unitsize(5cm);

string text="A text along a curve";
path p=(0,0)..(1,1)..(2,0.5){dir(0)};
int n=length(text);
real at=0;
real step=arclength(p)/n;

for (int i=0; i<n; ++i){
  real t=arctime(p,at);
  label(rotate(degrees(angle(dir(p,t),false)))*scale(3)*baseline(substr(text,i,1)),point(p,t));
  at += step;
 }

draw(p,lightgrey);
generalities-fig168

Show generalities/fig1690.asy on Github.
Generated with Asymptote 3.00-0.
Categories : Examples 2D | Generalities
Tags : #Basis | #Path | #Length | #Label
import labelpath;

unitsize(5cm);
string text="\Huge A text along a curve";
path p=(0,0)..(1,1)..(2,0.5){dir(0)};

labelpath(text,p);
draw(p, lightgrey);
generalities-fig196
Show generalities/fig1980.asy on Github.
Generated with Asymptote 3.00-0.
Categories : Examples 2D | Generalities
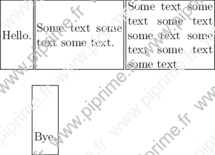
Tags : #Label | #Object | #Picture
void enclose(picture pic=currentpicture, envelope e,
             Label[] L=new Label[],
             real xmargin=0, real ymargin=xmargin, pen p=currentpen,
             filltype filltype=NoFill, bool above=true)
{

  real H;
  real[] h;
  pic.add(new void (frame f, transform t) {
      frame[] d=new frame[];
      for (int i=0; i<L.length; ++i) {
        d[i]=newframe;
        Label LL=L[i].copy();
        add(d[i],t,LL);
        add(f,d[i]);
        h[i]=ypart(max(d[i])-min(d[i]));
        if(H < h[i]) H=h[i];
      }
      for (int i=0; i<L.length; ++i) {
        real emy=(H-h[i])/2;
        e(f,d[i],xmargin,ymargin+emy,p,filltype,above);
      }
    });
}

void box(picture pic=currentpicture, Label[] L=new Label[],
         real xmargin=0, real ymargin=xmargin, pen p=currentpen,
         filltype filltype=NoFill, bool above=true)
{
  enclose(pic,box,L,xmargin,ymargin,p,filltype,above);
}

box(new Label[] {
    Label("\begin{minipage}{3cm}Some text some text some text.\end{minipage}",(2.2cm,0)),
    Label("Hello.",0),
    Label("\begin{minipage}{3cm}Some text some text some
text some text some text some text some text.\end{minipage}",(5.4cm,0)),
    Label("Bye.\rule{0pt}{1.5cm}",(1cm,-3cm))
      });
geometry-fig110
Show geometry/fig1100.asy on Github.
Generated with Asymptote 3.00-0.
Categories : Examples 2D | Geometry.asy
Tags : #Geometry | #Triangle | #Markers | #Label | #Segment
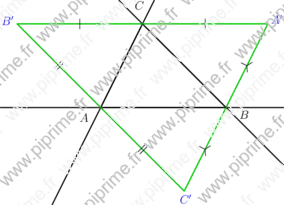
import geometry;
size(10cm,0);

// currentcoordsys=cartesiansystem((2,1),i=(1,0.5),j=(-0.25,0.75));
// show(currentcoordsys);

triangle t=triangle((-1,0), (2,0), (0,2));

drawline(t, linewidth(bp));
/*<asyxml><view file="modules/geometry.asy" type="void" signature="label(picture,Label,Label,Label,triangle,real,real,pen,filltype)"/></asyxml>*/
label(t, alignFactor=4);

/*<asyxml><view file="modules/geometry.asy" type="triangle" signature="anticomplementary(triangle)"/></asyxml>*/
triangle at=anticomplementary(t);
draw(at, bp+0.8green);
label("$A'$", "$B'$", "$C'$", at, blue);

draw(segment(at.AB), bp+0.8green, StickIntervalMarker(2,1));
draw(segment(at.BC), bp+0.8green, StickIntervalMarker(2,2));
draw(segment(at.CA), bp+0.8green, CrossIntervalMarker(2,3));
geometry-fig111
Show geometry/fig1110.asy on Github.
Generated with Asymptote 3.00-0.
Categories : Examples 2D | Geometry.asy
Tags : #Geometry | #Triangle | #Circle | #Tangent | #Line | #Label | #Point
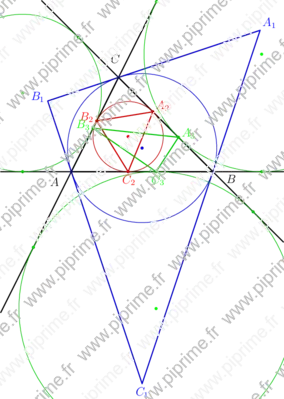
import geometry;
size(10cm,0);

// currentcoordsys=cartesiansystem((2,1),i=(1,0.5),j=(-0.25,0.75));
// show(currentcoordsys);

triangle t=triangle((-1,0), (2,0), (0,2));

/*<asyxml><view file="modules/geometry.asy" type="void" signature="drawline(picture,triangle,pen)"/></asyxml>*/
drawline(t, linewidth(bp));
/*<asyxml><view file="modules/geometry.asy" type="void" signature="label(picture,Label,Label,Label,triangle,real,real,pen,filltype)"/></asyxml>*/
label(t,alignFactor=4);

/*<asyxml><view file="modules/geometry.asy" type="circle" signature="circle(triangle)"/></asyxml>*/
circle cc=circle(t);
draw(cc, 0.8blue);
dot(cc.C, blue);
/*<asyxml><view file="modules/geometry.asy" type="triangle" signature="tangential(triangle)"/></asyxml>*/
triangle tgt=tangential(t);
draw(tgt, bp+0.8blue);
label("$A_1$", "$B_1$", "$C_1$", tgt, blue);

/*<asyxml><view file="modules/geometry.asy" type="circle" signature="incircle(triangle)"/></asyxml>*/
circle ic=incircle(t);
draw(ic, 0.8red);
dot(ic.C, red);
triangle intouch=intouch(t);
draw(intouch, bp+0.8red);
label("$A_2$", "$B_2$", "$C_2$", intouch, red);

/*<asyxml><view file="modules/geometry.asy" type="circle" signature="excircle(side,triangle)"/></asyxml>*/
circle ec=excircle(t.AB);
clipdraw(ec, 0.8green);
dot(ec.C, green);

ec=excircle(t.AC);
clipdraw(ec, 0.8green);
dot(ec.C, green);

ec=excircle(t.BC);
clipdraw(ec, 0.8green);
dot(ec.C, green);

/*<asyxml><view file="modules/geometry.asy" type="triangle" signature="extouch(triangle)"/></asyxml>*/
triangle ext=extouch(t);
draw(ext, bp+0.8green);
label("$A_3$", "$B_3$", "$C_3$", ext, green);

/*<asyxml><view file="modules/geometry.asy" type="point" signature="extouch(side)"/></asyxml>*/
dot(extouch(t.AB), 0.8*green);
dot(extouch(t.BC), 0.8*green);
dot(extouch(t.CA), 0.8*green);

/*<asyxml><view file="modules/geometry.asy" type="point" signature="intouch(side)"/></asyxml>*/
dot(intouch(t.AB), 0.8*red);
dot(intouch(t.BC), 0.8*red);
dot(intouch(t.CA), 0.8*red);

// Enlarge the bounding box of the current picture
draw(box((-2.5,-3), (3.5,3.5)), invisible);
geometry-fig112
Show geometry/fig1120.asy on Github.
Generated with Asymptote 3.00-0.
Categories : Examples 2D | Geometry.asy
Tags : #Geometry | #Triangle | #Line | #Label | #Point | #Markers
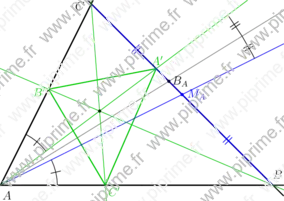
import geometry;
size(10cm,0);

// currentcoordsys=cartesiansystem((2,1),i=(1,0.5),j=(-0.25,0.75));
// show(currentcoordsys);

triangle t=triangle((-1,0), (2,0), (0,2));

drawline(t, linewidth(bp));
label(t,alignFactor=2, alignAngle=90);

/*<asyxml><view file="modules/geometry.asy" type="triangle" signature="symmedial(triangle)"/></asyxml>*/
triangle st=symmedial(t);
draw(st, bp+0.8green);
label("$A'$", "$B'$", "$C'$", st, alignAngle=45, 0.8green);

/*<asyxml><view file="modules/geometry.asy" type="line" signature="median(vertex)"/></asyxml>*/
line mA=median(t.VA);
draw(mA, blue);
dot("$M_A$",midpoint(t.BC), 1.5E, blue);
draw(segment(t.BC), bp+blue, StickIntervalMarker(2,2,blue));

/*<asyxml><view file="modules/geometry.asy" type="line" signature="bisector(vertex,real)"/></asyxml>*/
line bA=bisector(t.VA);
draw(bA, grey);
/*<asyxml><view file="modules/geometry.asy" type="point" signature="bisectorpoint(side)"/></asyxml>*/
dot("$B_A$", bisectorpoint(t.BC));

/*<asyxml><view file="modules/geometry.asy" type="line" signature="symmedian(vertex)"/></asyxml>*/
line sA=symmedian(t.VA);
draw(sA, 0.8*green);

draw(symmedian(t.VB), 0.8*green);
draw(symmedian(t.VC), 0.8*green);

/*<asyxml><view file="modules/geometry.asy" type="point" signature="symmedian(triangle)"/></asyxml>*/
point sP=symmedian(t);
dot(sP);

markangle(sA, (line) t.AC, radius=2cm, StickIntervalMarker(1,1));
markangle((line) t.AB, mA, radius=2cm, StickIntervalMarker(1,1));
markangle(mA, sA, radius=10cm, StickIntervalMarker(2,2));
graph-fig011
Show graph/fig0120.asy on Github.
Generated with Asymptote 3.00-0.
Categories : Examples 2D | Graph.asy
Tags : #Graph | #Axis | #Label
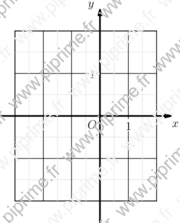
size(6cm,0);
import graph;

xlimits( -3, 3);
ylimits( -3, 3);
xaxis(Ticks("%"));
yaxis(Ticks("%"));

labelx(1,2S);
labely(1,2W);
labelx("$O$",0,SW);
dot((0,0));
graph-fig012
Show graph/fig0130.asy on Github.
Generated with Asymptote 3.00-0.
Categories : Examples 2D | Graph.asy
Tags : #Graph | #Axis | #Label
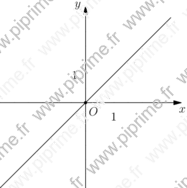
import graph;

unitsize(x=1cm);
real f(real x){return x;}
xlimits( -3, 3);
ylimits( -3, 3);
draw(graph(f,-3,3));
xaxis(Label("$x$",position=EndPoint, align=SE),Ticks("%",extend=true), Arrow);
yaxis(Label("$y$",position=EndPoint, align=NW),Ticks("%",extend=true), Arrow);

labelx(1,2S);
labely(1,2W);
labelx("$O$",0,SE);
dot((0,0));
graph-fig013
Show graph/fig0140.asy on Github.
Generated with Asymptote 3.00-0.
Categories : Examples 2D | Graph.asy
Tags : #Graph | #Axis | #Label
unitsize(x=1cm);
import graph;

xlimits( -3, 2);
ylimits( -3, 3);
xaxis(xmin=-3, xmax=2,Ticks("%"));
yaxis(ymin=-3, ymax=3, Ticks("%"));

labelx(1,2S);
labely(1,2W);
labelx("$O$",0,SW);
dot((0,0));
draw(Label("$x$",position=Relative(1),align=2S),(currentpicture.userMin().x-1,0)--(currentpicture.userMax().x+1,0),Arrow);
draw(Label("$y$",position=Relative(1),align=2W),(0,currentpicture.userMin().y-1)--(0,currentpicture.userMax().y+1),Arrow);
graph-fig014
Show graph/fig0150.asy on Github.
Generated with Asymptote 3.00-0.
Categories : Examples 2D | Graph.asy
Tags : #Graph | #Axis | #Label
import graph;
unitsize(1cm);

xlimits( -3, 2);
ylimits( -3, 3);
xaxis("$x$",Ticks("%",begin=false, end=false),arrow=Arrow);
yaxis("$y$",Ticks("%",begin=false, end=false),arrow=Arrow);

labelx(1,2S);
labely(1,2W);
labelx("$O$",0,SW);
dot((0,0));
graph-fig015
Show graph/fig0160.asy on Github.
Generated with Asymptote 3.00-0.
Categories : Examples 2D | Graph.asy
Tags : #Graph | #Axis | #Label
import graph;
unitsize(1cm);

xlimits( -3, 2);
ylimits( -3, 3);
xaxis("$x$",Ticks(ticklabel=NoZeroFormat,1bp+red,end=false),arrow=Arrow);
yaxis("$y$",Ticks(ticklabel=NoZeroFormat,1bp+red,end=false),arrow=Arrow);

labelx(scale(.75)*"$O$",0,SW);
graph-fig016
Show graph/fig0170.asy on Github.
Generated with Asymptote 3.00-0.
Categories : Examples 2D | Graph.asy
Tags : #Graph | #Axis | #Label
import graph;
unitsize(1cm);

xlimits( -3, 2);
ylimits( -3, 3);
xaxis("$x$",Ticks(modify=NoZero,1bp+red,end=false),arrow=Arrow);
yaxis("$y$",Ticks(modify=NoZero,1bp+red,end=false),arrow=Arrow);

labelx(scale(.75)*"$O$",0,SW);
graph-fig017
Show graph/fig0180.asy on Github.
Generated with Asymptote 3.00-0.
Categories : Examples 2D | Graph.asy
Tags : #Graph | #Axis | #Label
import graph;
unitsize(1cm);

xlimits( -3, 2);
ylimits( -3, 3);

xaxis("$x$", Ticks(ticklabel=OmitFormat(-2,-1,2),
                   modify=NoZero,
                   1bp+red,
                   end=false),
      arrow=Arrow);

yaxis("$y$", Ticks(ticklabel=OmitFormat(-2,-1,2,3),
                   modify=NoZero,
                   1bp+red,
                   end=false),
      arrow=Arrow);

labelx(scale(.75)*"$O$",0,SW);
graph-fig018
Show graph/fig0190.asy on Github.
Generated with Asymptote 3.00-0.
Categories : Examples 2D | Graph.asy
Tags : #Graph | #Axis | #Label | #Grid
import graph;
unitsize(x=1cm, y=1.5cm);

xlimits( -3, 2);
ylimits( -2, 2);
xaxis(BottomTop, Ticks("%",extend=true, ptick=lightgrey));
yaxis(LeftRight, Ticks("%",extend=true, ptick=lightgrey));
xequals(Label("$y$",align=2NW),0,ymin=-2.5, ymax=2.5, p=linewidth(1.5pt), Arrow(2mm));
yequals(Label("$x$",align=2SE),0,xmin=-3.5, xmax=2.5, p=linewidth(1.5pt), Arrow(2mm));
labelx(Label("$1$",UnFill), 1);
labely(Label("$1$",UnFill), 1);
labelx("$O$",0,SW);
dot((0,0));
graph-fig019
Show graph/fig0200.asy on Github.
Generated with Asymptote 3.00-0.
Categories : Examples 2D | Graph.asy
Tags : #Graph | #Axis | #Label | #Grid | #Vector
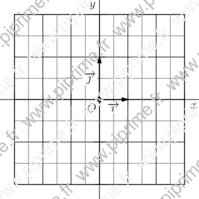
import graph;

void graphicrules(picture pic=currentpicture, string prefix=defaultfilename, real unit=1cm,
                  real xunit=unit != 0 ? unit : 0,
                  real yunit=unit != 0 ? unit : 0,
                  real xmin, real xmax, real ymin, real ymax)
{
  xlimits(xmin, xmax);
  ylimits(ymin, ymax);
  unitsize(x=xunit, y=yunit);
}

void grid(picture pic=currentpicture,
          real xmin=pic.userMin().x, real xmax=pic.userMax().x,
          real ymin=pic.userMin().y, real ymax=pic.userMax().y,
          real xStep=1, real xstep=.5,
          real yStep=1, real ystep=.5,
          pen pTick=nullpen, pen ptick=grey, bool above=false)
{
  draw(pic,box((xmin,ymin),(xmax,ymax)),invisible);
  xaxis(pic, BottomTop, xmin, xmax, Ticks("%",extend=true,Step=xStep,step=xstep,pTick=pTick,ptick=ptick), above=above);
  yaxis(pic, LeftRight, ymin, ymax, Ticks("%",extend=true,Step=yStep,step=ystep,pTick=pTick,ptick=ptick), above=above);
}

void cartesianaxis(picture pic=currentpicture,
                   Label Lx=Label("$x$",align=S),
                   Label Ly=Label("$y$",align=W),
                   real xmin=pic.userMin().x, real xmax=pic.userMax().x,
                   real ymin=pic.userMin().y, real ymax=pic.userMax().y,
                   real extrawidth=1, real extraheight=extrawidth,
                   pen p=currentpen,
                   ticks xticks=Ticks("%",pTick=nullpen, ptick=grey),
                   ticks yticks=Ticks("%",pTick=nullpen, ptick=grey),
                   bool above=true,
                   arrowbar arrow=Arrow)
{
  extraheight= cm*extraheight/(2*pic.yunitsize);
  extrawidth = cm*extrawidth/(2*pic.xunitsize);
  yequals(pic, Lx, 0, xmin-extrawidth, xmax+extrawidth, p, above, arrow=arrow);
  xequals(pic, Ly, 0, ymin-extraheight, ymax+extraheight, p, above, arrow=arrow);
  yequals(pic, 0, xmin, xmax, p, xticks, above);
  xequals(pic, 0, ymin, ymax, p, yticks, above);
}

void labeloij(picture pic=currentpicture,
              Label Lo=Label("$O$",NoFill),
              Label Li=Label("$\vec{\imath}$",NoFill),
              Label Lj=Label("$\vec{\jmath}$",NoFill),
              pair diro=SW, pair diri=S, pair dirj=W,
              pen p=scale(2)*currentpen,
              filltype filltype=NoFill, arrowbar arrow=Arrow(2mm))
{
  if (Lo.filltype==NoFill) Lo.filltype=filltype;
  if (Li.filltype==NoFill) Li.filltype=filltype;
  if (Lj.filltype==NoFill) Lj.filltype=filltype;
  labelx(pic, Lo, 0, diro, p);
  draw(pic, Li, (0,0)--(1,0), diri, p, arrow);
  draw(pic, Lj, (0,0)--(0,1), dirj, p, arrow);
  dot(pic, (0,0), dotsize(p)+p);
}

//The figure starts here
graphicrules(yunit=1.5cm, xmin=-3, xmax=3, ymin=-2, ymax=2);
grid();
cartesianaxis(arrow=None);
labeloij(UnFill);
graph-fig022
Show graph/fig0230.asy on Github.
Generated with Asymptote 3.00-0.
Categories : Examples 2D | Graph.asy
Tags : #Graph | #Function (drawing) | #Fraction | #Label | #Tex/latex features | #Struct
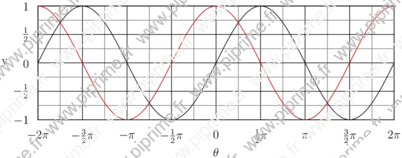
import graph;
unitsize(x=1cm,y=2cm);

struct rational
{
  int p;
  int q;
  real ep=1/10^5;
};

rational operator init() {return new rational;}

rational rational(real x, real ep=1/10^5)
{
  rational orat;
  int q=1;
  while (abs(round(q*x)-q*x)>ep)
    {
      ++q;
    }
  orat.p=round(q*x);
  orat.q=q;
  orat.ep=ep;
  return orat;
}

int pgcd(int a, int b)
{
  int a_=abs(a), b_=abs(b), r=a_;
  if (b_>a_) {a_=b_; b_=r; r=a_;}
  while (r>0)
    {
      r=a_%b_;
      a_=b_;
      b_=r;
    }
  return a_;
}

string texfrac(int p, int q,
               string factor="",
               bool signin=false, bool factorin=true,
               bool displaystyle=false,
               bool zero=true)
{
  if (p==0) return (zero ? "$0$" : "");
  string disp= displaystyle ? "$\displaystyle " : "$";
  int pgcd=pgcd(p,q);
  int num= round(p/pgcd), den= round(q/pgcd);
  string nums;
  if (num==1)
    if (factor=="" || (!factorin && (den !=1))) nums="1"; else nums="";
  else
    if (num==-1)
      if (factor=="" || (!factorin && (den !=1))) nums="-1"; else nums="-";
    else nums= (string) num;
  if (den==1) return "$" + nums + factor + "$";
  else
    {
      string dens= (den==1) ? "" : (string) den;
      if (signin || num>0)
        if (factorin)
          return disp + "\frac{" + nums + factor + "}{" + (string) dens + "}$";
        else
          return disp + "\frac{" + nums + "}{" + (string) dens + "}"+ factor + "$";
      else
        {
          if (num==-1)
            if (factor=="" || !factorin) nums="1"; else nums="";
          else nums=(string)(abs(num));
        if (factorin)
          return disp + "-\frac{" + nums + factor + "}{" + (string) dens + "}$";
        else
          return disp + "-\frac{" + nums + "}{" + (string) dens + "}"+ factor + "$";
        }
    }
}

string texfrac(rational x,
               string factor="",
               bool signin=false, bool factorin=true,
               bool displaystyle=false,
               bool zero=true)
{
  return texfrac(x.p, x.q, factor, signin, factorin, displaystyle, zero);
}

ticklabel labelfrac(real ep=1/10^5, real factor=1.0,
                    string symbol="",
                    bool signin=false, bool symbolin=true,
                    bool displaystyle=false,
                    bool zero=true)
{
  return new string(real x)
    {
      return texfrac(rational(x/factor), symbol, signin, symbolin, displaystyle, zero);
    };
}

ticklabel labelfrac=labelfrac();

xlimits( -2pi, 2pi);
ylimits( -1, 1);

yaxis("y",LeftRight , Ticks(labelfrac,Step=.5,step=.25, ptick=grey, extend=true));

xaxis("$\theta$",BottomTop, Ticks(labelfrac(factor=pi,symbol="\pi",symbolin=false),
                           Step=pi/2, step=pi/4, ptick=grey, extend=true));

draw(graph(new real(real x){return sin(x);},-2pi,2pi));
draw(graph(new real(real x){return cos(x);},-2pi,2pi), .8red);
graph-fig023
Show graph/fig0240.asy on Github.
Generated with Asymptote 3.00-0.
Categories : Examples 2D | Graph.asy
Tags : #Graph | #Function (drawing) | #Fraction | #Label | #Tex/latex features | #Struct
import graph;

// public real xunit=1cm,yunit=1cm;

void graphicrules(picture pic=currentpicture, string prefix=defaultfilename, real unit=1cm,
                  real xunit=unit != 0 ? unit : 0,
                  real yunit=unit != 0 ? unit : 0,
                  real xmin, real xmax, real ymin, real ymax)
{
  xlimits(xmin, xmax);
  ylimits(ymin, ymax);
  unitsize(x=xunit, y=yunit);
}

struct rational
{
  int p;
  int q;
  real ep=1/10^5;
};

rational operator init() {return new rational;}

rational rational(real x, real ep=1/10^5)
{
  rational orat;
  int q=1;
  while (abs(round(q*x)-q*x)>ep)
    {
      ++q;
    }
  orat.p=round(q*x);
  orat.q=q;
  orat.ep=ep;
  return orat;
}

int pgcd(int a, int b)
{
  int a_=abs(a), b_=abs(b), r=a_;
  if (b_>a_) {a_=b_; b_=r; r=a_;}
  while (r>0)
    {
      r=a_%b_;
      a_=b_;
      b_=r;
    }
  return a_;
}

string texfrac(int p, int q,
               string factor="",
               bool signin=false, bool factorin=true,
               bool displaystyle=false,
               bool zero=true)
{
  if (p==0) return (zero ? "$0$" : "");
  string disp= displaystyle ? "$\displaystyle " : "$";
  int pgcd=pgcd(p,q);
  int num= round(p/pgcd), den= round(q/pgcd);
  string nums;
  if (num==1)
    if (factor=="" || (!factorin && (den !=1))) nums="1"; else nums="";
  else
    if (num==-1)
      if (factor=="" || (!factorin && (den !=1))) nums="-1"; else nums="-";
    else nums= (string) num;
  if (den==1) return "$" + nums + factor + "$";
  else
    {
      string dens= (den==1) ? "" : (string) den;
      if (signin || num>0)
        if (factorin)
          return disp + "\frac{" + nums + factor + "}{" + (string) dens + "}$";
        else
          return disp + "\frac{" + nums + "}{" + (string) dens + "}"+ factor + "$";
      else
        {
          if (num==-1)
            if (factor=="" || !factorin) nums="1"; else nums="";
          else nums=(string)(abs(num));
          if (factorin)
            return disp + "-\frac{" + nums + factor + "}{" + (string) dens + "}$";
          else
            return disp + "-\frac{" + nums + "}{" + (string) dens + "}"+ factor + "$";
        }
    }
}

string texfrac(rational x,
               string factor="",
               bool signin=false, bool factorin=true,
               bool displaystyle=false,
               bool zero=true)
{
  return texfrac(x.p, x.q, factor, signin, factorin, displaystyle, zero);
}

ticklabel labelfrac(real ep=1/10^5, real factor=1.0,
                    string symbol="",
                    bool signin=false, bool symbolin=true,
                    bool displaystyle=false,
                    bool zero=true)
{
  return new string(real x)
    {
      return texfrac(rational(x/factor), symbol, signin, symbolin, displaystyle, zero);
    };
}

ticklabel labelfrac=labelfrac();

void grid(picture pic=currentpicture,
          real xmin=pic.userMin().x, real xmax=pic.userMax().x,
          real ymin=pic.userMin().y, real ymax=pic.userMax().y,
          real xStep=1, real xstep=.5,
          real yStep=1, real ystep=.5,
          pen pTick=nullpen, pen ptick=grey, bool above=true)
{
  xaxis(pic, BottomTop, xmin, xmax, Ticks("%",extend=true,Step=xStep,step=xstep,pTick=pTick,ptick=ptick), above=above);
  yaxis(pic, LeftRight, ymin, ymax, Ticks("%",extend=true,Step=yStep,step=ystep,pTick=pTick,ptick=ptick), above=above);
}

void cartesianaxis(picture pic=currentpicture,
                   Label Lx=Label("$x$",align=S),
                   Label Ly=Label("$y$",align=W),
                   real xmin=pic.userMin().x, real xmax=pic.userMax().x,
                   real ymin=pic.userMin().y, real ymax=pic.userMax().y,
                   real extrawidth=1, real extraheight=extrawidth,
                   pen p=currentpen,
                   ticks xticks=Ticks("%",pTick=nullpen, ptick=grey),
                   ticks yticks=Ticks("%",pTick=nullpen, ptick=grey),
                   bool above=true,
                   arrowbar arrow=Arrow)
{
  extraheight= cm*extraheight/(2*pic.yunitsize);
  extrawidth = cm*extrawidth/(2*pic.xunitsize);
  yequals(pic, Lx, 0, xmin-extrawidth, xmax+extrawidth, p, above, arrow=arrow);
  yequals(pic, 0, xmin, xmax, p, xticks, above);
  xequals(pic, Ly, 0, ymin-extraheight, ymax+extraheight, p, above, arrow=arrow);
  xequals(pic, 0, ymin, ymax, p, yticks, above);
}

void labeloij(picture pic=currentpicture,
              Label Lo=Label("$O$",NoFill),
              Label Li=Label("$\vec{\imath}$",NoFill),
              Label Lj=Label("$\vec{\jmath}$",NoFill),
              pair diro=SW, pair diri=S, pair dirj=W,
              pen p=scale(2)*currentpen,
              filltype filltype=NoFill, arrowbar arrow=Arrow(2mm))
{
  if (Lo.filltype==NoFill) Lo.filltype=filltype;
  if (Li.filltype==NoFill) Li.filltype=filltype;
  if (Lj.filltype==NoFill) Lj.filltype=filltype;
  labelx(pic, Lo, 0, diro, p);
  draw(pic, Li, (0,0)--(1,0), diri, p, arrow);
  draw(pic, Lj, (0,0)--(0,1), dirj, p, arrow);
  dot(pic, (0,0), dotsize(p)+p);
}

void labeloIJ(picture pic=currentpicture,
              Label Lo=Label("$O$",NoFill),
              Label LI=Label("$I$",NoFill),
              Label LJ=Label("$J$",NoFill),
              pair diro=SW, pair dirI=S, pair dirJ=W,
              pen p=currentpen,
              filltype filltype=NoFill, arrowbar arrow=Arrow)
{
  if (Lo.filltype==NoFill) Lo.filltype=filltype;
  if (LI.filltype==NoFill) LI.filltype=filltype;
  if (LJ.filltype==NoFill) LJ.filltype=filltype;
  labelx(pic, LI, 1, dirI, p);
  labely(pic, LJ, 1, dirJ, p);
  labelx(pic, Lo, 0, diro, p);
  dot(pic, (0,0), dotsize(p)+p);
}

graphicrules(xunit=1cm, yunit=3cm,
             xmin=-2pi, xmax=2pi, ymin=-1, ymax=1);
grid(xStep=pi/2, xstep=pi/4, yStep=.5, ystep=.25);
cartesianaxis(xticks=Ticks(Label(UnFill),labelfrac(factor=pi,symbol="\pi",symbolin=true, zero=false),Step=pi/2, step=pi/4, ptick=grey),
              yticks=Ticks(Label(UnFill),labelfrac(zero=false),Step=.5,step=.25, ptick=grey), arrow=None);
dot("$O$",(0,0),2SW);
opacity-fig018

Show opacity/fig0180.asy on Github.
Generated with Asymptote 3.00-0.
Categories : Examples 2D | Opacity
Tags : #Opacity | #Layer | #Label | #Fill/Unfill | #Shipout | #Bbox | #Shading
size(4cm,0);
dotfactor*=5;

dot(scale(2)*"A",(0.5,1),5N);

layer();

dot(scale(2)*"B",(1.5,1),5N);
filldraw(scale(2)*unitsquare, lightgray+opacity(.5));

shipout(bbox(5mm,black,RadialShade(lightblue,darkblue)), "pdf");