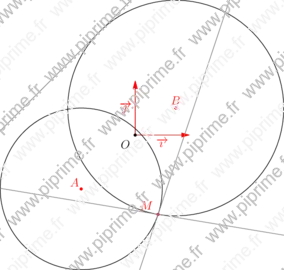
Asymptote Gallery Tagged by “Tangent” #134
animations-fig010
Show animations/fig0110.asy on Github.
Generated with Asymptote 3.00-0.
Categories : Animation
Tags : #Ellipse | #Tangent | #Geometry | #Animation
import geometry;
import animate;
// settings.tex="pdflatex";
// settings.outformat="pdf";

animation anim;
size(12cm);

point F1=(0, 0), F2=(0, -3);
dot("F", F1);

ellipse el1=ellipse(F1, F2, 2), el2;
point Fp1=shift(0, 2*el1.a)*F1;
dot("F'", Fp1);

line tgt, saxe=line(F1, false, -F2);

for (int i=0; i < 360; i += 5) {
  save();
  ellipse el=rotate(i, F1)*el1;
  point M=intersectionpoints(el, saxe)[0];
  tgt=tangents(el, M)[0];
  draw(tgt, 0.8*red);
  draw((reflect(tgt)*el)^^el, linewidth(bp));
  anim.add();
  restore();
}

erase();
anim.movie();
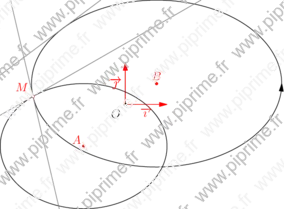
animations-fig011
Show animations/fig0120.asy on Github.
Generated with Asymptote 3.00-0.
Categories : Animation
Tags : #Ellipse | #Tangent | #Geometry | #Animation | #Locus
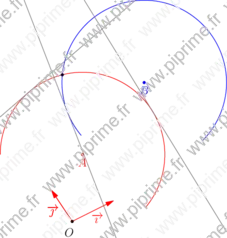
import geometry;
import animate;

animation anim;
size(16cm);

point F1=(0, 0), F2=(10, 0);
dot("F", F2);
ellipse el1=ellipse(F1, F2, 6), el2;
draw(el1, linewidth(bp));
point Fp2=shift(2*el1.a, 0)*F2;
line tgt, saxe;
pen[] p=new pen[]{0.8*green, 0.8*blue, 0.8*yellow, cyan};
path[] locus=sequence(new path(int i){return nullpath;}, p.length);
real t=1/(p.length-1);

bool initlocus=true;
for (int i=0; i < 360; i += 1) {
  save();
  point Fm=rotate(i, F2)*Fp2;
  dot("F'", Fm);
  draw(Fm--F2, linewidth(2bp));
  point M=intersectionpoints(el1, line(F2, false, Fm))[0];
  tgt=tangents(el1, M)[0];
  draw(tgt, 0.8*red);
  el2=reflect(tgt)*el1;
  draw(el2.F1--el2.F2);

  for (int j=0; j < p.length; ++j) {
    point P=point(segment(el2.F2, Fm), 0.5+j*t/2);
    locus[j]=initlocus ? P : locus[j]--P;
    dot(P, p[j]);
    draw(locus[j], bp+p[j]);
  }

  dot(el2.F2);
  draw(el2, linewidth(bp));
  anim.add();
  restore();
  initlocus=false;
}

erase();
anim.movie();
geometry-fig044
Show geometry/fig0440.asy on Github.
Generated with Asymptote 3.00-0.
Categories : Examples 2D | Geometry.asy
Tags : #Geometry | #Line | #Intersection | #Circle | #Tangent
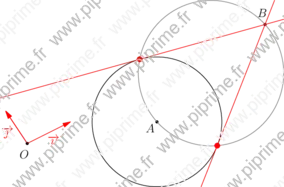
import geometry;
size(10cm,0);

// currentcoordsys=cartesiansystem((0,0),i=(1,0.25),j=(-0.5,.75));
show(currentcoordsys, xpen=invisible);

point A=(-1,-1);
point B=(0.75,0.5);
dot("$A$",A,NW,red);
dot("$B$",B,N,red);

circle c1=circle(A,1.5);
circle c2=circle(B,2);
draw(c1^^c2);

point[] inter=intersectionpoints(c1,c2);
dot("$M$", inter[0], 2NW, red);

/*<asyxml><view file="modules/geometry.asy" type="line" signature="tangent(circle,point)"/></asyxml>*/
draw(tangent(c1,inter[0]), grey);
draw(tangent(c2,inter[0]), grey);

/*<asyxml><view file="modules/geometry.asy" type="line" signature="tangent(circle,abscissa)"/></asyxml>*/
draw(tangent(c2,angabscissa(135)), grey);
geometry-fig046
Show geometry/fig0460.asy on Github.
Generated with Asymptote 3.00-0.
Categories : Examples 2D | Geometry.asy
Tags : #Geometry | #Line | #Intersection | #Ellipse | #Abscissa | #Point | #Tangent
import geometry;
size(10cm,0);

// currentcoordsys=cartesiansystem((0,0),i=(1,0.5),j=(-0.5,.75));
show(currentcoordsys, xpen=invisible);

point A=(-1,-1);
point B=(0.75,0.5);
dot("$A$",A,NW,red);
dot("$B$",B,N,red);

ellipse el1=ellipse(A,2,1.5);
ellipse el2=ellipse(B,3,2);
draw(el1);
draw(el2,Arrow);

point[] inter=intersectionpoints(el1,el2);
dot("$M$", inter[0], 2NW, red);

/*<asyxml><view file="modules/geometry.asy" type="line[]" signature="tangents(ellipse,point)"/></asyxml>*/
draw(tangents(el1,inter[0]), grey);
draw(tangents(el2,inter[0]), grey);

/*<asyxml><view file="modules/geometry.asy" type="line" signature="tangent(ellipse,abscissa)"/></asyxml>*/
draw(tangent(el2,angabscissa(90)), grey);
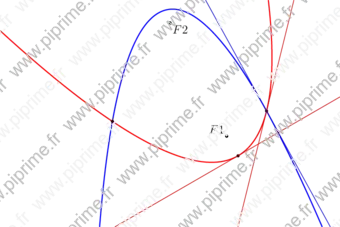
geometry-fig047
Show geometry/fig0470.asy on Github.
Generated with Asymptote 3.00-0.
Categories : Examples 2D | Geometry.asy
Tags : #Geometry | #Line | #Intersection | #Parabola | #Abscissa | #Point | #Tangent
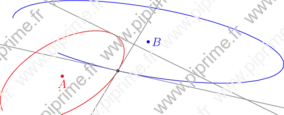
import geometry;
size(12cm);

// currentcoordsys=cartesiansystem((0,0),i=(1,0.5),j=(-0.5,.75));
// show(currentcoordsys, xpen=invisible);

point F1=(0,0);
dot("$F1$",F1,NW);
point F2=(-0.25,0.5);
dot("$F2$",F2,SE);

parabola p=parabola(F1, 0.1, 120);
draw(p, bp+red);

parabola pp=parabola(F2, 0.06, 280);
draw(pp, bp+blue);

abscissa x=angabscissa(180);
dot(point(p,x));
/*<asyxml><view file="modules/geometry.asy" type="line" signature="tangent(parabola,abscissa)"/></asyxml>*/
draw(tangent(p,x), 0.8*red);

point[] P=intersectionpoints(p,pp);
dot(P);

/*<asyxml><view file="modules/geometry.asy" type="line[]" signature="tangents(parabola,point)"/></asyxml>*/
draw(tangents(p,P[0]), 0.8*red);
draw(tangents(pp,P[0]), 0.8*blue);

// Enlarge the bounding box
draw(box((-1,-0.4), (0.5,0.6)),invisible);
geometry-fig048

Show geometry/fig0480.asy on Github.
Generated with Asymptote 3.00-0.
Categories : Examples 2D | Geometry.asy
Tags : #Geometry | #Line | #Intersection | #Hyperbola | #Abscissa | #Point | #Tangent
import geometry;
size(10cm);

point C=(4,2);
dot("$C$",C,E+NE,red);

hyperbola h=hyperbola(C,1.5,1,-20);
draw(h, linewidth(bp));

/*<asyxml><view file="modules/geometry.asy" type="line" signature="tangent(hyperbola,abscissa)"/></asyxml>*/
line l=tangent(h,angabscissa(85));
draw(l, grey);
dot(intersectionpoints(h,l));

l=tangent(h,angabscissa(0,fromCenter));
draw(l, grey);
dot(intersectionpoints(h,l));

// Enlarge the bounding box of the current picture.
draw(box((-1,-0.5), (9,4)), invisible);
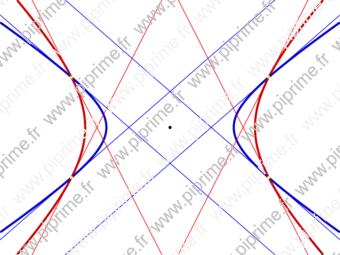
geometry-fig049
Show geometry/fig0490.asy on Github.
Generated with Asymptote 3.00-0.
Categories : Examples 2D | Geometry.asy
Tags : #Geometry | #Line | #Intersection | #Hyperbola | #Point | #Tangent
import geometry;
size(12cm);

point C=(0,0);
dot(C);

hyperbola[] h;
h[0]=hyperbola(C,2,2);
h[1]=hyperbola(C,1.5,1);

draw(h[0], 2bp+0.8*red);
draw(h[1], 2bp+0.8*blue);

point[] P=intersectionpoints(h[0],h[1]);

line[] l;
for (int i=0; i < P.length; ++i) {
  for (int j=0; j < 2; ++j) {
    /*<asyxml><view file="modules/geometry.asy" type="line[]" signature="tangents(hyperbola,point)"/></asyxml>*/
    l=tangents(h[j],P[i]);
    draw(l[0], j == 0 ? red : blue);
  }
}

dot(P, yellow);

// Enlarge the bounding box of the current picture.
draw(box((-4,-3), (4,3)), invisible);
geometry-fig050
Show geometry/fig0500.asy on Github.
Generated with Asymptote 3.00-0.
Categories : Examples 2D | Geometry.asy
Tags : #Geometry | #Line | #Intersection | #Circle | #Tangent | #Point
import geometry;
size(10cm,0);

currentcoordsys=cartesiansystem((0,0),i=(1,0.5),j=(-0.5,.75));
show(currentcoordsys, xpen=invisible);

point A=(2.5,-1);
point B=A+(3,1);
dot("$A$",A,SW);
dot("$B$",B,2N+0.5W);

circle c1=circle(A,1.5);
draw(c1);

/*<asyxml><view file="modules/geometry.asy" type="line[]" signature="tangents(circle,point)"/></asyxml>*/
line[] tgt=tangents(c1,B);
draw(tgt,red);
/*<asyxml><view file="modules/geometry.asy" type="circle" signature="circle(point,point)"/></asyxml>*/
draw(circle(B,A),grey);

// dot(intersectionpoints(c1,circle(B,A)),red);
for (int i=0; i<tgt.length; ++i) {
  dot(intersectionpoints(c1,tgt[i]),2mm+red);
}
geometry-fig051
Show geometry/fig0510.asy on Github.
Generated with Asymptote 3.00-0.
Categories : Examples 2D | Geometry.asy
Tags : #Geometry | #Line | #Intersection | #Circle | #Tangent | #Ellipse | #Point
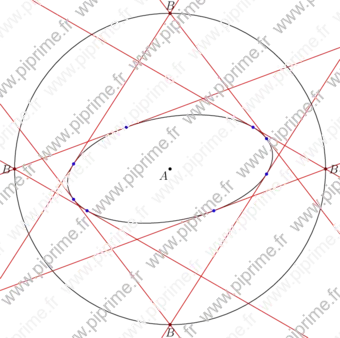
import geometry;
size(12cm,0);

// currentcoordsys=cartesiansystem((0,0),i=(1,0.5),j=(-0.5,.75));
// show(currentcoordsys, xpen=invisible);

point A=(2.5,-1);
dot("$A$",A,SW);
ellipse el1=ellipse(A,2,1,10);
draw(el1);

circle C=circle(A,3);
draw(C);
for (int i=0; i < 360; i+=90) {

  point B=point(C,angabscissa(i));
  dot("$B$",B,locate(unit(B-A)));


  line[] tgt=tangents(el1,B);
  draw(tgt,0.8*red);

  for (int i=0; i < tgt.length; ++i) {
    dot(intersectionpoints(el1,tgt[i]),blue);
  }

}
geometry-fig052
Show geometry/fig0520.asy on Github.
Generated with Asymptote 3.00-0.
Categories : Examples 2D | Geometry.asy
Tags : #Geometry | #Line | #Intersection | #Circle | #Tangent | #Ellipse | #Point
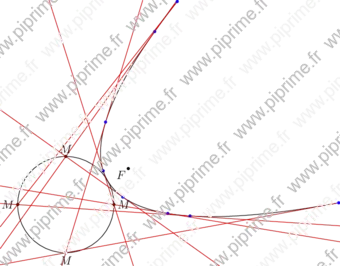
import geometry;
size(12cm,0);

// currentcoordsys=cartesiansystem((0,0),i=(1,0.5),j=(-0.5,.75));
// show(currentcoordsys, xpen=invisible);

point F=(0,0);
dot("$F$", F, SW);
parabola p=parabola(F, 0.1, 30);
draw(p);

point C=shift(2*(p.V-p.F))*p.V;
circle cle=circle(C, 0.2);
draw(cle);
for (int i=0; i < 360; i+=90) {

  point M=point(cle, angabscissa(i));
  dot("$M$", M, locate(unit(M-C)));

  line[] tgt=tangents(p, M);
  draw(tgt, 0.8*red);

  for (int i=0; i < tgt.length; ++i) {
    dot(intersectionpoints(p, tgt[i]), blue);
  }
}
geometry-fig103
Show geometry/fig1030.asy on Github.
Generated with Asymptote 3.00-0.
Categories : Examples 2D | Geometry.asy
Tags : #Geometry | #Arc | #Circle | #Intersection | #Line | #Coords system | #Tangent
import geometry;
size(8cm,0);

currentcoordsys=cartesiansystem((1,2),i=(1,0.5),j=(-0.5,.75));
show(currentcoordsys, xpen=invisible);

real R=2;

point A=(1,1.5);
dot("$A$",A,S,red);
point B=A+(2,1);
dot("$B$",B,S,blue);

arc a=arc(circle(A,R),-40,180);
arc b=arc(circle(B,R),-45,220);

draw(a,red);
draw(b,blue);

point M=intersectionpoints(a,b)[0];
dot(M);

/*<asyxml><view file="modules/geometry.asy" type="line" signature="tangent(explicit arc,point)"/></asyxml>*/
draw(tangent(a,M), grey);
draw(tangent(b,M), grey);

/*<asyxml><view file="modules/geometry.asy" type="line" signature="tangent(explicit arc,abscissa)"/></asyxml>*/
draw(tangent(a,angabscissa(45)), grey);
geometry-fig104
Show geometry/fig1040.asy on Github.
Generated with Asymptote 3.00-0.
Categories : Examples 2D | Geometry.asy
Tags : #Geometry | #Arc | #Ellipse | #Intersection | #Line | #Coords system | #Tangent
import geometry;
size(10cm,0);

// currentcoordsys=cartesiansystem((1,2),i=(1,0.5),j=(-0.5,.75));
// show(currentcoordsys, xpen=invisible);

real R=2;

point A=(1,1.5);
dot("$A$",A,S,red);
point B=A+(2.5,1);
dot("$B$",B,E,blue);

arc a=arc(ellipse(A,R,R/2,30),-40,180);
// ellispenodesnumberfactor=400;
arc b=arc(ellipse(B,2R,R/2,-10),-30,180);

draw(a,red);
draw(b,blue);

point M=intersectionpoints(a,b)[0];
dot(M);

/*<asyxml><view file="modules/geometry.asy" type="line" signature="tangent(explicit arc,point)"/></asyxml>*/
draw(tangent(a,M), grey);
draw(tangent(b,M), grey);

/*<asyxml><view file="modules/geometry.asy" type="line" signature="tangent(explicit arc,abscissa)"/></asyxml>*/
draw(tangent(a,angabscissa(45)), grey);
geometry-fig111
Show geometry/fig1110.asy on Github.
Generated with Asymptote 3.00-0.
Categories : Examples 2D | Geometry.asy
Tags : #Geometry | #Triangle | #Circle | #Tangent | #Line | #Label | #Point
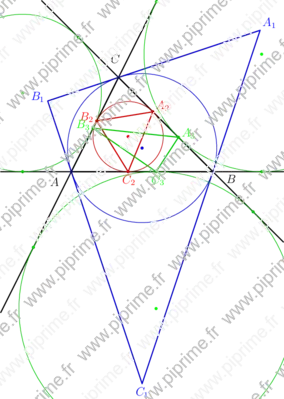
import geometry;
size(10cm,0);

// currentcoordsys=cartesiansystem((2,1),i=(1,0.5),j=(-0.25,0.75));
// show(currentcoordsys);

triangle t=triangle((-1,0), (2,0), (0,2));

/*<asyxml><view file="modules/geometry.asy" type="void" signature="drawline(picture,triangle,pen)"/></asyxml>*/
drawline(t, linewidth(bp));
/*<asyxml><view file="modules/geometry.asy" type="void" signature="label(picture,Label,Label,Label,triangle,real,real,pen,filltype)"/></asyxml>*/
label(t,alignFactor=4);

/*<asyxml><view file="modules/geometry.asy" type="circle" signature="circle(triangle)"/></asyxml>*/
circle cc=circle(t);
draw(cc, 0.8blue);
dot(cc.C, blue);
/*<asyxml><view file="modules/geometry.asy" type="triangle" signature="tangential(triangle)"/></asyxml>*/
triangle tgt=tangential(t);
draw(tgt, bp+0.8blue);
label("$A_1$", "$B_1$", "$C_1$", tgt, blue);

/*<asyxml><view file="modules/geometry.asy" type="circle" signature="incircle(triangle)"/></asyxml>*/
circle ic=incircle(t);
draw(ic, 0.8red);
dot(ic.C, red);
triangle intouch=intouch(t);
draw(intouch, bp+0.8red);
label("$A_2$", "$B_2$", "$C_2$", intouch, red);

/*<asyxml><view file="modules/geometry.asy" type="circle" signature="excircle(side,triangle)"/></asyxml>*/
circle ec=excircle(t.AB);
clipdraw(ec, 0.8green);
dot(ec.C, green);

ec=excircle(t.AC);
clipdraw(ec, 0.8green);
dot(ec.C, green);

ec=excircle(t.BC);
clipdraw(ec, 0.8green);
dot(ec.C, green);

/*<asyxml><view file="modules/geometry.asy" type="triangle" signature="extouch(triangle)"/></asyxml>*/
triangle ext=extouch(t);
draw(ext, bp+0.8green);
label("$A_3$", "$B_3$", "$C_3$", ext, green);

/*<asyxml><view file="modules/geometry.asy" type="point" signature="extouch(side)"/></asyxml>*/
dot(extouch(t.AB), 0.8*green);
dot(extouch(t.BC), 0.8*green);
dot(extouch(t.CA), 0.8*green);

/*<asyxml><view file="modules/geometry.asy" type="point" signature="intouch(side)"/></asyxml>*/
dot(intouch(t.AB), 0.8*red);
dot(intouch(t.BC), 0.8*red);
dot(intouch(t.CA), 0.8*red);

// Enlarge the bounding box of the current picture
draw(box((-2.5,-3), (3.5,3.5)), invisible);