Asymptote Gallery Tagged by “Graph” #113
animations-fig009
Show animations/fig0100.asy on Github.
Generated with Asymptote 3.00-0.
Categories : Animation
Tags : #Physics | #Graph | #Typedef | #Function (graphing) | #Animation
import animation;
import graph;

settings.tex="pdflatex";
settings.outformat="pdf";

unitsize(x=2cm,y=1.5cm);

typedef real realfcn(real);

real lambda=4;
real T=2;
real [] k=new real[3];
real [] w=new real[3];
k[0]=2pi/lambda;
w[0]=2pi/T;
real dk=-.5;
k[1]=k[0]-dk;
k[2]=k[0]+dk;
real dw=1;
w[1]=w[0]-dw;
w[2]=w[0]+dw;

real vp=w[1]/k[1];
real vg=dw/dk;

realfcn F(real x) {
  return new real(real t) {
    return cos(k[1]*x-w[1]*t)+cos(k[2]*x-w[2]*t);
  };
};

realfcn G(real x) {
  return new real(real t) {
    return 2*cos(0.5*(k[2]-k[1])*x+0.5*(w[1]-w[2])*t);
  };
};

realfcn operator -(realfcn f) {return new real(real t) {return -f(t);};};

animation A;

real tmax=abs(2pi/dk);
real xmax=abs(2pi/dw);

pen envelope=0.8*blue;
pen fillpen=lightgrey;

int n=50;
real step=tmax/(n-1);
for(int i=0; i < n; ++i) {
  save();
  real t=i*step;
  real a=xmax*t/tmax-xmax/pi;
  real b=xmax*t/tmax;
  path f=graph(F(t),a,b);
  path g=graph(G(t),a,b);
  path h=graph(-G(t),a,b);
  fill(buildcycle(reverse(f),g),fillpen);
  draw(f);
  draw(g,envelope);
  draw(h,envelope);
  A.add();
  restore();
}

for(int i=0; i < n; ++i) {
  save();
  real t=i*step;
  real a=-xmax/pi;
  real b=xmax;
  path f=graph(F(t),a,b);
  path g=graph(G(t),a,b);
  path h=graph(-G(t),a,b);
  path B=box((-xmax/pi,-2),(xmax,2));
  fill(buildcycle(reverse(f),g,B),fillpen);
  fill(buildcycle(f,g,reverse(B)),fillpen);
  draw(f);
  draw(g,envelope);
  draw(h,envelope);
  A.add();
  restore();
}

A.movie();
animations-fig012
Show animations/fig0130.asy on Github.
Generated with Asymptote 3.00-0.
Categories : Animation
Tags : #Animation | #Geometry | #Graph
import geometry;
import animate;

point A=(0, 0), B=(8, 0), C=(8, 10);
unitsize(5cm/B.x, 5cm/C.y);
animation Anim, Anim1;
path locus;

triangle t=triangle(A, B, C);
transform proj=projection(t.BC);
draw(t, linewidth(bp));
label(t);
segment s=segment(t.AB);
line l1 =line(t.BC);

int n=50; // Points number of the locus
real a=0, step=1/(n-1);
for (int i=0; i < n; ++i) {
  save(); // Geometry part
  point M=point(s, a);
  line l2=parallel(M, l1);
  point Np=intersectionpoint(l2, t.AC);
  point P=proj*Np;
  dot("$M$", M, S, 0.8*red);
  dot("$P$", P, E, 0.8*red);
  dot("$N$", Np, W, 0.8*red);
  fill(M--Np--P--B--cycle, 0.8*red);
  perpendicularmark(t.BC, t.BA);
  Anim.add(); // Anim contain only the geometry part
  restore();
  // Graph part
  picture gph; // picture of the graph
  unitsize(gph, 5cm/B.x, 4cm/C.y); // units for the graph
  show(gph, currentcoordsys);
  point Sp=(a*abs(B-A), abs(M-B)*abs(M-Np));
  locus=locus..Sp;
  draw(gph, locus, bp+0.8*red);
  Anim1.add(gph); // Anim1 contain only the graph part
  a += step;
}

Anim1.export(); // make all Anim1 pictures to the same size.
Anim1.purge();

for (int i=0; i < Anim.pictures.length; ++i) {
  // draw axis on all pictures of Anim1
  draw(Anim1.pictures[i], Label("$x$", align=S, position=EndPoint), hline, Arrow);
  draw(Anim1.pictures[i], Label("$y$", align=W, position=EndPoint), vline, Arrow);
  // add each graph to the corresponding geometric picture
  add(Anim.pictures[i], Anim1.pictures[i].fit(), 1.25*B);
}

Anim.movie();
generalities-fig175

Show generalities/fig1760.asy on Github.
Generated with Asymptote 3.00-0.
Categories : Examples 2D | Generalities
Tags : #Basis | #Graph | #Direction | #Path | #Fill/Unfill | #Shipout
import graph;
size(8cm,0);

path a = polargraph(new real(real t){return t;}, 0, 3pi, operator ..);
path b = polargraph(new real(real t){return 2t;}, 0, 3.75pi, operator ..);

real sharp=40;
path c=relpoint(a,1){relpoint(a,1)-postcontrol(a,length(a)-1)}..{dir(sharp)}relpoint(b,1);

fill(a..c..reverse(b)&cycle,0.8*red);
shipout(bbox(2mm, Fill(0.15*blue)));
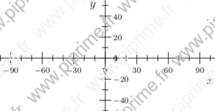
graph-fig001

Show graph/fig0010.asy on Github.
Generated with Asymptote 3.00-0.
Categories : Examples 2D | Graph.asy
Tags : #Graph | #Axis
size(8cm,0,false);
import graph;

xlimits(0, 200);
ylimits(-50, 50);
yaxis("y-value");
xaxis("x-value");
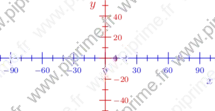
graph-fig002

Show graph/fig0020.asy on Github.
Generated with Asymptote 3.00-0.
Categories : Examples 2D | Graph.asy
Tags : #Graph | #Axis
size(8cm,0,false);
import graph;

xlimits(0, 200);
ylimits(-50, 50);
yaxis( "y-value", Left);
xaxis( "x-value", Bottom(true));
graph-fig003

Show graph/fig0030.asy on Github.
Generated with Asymptote 3.00-0.
Categories : Examples 2D | Graph.asy
Tags : #Graph | #Axis
size(8cm,0,false);
import graph;

xlimits( -100, 100);
ylimits( -50, 50);
yaxis( "y" , RightTicks());
xaxis( "x", Ticks());
graph-fig004
Show graph/fig0040.asy on Github.
Generated with Asymptote 3.00-0.
Categories : Examples 2D | Graph.asy
Tags : #Graph | #Axis
size(8cm,0);
import graph;

xlimits( -100, 100);
ylimits( -50, 50);
yaxis( "$y$" , Ticks(Label(currentpen+fontsize(8),align=E)));
xaxis( "$x$", Ticks(Label(currentpen+fontsize(8))));
graph-fig005
Show graph/fig0050.asy on Github.
Generated with Asymptote 3.00-0.
Categories : Examples 2D | Graph.asy
Tags : #Graph | #Axis | #Defaultpen
size(8cm,0);
import graph;

xlimits( -100, 100);
ylimits( -50, 50);

defaultpen(overwrite(SuppressQuiet));

yaxis( "$y$" , Ticks(Label(.8red+fontsize(8),align=E)), p=.8red);
xaxis( "$x$", Ticks(Label(.8blue+fontsize(8))), p=.8blue);
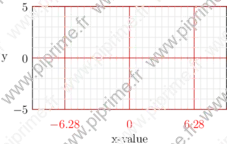
graph-fig006
Show graph/fig0060.asy on Github.
Generated with Asymptote 3.00-0.
Categories : Examples 2D | Graph.asy
Tags : #Graph | #Axis | #Grid
size(8cm,0);
import graph;

xlimits( -3pi, 3pi);
ylimits( -5, 5);
yaxis( "y" , LeftRight(), RightTicks(pTick=.8red, ptick=lightgrey, extend=true));
xaxis( "x-value", BottomTop(), Ticks(Label("$%.2f$",red), Step=2pi, step=pi/5, pTick=.8red, ptick=lightgrey, extend=true));
graph-fig007
Show graph/fig0070.asy on Github.
Generated with Asymptote 3.00-0.
Categories : Examples 2D | Graph.asy
Tags : #Graph | #Axis | #Number format
size(8cm,0);
import graph;

xlimits( -3pi, 3pi);
xaxis(BottomTop(), Ticks(Label("$%.2f$",red), Step=2pi, step=pi/5, pTick=.8red));
graph-fig008
Show graph/fig0080.asy on Github.
Generated with Asymptote 3.00-0.
Categories : Examples 2D | Graph.asy
Tags : #Graph | #Axis | #Number format | #Tex/latex features
size(8cm,0);
import graph;
texpreamble("\usepackage[frenchb]{babel}");

xlimits( -3pi, 3pi);
xaxis(BottomTop(), Ticks(Label("$\nombre{%.2f}$",red), Step=2pi, step=pi/5, pTick=.8red));
graph-fig009
Show graph/fig0090.asy on Github.
Generated with Asymptote 3.00-0.
Categories : Examples 2D | Graph.asy
Tags : #Graph | #Axis | #Number format | #Tex/latex features
size(8cm,0);
import graph;
texpreamble("\usepackage[frenchb]{babel}");

xlimits( -10000, 10000);
xaxis(BottomTop(), Ticks(Label("$\nombre{%0.f}$",red), Step=5000, step=500, pTick=.8red));
graph-fig010
Show graph/fig0110.asy on Github.
Generated with Asymptote 3.00-0.
Categories : Examples 2D | Graph.asy
Tags : #Graph | #Axis | #Number format | #Tex/latex features
// An other solution...
size(8cm,0);
import graph;
usepackage("icomma");

xlimits( -3pi, 3pi);

xaxis(Ticks(Label(red), Step=2pi,step=pi/5,pTick=.8red));
graph-fig011
Show graph/fig0120.asy on Github.
Generated with Asymptote 3.00-0.
Categories : Examples 2D | Graph.asy
Tags : #Graph | #Axis | #Label
size(6cm,0);
import graph;

xlimits( -3, 3);
ylimits( -3, 3);
xaxis(Ticks("%"));
yaxis(Ticks("%"));

labelx(1,2S);
labely(1,2W);
labelx("$O$",0,SW);
dot((0,0));
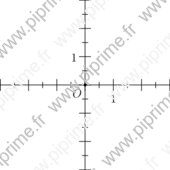
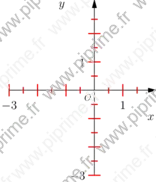
graph-fig012
Show graph/fig0130.asy on Github.
Generated with Asymptote 3.00-0.
Categories : Examples 2D | Graph.asy
Tags : #Graph | #Axis | #Label
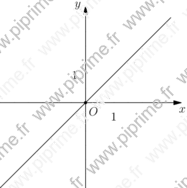
import graph;

unitsize(x=1cm);
real f(real x){return x;}
xlimits( -3, 3);
ylimits( -3, 3);
draw(graph(f,-3,3));
xaxis(Label("$x$",position=EndPoint, align=SE),Ticks("%",extend=true), Arrow);
yaxis(Label("$y$",position=EndPoint, align=NW),Ticks("%",extend=true), Arrow);

labelx(1,2S);
labely(1,2W);
labelx("$O$",0,SE);
dot((0,0));
graph-fig013
Show graph/fig0140.asy on Github.
Generated with Asymptote 3.00-0.
Categories : Examples 2D | Graph.asy
Tags : #Graph | #Axis | #Label
unitsize(x=1cm);
import graph;

xlimits( -3, 2);
ylimits( -3, 3);
xaxis(xmin=-3, xmax=2,Ticks("%"));
yaxis(ymin=-3, ymax=3, Ticks("%"));

labelx(1,2S);
labely(1,2W);
labelx("$O$",0,SW);
dot((0,0));
draw(Label("$x$",position=Relative(1),align=2S),(currentpicture.userMin().x-1,0)--(currentpicture.userMax().x+1,0),Arrow);
draw(Label("$y$",position=Relative(1),align=2W),(0,currentpicture.userMin().y-1)--(0,currentpicture.userMax().y+1),Arrow);
graph-fig014

Show graph/fig0150.asy on Github.
Generated with Asymptote 3.00-0.
Categories : Examples 2D | Graph.asy
Tags : #Graph | #Axis | #Label
import graph;
unitsize(1cm);

xlimits( -3, 2);
ylimits( -3, 3);
xaxis("$x$",Ticks("%",begin=false, end=false),arrow=Arrow);
yaxis("$y$",Ticks("%",begin=false, end=false),arrow=Arrow);

labelx(1,2S);
labely(1,2W);
labelx("$O$",0,SW);
dot((0,0));
graph-fig015
Show graph/fig0160.asy on Github.
Generated with Asymptote 3.00-0.
Categories : Examples 2D | Graph.asy
Tags : #Graph | #Axis | #Label
import graph;
unitsize(1cm);

xlimits( -3, 2);
ylimits( -3, 3);
xaxis("$x$",Ticks(ticklabel=NoZeroFormat,1bp+red,end=false),arrow=Arrow);
yaxis("$y$",Ticks(ticklabel=NoZeroFormat,1bp+red,end=false),arrow=Arrow);

labelx(scale(.75)*"$O$",0,SW);
graph-fig016
Show graph/fig0170.asy on Github.
Generated with Asymptote 3.00-0.
Categories : Examples 2D | Graph.asy
Tags : #Graph | #Axis | #Label
import graph;
unitsize(1cm);

xlimits( -3, 2);
ylimits( -3, 3);
xaxis("$x$",Ticks(modify=NoZero,1bp+red,end=false),arrow=Arrow);
yaxis("$y$",Ticks(modify=NoZero,1bp+red,end=false),arrow=Arrow);

labelx(scale(.75)*"$O$",0,SW);
graph-fig017
Show graph/fig0180.asy on Github.
Generated with Asymptote 3.00-0.
Categories : Examples 2D | Graph.asy
Tags : #Graph | #Axis | #Label
import graph;
unitsize(1cm);

xlimits( -3, 2);
ylimits( -3, 3);

xaxis("$x$", Ticks(ticklabel=OmitFormat(-2,-1,2),
                   modify=NoZero,
                   1bp+red,
                   end=false),
      arrow=Arrow);

yaxis("$y$", Ticks(ticklabel=OmitFormat(-2,-1,2,3),
                   modify=NoZero,
                   1bp+red,
                   end=false),
      arrow=Arrow);

labelx(scale(.75)*"$O$",0,SW);
graph-fig018
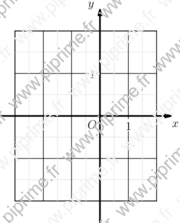
Show graph/fig0190.asy on Github.
Generated with Asymptote 3.00-0.
Categories : Examples 2D | Graph.asy
Tags : #Graph | #Axis | #Label | #Grid
import graph;
unitsize(x=1cm, y=1.5cm);

xlimits( -3, 2);
ylimits( -2, 2);
xaxis(BottomTop, Ticks("%",extend=true, ptick=lightgrey));
yaxis(LeftRight, Ticks("%",extend=true, ptick=lightgrey));
xequals(Label("$y$",align=2NW),0,ymin=-2.5, ymax=2.5, p=linewidth(1.5pt), Arrow(2mm));
yequals(Label("$x$",align=2SE),0,xmin=-3.5, xmax=2.5, p=linewidth(1.5pt), Arrow(2mm));
labelx(Label("$1$",UnFill), 1);
labely(Label("$1$",UnFill), 1);
labelx("$O$",0,SW);
dot((0,0));
graph-fig019
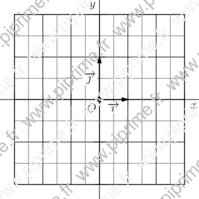
Show graph/fig0200.asy on Github.
Generated with Asymptote 3.00-0.
Categories : Examples 2D | Graph.asy
Tags : #Graph | #Axis | #Label | #Grid | #Vector
import graph;

void graphicrules(picture pic=currentpicture, string prefix=defaultfilename, real unit=1cm,
                  real xunit=unit != 0 ? unit : 0,
                  real yunit=unit != 0 ? unit : 0,
                  real xmin, real xmax, real ymin, real ymax)
{
  xlimits(xmin, xmax);
  ylimits(ymin, ymax);
  unitsize(x=xunit, y=yunit);
}

void grid(picture pic=currentpicture,
          real xmin=pic.userMin().x, real xmax=pic.userMax().x,
          real ymin=pic.userMin().y, real ymax=pic.userMax().y,
          real xStep=1, real xstep=.5,
          real yStep=1, real ystep=.5,
          pen pTick=nullpen, pen ptick=grey, bool above=false)
{
  draw(pic,box((xmin,ymin),(xmax,ymax)),invisible);
  xaxis(pic, BottomTop, xmin, xmax, Ticks("%",extend=true,Step=xStep,step=xstep,pTick=pTick,ptick=ptick), above=above);
  yaxis(pic, LeftRight, ymin, ymax, Ticks("%",extend=true,Step=yStep,step=ystep,pTick=pTick,ptick=ptick), above=above);
}

void cartesianaxis(picture pic=currentpicture,
                   Label Lx=Label("$x$",align=S),
                   Label Ly=Label("$y$",align=W),
                   real xmin=pic.userMin().x, real xmax=pic.userMax().x,
                   real ymin=pic.userMin().y, real ymax=pic.userMax().y,
                   real extrawidth=1, real extraheight=extrawidth,
                   pen p=currentpen,
                   ticks xticks=Ticks("%",pTick=nullpen, ptick=grey),
                   ticks yticks=Ticks("%",pTick=nullpen, ptick=grey),
                   bool above=true,
                   arrowbar arrow=Arrow)
{
  extraheight= cm*extraheight/(2*pic.yunitsize);
  extrawidth = cm*extrawidth/(2*pic.xunitsize);
  yequals(pic, Lx, 0, xmin-extrawidth, xmax+extrawidth, p, above, arrow=arrow);
  xequals(pic, Ly, 0, ymin-extraheight, ymax+extraheight, p, above, arrow=arrow);
  yequals(pic, 0, xmin, xmax, p, xticks, above);
  xequals(pic, 0, ymin, ymax, p, yticks, above);
}

void labeloij(picture pic=currentpicture,
              Label Lo=Label("$O$",NoFill),
              Label Li=Label("$\vec{\imath}$",NoFill),
              Label Lj=Label("$\vec{\jmath}$",NoFill),
              pair diro=SW, pair diri=S, pair dirj=W,
              pen p=scale(2)*currentpen,
              filltype filltype=NoFill, arrowbar arrow=Arrow(2mm))
{
  if (Lo.filltype==NoFill) Lo.filltype=filltype;
  if (Li.filltype==NoFill) Li.filltype=filltype;
  if (Lj.filltype==NoFill) Lj.filltype=filltype;
  labelx(pic, Lo, 0, diro, p);
  draw(pic, Li, (0,0)--(1,0), diri, p, arrow);
  draw(pic, Lj, (0,0)--(0,1), dirj, p, arrow);
  dot(pic, (0,0), dotsize(p)+p);
}

//The figure starts here
graphicrules(yunit=1.5cm, xmin=-3, xmax=3, ymin=-2, ymax=2);
grid();
cartesianaxis(arrow=None);
labeloij(UnFill);
graph-fig020
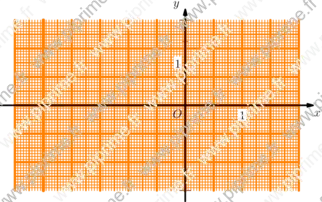
Show graph/fig0210.asy on Github.
Generated with Asymptote 3.00-0.
Categories : Examples 2D | Graph.asy
Tags : #Graph | #Grid
import graph;

void graphicrules(picture pic=currentpicture, real unit=1cm,
                  real xunit=unit != 0 ? unit : 0,
                  real yunit=unit != 0 ? unit : 0,
                  real xmin, real xmax, real ymin, real ymax)
{
  xlimits(xmin, xmax);
  ylimits(ymin, ymax);
  pic.unitsize(x=xunit,y=yunit);
}

picture millimeterpaper(picture pic=currentpicture, pair O=(0,0),
                        real xmin=infinity, real xmax=infinity,
                        real ymin=infinity, real ymax=infinity,
                        pen p=.5bp+orange)
{
  picture opic;
  real
    cofx=pic.xunitsize/cm,
    cofy=pic.yunitsize/cm;
  real
    xmin= (xmin == infinity) ? pic.userMin().x*cofx : xmin*cofx,
    xmax= (xmax == infinity) ? pic.userMax().x*cofx : xmax*cofx,
    ymin= (ymin == infinity) ? pic.userMin().y*cofy : ymin*cofy,
    ymax= (ymax == infinity) ? pic.userMax().y*cofy : ymax*cofy;
  path
    ph=(xmin*cm,0)--(xmax*cm,0),
    pv=(0,ymin*cm)--(0,ymax*cm);
  real [] step={5, 1, .5, .1};
  pen [] p_={ p, scale(.7)*p, scale(.4)*p, scale(.2)*p};

  for (int j=0; j<4; ++j)
    {
      for (real i=O.y; i<= ymax; i+=step[j])
        draw(opic, shift(0,i*cm)*ph, p_[j]);
      for (real i=O.y; i>=ymin ; i-=step[j])
        draw(opic, shift(0,i*cm)*ph, p_[j]);
      for (real i=O.x; i<=xmax; i+=step[j])
        draw(opic, shift(i*cm,0)*pv, p_[j]);
      for (real i=O.x; i>=xmin; i-=step[j])
        draw(opic, shift(i*cm,0)*pv, p_[j]);
    }

  return opic;
}

graphicrules(xunit=2cm, yunit=1.5cm, xmin=-3, xmax=2, ymin=-2, ymax=2);
add(millimeterpaper(p=3bp+orange),(0,0));
xaxis(xmin=-3, xmax=2, Ticks("%"));
yaxis(ymin=-2, ymax=2, Ticks("%"));
xequals(Label("$y$",align=2NW),0,ymin=-2.25, ymax=2.25, p=linewidth(1.5pt), Arrow(2mm));
yequals(Label("$x$",align=2SE),0,xmin=-3.25, xmax=2.25, p=linewidth(1.5pt), Arrow(2mm));
labelx(Label("$1$",UnFill), 1);
labely(Label("$1$",UnFill), 1);
labelx("$O$",0,SW);
dot((0,0));
graph-fig021
Show graph/fig0220.asy on Github.
Generated with Asymptote 3.00-0.
Categories : Examples 2D | Graph.asy
Tags : #Graph | #Function (drawing) | #Buildcycle | #Pattern | #Tex/latex features | #Grid
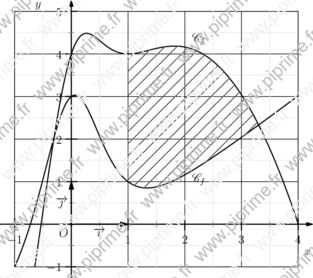
import graph;
import patterns;
usepackage("mathrsfs");

unitsize(2cm,1.5cm);
real xmin=-1,xmax=4;
real ymin=-1,ymax=5;

// Definition of fonctions f and g :
real f(real x) {return 4x-x^2+4/(x^2+1)^2;}
real g(real x) {return x-1+4/(x^2+1)^2;}

// Trace the curves :
path Cf=graph(f,xmin,xmax,n=400);
path Cg=graph(g,xmin,xmax,n=400);
draw(Cf,linewidth(1bp));
draw(Cg,linewidth(1bp));
xlimits(xmin,xmax,Crop);
ylimits(ymin,ymax,Crop);

// The grid :
xaxis(BottomTop, xmin, xmax, Ticks("%", Step=1, step=0.5, extend=true, ptick=lightgrey));
yaxis(LeftRight, ymin, ymax, Ticks("%", Step=1, step=0.5, extend=true, ptick=lightgrey));
// The axis.
xequals(Label("$y$",align=W),0,ymin=ymin-0.25, ymax=ymax+0.25,
        Ticks(NoZero,pTick=nullpen, ptick=grey),
        p=linewidth(1pt), Arrow(2mm));
yequals(Label("$x$",align=S),0,xmin=xmin-0.25, xmax=xmax+0.25,
        Ticks(NoZero,pTick=nullpen, ptick=grey),
        p=linewidth(1pt), Arrow(2mm));

labelx(Label("$O$",NoFill), 0, SW);
draw(Label("$\vec{\imath}$",align=S,UnFill),
     (0,0)--(1,0),scale(2)*currentpen,Arrow);
draw(Label("$\vec{\jmath}$",align=W,UnFill),
     (0,0)--(0,1),scale(2)*currentpen,Arrow);
dot((0,0));

label("$\mathscr{C}_f$",(2.25,f(2.25)),2N);
label("$\mathscr{C}_f$",(2.25,g(2.25)),2S);

// Les hachures.
path vline=(1,-1)--(1,5);
add("hachure",hatch(3mm));
fill(buildcycle(vline,graph(f,1,4),graph(g,1,4)),pattern("hachure"));
graph-fig022
Show graph/fig0230.asy on Github.
Generated with Asymptote 3.00-0.
Categories : Examples 2D | Graph.asy
Tags : #Graph | #Function (drawing) | #Fraction | #Label | #Tex/latex features | #Struct
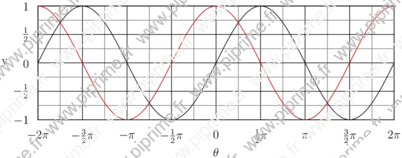
import graph;
unitsize(x=1cm,y=2cm);

struct rational
{
  int p;
  int q;
  real ep=1/10^5;
};

rational operator init() {return new rational;}

rational rational(real x, real ep=1/10^5)
{
  rational orat;
  int q=1;
  while (abs(round(q*x)-q*x)>ep)
    {
      ++q;
    }
  orat.p=round(q*x);
  orat.q=q;
  orat.ep=ep;
  return orat;
}

int pgcd(int a, int b)
{
  int a_=abs(a), b_=abs(b), r=a_;
  if (b_>a_) {a_=b_; b_=r; r=a_;}
  while (r>0)
    {
      r=a_%b_;
      a_=b_;
      b_=r;
    }
  return a_;
}

string texfrac(int p, int q,
               string factor="",
               bool signin=false, bool factorin=true,
               bool displaystyle=false,
               bool zero=true)
{
  if (p==0) return (zero ? "$0$" : "");
  string disp= displaystyle ? "$\displaystyle " : "$";
  int pgcd=pgcd(p,q);
  int num= round(p/pgcd), den= round(q/pgcd);
  string nums;
  if (num==1)
    if (factor=="" || (!factorin && (den !=1))) nums="1"; else nums="";
  else
    if (num==-1)
      if (factor=="" || (!factorin && (den !=1))) nums="-1"; else nums="-";
    else nums= (string) num;
  if (den==1) return "$" + nums + factor + "$";
  else
    {
      string dens= (den==1) ? "" : (string) den;
      if (signin || num>0)
        if (factorin)
          return disp + "\frac{" + nums + factor + "}{" + (string) dens + "}$";
        else
          return disp + "\frac{" + nums + "}{" + (string) dens + "}"+ factor + "$";
      else
        {
          if (num==-1)
            if (factor=="" || !factorin) nums="1"; else nums="";
          else nums=(string)(abs(num));
        if (factorin)
          return disp + "-\frac{" + nums + factor + "}{" + (string) dens + "}$";
        else
          return disp + "-\frac{" + nums + "}{" + (string) dens + "}"+ factor + "$";
        }
    }
}

string texfrac(rational x,
               string factor="",
               bool signin=false, bool factorin=true,
               bool displaystyle=false,
               bool zero=true)
{
  return texfrac(x.p, x.q, factor, signin, factorin, displaystyle, zero);
}

ticklabel labelfrac(real ep=1/10^5, real factor=1.0,
                    string symbol="",
                    bool signin=false, bool symbolin=true,
                    bool displaystyle=false,
                    bool zero=true)
{
  return new string(real x)
    {
      return texfrac(rational(x/factor), symbol, signin, symbolin, displaystyle, zero);
    };
}

ticklabel labelfrac=labelfrac();

xlimits( -2pi, 2pi);
ylimits( -1, 1);

yaxis("y",LeftRight , Ticks(labelfrac,Step=.5,step=.25, ptick=grey, extend=true));

xaxis("$\theta$",BottomTop, Ticks(labelfrac(factor=pi,symbol="\pi",symbolin=false),
                           Step=pi/2, step=pi/4, ptick=grey, extend=true));

draw(graph(new real(real x){return sin(x);},-2pi,2pi));
draw(graph(new real(real x){return cos(x);},-2pi,2pi), .8red);
graph-fig023
Show graph/fig0240.asy on Github.
Generated with Asymptote 3.00-0.
Categories : Examples 2D | Graph.asy
Tags : #Graph | #Function (drawing) | #Fraction | #Label | #Tex/latex features | #Struct
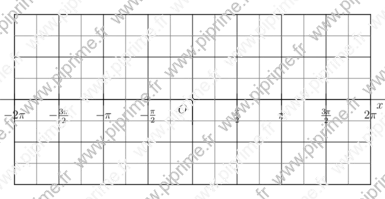
import graph;

// public real xunit=1cm,yunit=1cm;

void graphicrules(picture pic=currentpicture, string prefix=defaultfilename, real unit=1cm,
                  real xunit=unit != 0 ? unit : 0,
                  real yunit=unit != 0 ? unit : 0,
                  real xmin, real xmax, real ymin, real ymax)
{
  xlimits(xmin, xmax);
  ylimits(ymin, ymax);
  unitsize(x=xunit, y=yunit);
}

struct rational
{
  int p;
  int q;
  real ep=1/10^5;
};

rational operator init() {return new rational;}

rational rational(real x, real ep=1/10^5)
{
  rational orat;
  int q=1;
  while (abs(round(q*x)-q*x)>ep)
    {
      ++q;
    }
  orat.p=round(q*x);
  orat.q=q;
  orat.ep=ep;
  return orat;
}

int pgcd(int a, int b)
{
  int a_=abs(a), b_=abs(b), r=a_;
  if (b_>a_) {a_=b_; b_=r; r=a_;}
  while (r>0)
    {
      r=a_%b_;
      a_=b_;
      b_=r;
    }
  return a_;
}

string texfrac(int p, int q,
               string factor="",
               bool signin=false, bool factorin=true,
               bool displaystyle=false,
               bool zero=true)
{
  if (p==0) return (zero ? "$0$" : "");
  string disp= displaystyle ? "$\displaystyle " : "$";
  int pgcd=pgcd(p,q);
  int num= round(p/pgcd), den= round(q/pgcd);
  string nums;
  if (num==1)
    if (factor=="" || (!factorin && (den !=1))) nums="1"; else nums="";
  else
    if (num==-1)
      if (factor=="" || (!factorin && (den !=1))) nums="-1"; else nums="-";
    else nums= (string) num;
  if (den==1) return "$" + nums + factor + "$";
  else
    {
      string dens= (den==1) ? "" : (string) den;
      if (signin || num>0)
        if (factorin)
          return disp + "\frac{" + nums + factor + "}{" + (string) dens + "}$";
        else
          return disp + "\frac{" + nums + "}{" + (string) dens + "}"+ factor + "$";
      else
        {
          if (num==-1)
            if (factor=="" || !factorin) nums="1"; else nums="";
          else nums=(string)(abs(num));
          if (factorin)
            return disp + "-\frac{" + nums + factor + "}{" + (string) dens + "}$";
          else
            return disp + "-\frac{" + nums + "}{" + (string) dens + "}"+ factor + "$";
        }
    }
}

string texfrac(rational x,
               string factor="",
               bool signin=false, bool factorin=true,
               bool displaystyle=false,
               bool zero=true)
{
  return texfrac(x.p, x.q, factor, signin, factorin, displaystyle, zero);
}

ticklabel labelfrac(real ep=1/10^5, real factor=1.0,
                    string symbol="",
                    bool signin=false, bool symbolin=true,
                    bool displaystyle=false,
                    bool zero=true)
{
  return new string(real x)
    {
      return texfrac(rational(x/factor), symbol, signin, symbolin, displaystyle, zero);
    };
}

ticklabel labelfrac=labelfrac();

void grid(picture pic=currentpicture,
          real xmin=pic.userMin().x, real xmax=pic.userMax().x,
          real ymin=pic.userMin().y, real ymax=pic.userMax().y,
          real xStep=1, real xstep=.5,
          real yStep=1, real ystep=.5,
          pen pTick=nullpen, pen ptick=grey, bool above=true)
{
  xaxis(pic, BottomTop, xmin, xmax, Ticks("%",extend=true,Step=xStep,step=xstep,pTick=pTick,ptick=ptick), above=above);
  yaxis(pic, LeftRight, ymin, ymax, Ticks("%",extend=true,Step=yStep,step=ystep,pTick=pTick,ptick=ptick), above=above);
}

void cartesianaxis(picture pic=currentpicture,
                   Label Lx=Label("$x$",align=S),
                   Label Ly=Label("$y$",align=W),
                   real xmin=pic.userMin().x, real xmax=pic.userMax().x,
                   real ymin=pic.userMin().y, real ymax=pic.userMax().y,
                   real extrawidth=1, real extraheight=extrawidth,
                   pen p=currentpen,
                   ticks xticks=Ticks("%",pTick=nullpen, ptick=grey),
                   ticks yticks=Ticks("%",pTick=nullpen, ptick=grey),
                   bool above=true,
                   arrowbar arrow=Arrow)
{
  extraheight= cm*extraheight/(2*pic.yunitsize);
  extrawidth = cm*extrawidth/(2*pic.xunitsize);
  yequals(pic, Lx, 0, xmin-extrawidth, xmax+extrawidth, p, above, arrow=arrow);
  yequals(pic, 0, xmin, xmax, p, xticks, above);
  xequals(pic, Ly, 0, ymin-extraheight, ymax+extraheight, p, above, arrow=arrow);
  xequals(pic, 0, ymin, ymax, p, yticks, above);
}

void labeloij(picture pic=currentpicture,
              Label Lo=Label("$O$",NoFill),
              Label Li=Label("$\vec{\imath}$",NoFill),
              Label Lj=Label("$\vec{\jmath}$",NoFill),
              pair diro=SW, pair diri=S, pair dirj=W,
              pen p=scale(2)*currentpen,
              filltype filltype=NoFill, arrowbar arrow=Arrow(2mm))
{
  if (Lo.filltype==NoFill) Lo.filltype=filltype;
  if (Li.filltype==NoFill) Li.filltype=filltype;
  if (Lj.filltype==NoFill) Lj.filltype=filltype;
  labelx(pic, Lo, 0, diro, p);
  draw(pic, Li, (0,0)--(1,0), diri, p, arrow);
  draw(pic, Lj, (0,0)--(0,1), dirj, p, arrow);
  dot(pic, (0,0), dotsize(p)+p);
}

void labeloIJ(picture pic=currentpicture,
              Label Lo=Label("$O$",NoFill),
              Label LI=Label("$I$",NoFill),
              Label LJ=Label("$J$",NoFill),
              pair diro=SW, pair dirI=S, pair dirJ=W,
              pen p=currentpen,
              filltype filltype=NoFill, arrowbar arrow=Arrow)
{
  if (Lo.filltype==NoFill) Lo.filltype=filltype;
  if (LI.filltype==NoFill) LI.filltype=filltype;
  if (LJ.filltype==NoFill) LJ.filltype=filltype;
  labelx(pic, LI, 1, dirI, p);
  labely(pic, LJ, 1, dirJ, p);
  labelx(pic, Lo, 0, diro, p);
  dot(pic, (0,0), dotsize(p)+p);
}

graphicrules(xunit=1cm, yunit=3cm,
             xmin=-2pi, xmax=2pi, ymin=-1, ymax=1);
grid(xStep=pi/2, xstep=pi/4, yStep=.5, ystep=.25);
cartesianaxis(xticks=Ticks(Label(UnFill),labelfrac(factor=pi,symbol="\pi",symbolin=true, zero=false),Step=pi/2, step=pi/4, ptick=grey),
              yticks=Ticks(Label(UnFill),labelfrac(zero=false),Step=.5,step=.25, ptick=grey), arrow=None);
dot("$O$",(0,0),2SW);
graph-fig024
Show graph/fig0250.asy on Github.
Generated with Asymptote 3.00-0.
Categories : Examples 2D | Graph.asy
Tags : #Graph | #Function (drawing) | #Hyperbola | #Contour | #Function (implicit)
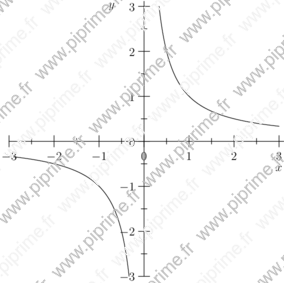
size(10cm,0);
import contour;
import graph;

xlimits( -3, 3);
ylimits( -3, 3);
yaxis( "$y$" , Ticks());
xaxis( "$x$", Ticks());

real f(real x, real y) {return x*y;}

draw(contour(f,(-3,-3),(3,3),new real[] {1}));
graph-fig025

Show graph/fig0260.asy on Github.
Generated with Asymptote 3.00-0.
Categories : Examples 2D | Graph.asy
Tags : #Graph | #Function (drawing) | #Hyperbola | #Contour | #Function (implicit) | #Array
size(10cm,0);
import contour;
import stats;
import graph;

xlimits( -5, 5);
ylimits( -4, 5);
yaxis( "$y$" , Ticks(Label(currentpen+fontsize(8),align=E)));
xaxis( "$x$", Ticks(Label(currentpen+fontsize(8))));

real f(real x, real y) {return x^2-x-y^2+3y-6;}

int min=-5,
  max=5,
  n=max-min+1;

real[] value=sequence(min,max);

pen[] p=sequence(new pen(int i) {
    return (value[i] >= 0 ? solid : dashed) +
    (value[i] >= 0 ? (value[i]/max)*red : (value[i]/min)*blue) +
    fontsize(4);
  },n);

Label[] Labels=sequence(new Label(int i) {
    return Label(value[i] != 0 ? (string) value[i] : "",Relative(unitrand()),(0,0),
                 UnFill(1bp));
  },n);

draw(Labels,contour(f,(-5,-5),(5,5),value),p);
graph-fig026
Show graph/fig0270.asy on Github.
Generated with Asymptote 3.00-0.
Categories : Examples 2D | Graph.asy
Tags : #Graph | #Function (drawing) | #Legend
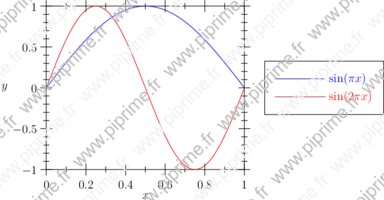
//Author: John Bowman
import graph;

size(250,200,IgnoreAspect);

real Sin(real t, real w) {return sin(w*t);}

draw(graph(new real(real t) {return Sin(t,pi);},0,1),blue,"$\sin(\pi x)$");
draw(graph(new real(real t) {return Sin(t,2pi);},0,1),red,"$\sin(2\pi x)$");

xaxis("$x$",BottomTop,Ticks);
yaxis("$y$",LeftRight,Ticks);

attach(legend(),point(E),20E,UnFill);
graph-fig027
Show graph/fig0280.asy on Github.
Generated with Asymptote 3.00-0.
Categories : Examples 2D | Graph.asy
Tags : #Graph | #Function (drawing) | #Legend | #Typedef | #Tex/latex features
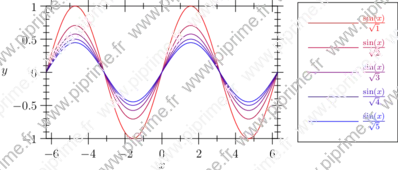
import graph;

size(10cm,6cm,IgnoreAspect);

typedef real realfcn(real);
realfcn F(real p){
  return new real(real x){return sin(x)/sqrt(p);};
};

real pmax=5;
for (real p=1; p<=pmax; p+=1)
  {
    draw(graph(F(p),-2pi,2pi),
         ((p-1)/(pmax-1)*blue+(1-(p-1)/(pmax-1))*red),
         "$\frac{\sin(x)}{\sqrt{" + (string) p +"}}$");
  }

xlimits(-2pi,2pi);
ylimits(-1,1);

xaxis("$x$",BottomTop,Ticks);
yaxis("$y$",LeftRight,Ticks);

attach(legend(),point(E),20E,UnFill);
graph-fig028
Show graph/fig0290.asy on Github.
Generated with Asymptote 3.00-0.
Categories : Examples 2D | Graph.asy
Tags : #Graph | #Interpolate | #Function (drawing) | #Legend | #Typedef
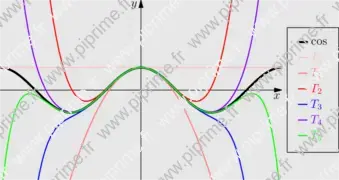
import graph;
size(10cm);

xaxis("$x$", -2*pi,2*pi, Arrow);
yaxis("$y$", -4,4, Arrow);

typedef real realfcn(real); // Define new type: real function of real

realfcn TPC(int n) { //Return Taylor polynomial (degrees 2*n) of cos
  return new real(real x) {
    return sum(sequence(new real(int m){return (-1)^m*x^(2*m)/gamma(2*m+1);}, n+1));
  };
}
draw(graph(cos,-2pi,2pi), linewidth(2bp), legend="$\cos$");

int n=6; // Number of curves
pen[] p={palered, lightred, red, blue, purple, green};
p.cyclic=true; // p[6]=p[0], p[7]=p[1], etc...

for (int i=0; i < n; ++i) {
  draw(graph(TPC(i),-2*pi,2*pi), bp+p[i], legend="$T_{"+(string)i+"}$");
}

xlimits(-2*pi,2*pi, Crop);
ylimits(-4,4, Crop);

attach(legend(linelength=3mm),point(E),5E);
shipout(bbox(Fill(lightgrey)));
graph-fig029
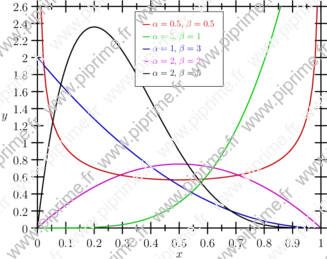
Beta distribution.
Show graph/fig0300.asy on Github.
Generated with Asymptote 3.00-0.
Categories : Examples 2D | Graph.asy
Tags : #Graph | #Function (drawing) | #Legend | #Typedef
import graph;
unitsize(10cm,3cm);

typedef real realfcn(real);

realfcn betaFunction(real alpha, real beta){
  return new real(real x){
    return gamma(alpha+beta)/(gamma(alpha)+gamma(beta))*x^(alpha-1)*(1-x)^(beta-1);
  };
};


real[][] ab=new real[][] {{0.5,0.5},{5,1},{1,3},{2,2},{2,5}};
pen[] p=new pen[] {0.8*red, 0.8*green, 0.8*blue, 0.8*magenta, black};

for (int i=0; i < 5; ++i) {
  draw(graph(betaFunction(ab[i][0],ab[i][1]),1e-5,1-1e-5), bp+p[i],
       legend="$\alpha="+(string)ab[i][0]+",\;\beta="+(string)ab[i][1]+"$");
}

xlimits(0,1,Crop);
ylimits(0,2.6,Crop);

xaxis("$x$",BottomTop,linewidth(bp),Ticks);
yaxis("$y$",LeftRight,linewidth(bp),Ticks(Step=0.2));

attach(scale(0.75)*legend(linelength=3mm),point(N),5S,UnFill);
graph-fig030
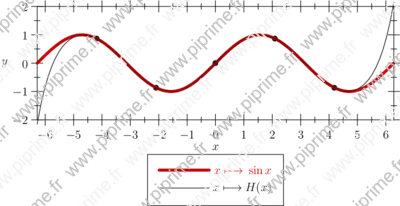
Other examples of interpolations can be found here.
Show graph/fig0310.asy on Github.
Generated with Asymptote 3.00-0.
Categories : Examples 2D | Graph.asy
Tags : #Graph | #Interpolate | #Function (drawing) | #Legend | #Typedef
import graph;
unitsize(1cm);

typedef real hermite(real);

/**
 * Retourne la fonction polynôme de Hermite
 * passant par les points m(x_i,y_i) de nombre dérivée d_i en ce point.
 * Return Hermite polynomial interpolation function
 * passing by the points m (x_i, y_i) of derived number d_i in this point.
 **/
hermite hermite(pair [] m, real [] d)
{
  return new real(real x){
    int n=m.length;
    if (n != d.length) abort("Hermite: nombres de paramètres incorrectes.");
    real q,qk,s,y=0;
    for (int k=0; k<n ; ++k) {
      real q=1, qk=1, s=0;
      for (int j=0; j<n; ++j)
        {
          if (j!=k){
            q=q*(x-m[j].x)^2;
            qk=qk*(m[k].x-m[j].x)^2;
            s=s+1/(m[k].x-m[j].x);
          }
        }
      y=y+q/qk*(m[k].y+(x-m[k].x)*(d[k]-2*s*m[k].y));
    }
    return y;
  };
}

pair[] m;
real[] d;
int nbpt=5;
real xmin=-2pi,
xmax=2pi,
l=xmax-xmin,
step=l/(nbpt+1);
for (int i=1; i<=nbpt; ++i)
  {
    real x=xmin+i*step;
    m.push((x,sin(x)));
    draw(m[m.length-1],linewidth(2mm));
    d.push(cos(x));
  }

xlimits(-2pi,2pi);
ylimits(-2,2);
xaxis("$x$",BottomTop,Ticks);
yaxis("$y$",LeftRight,Ticks);

draw(graph(sin,xmin,xmax),1mm+.8red,"$x\longmapsto{}\sin x$");
draw(graph(hermite(m,d),xmin,xmax),"$x\longmapsto{}H(x)$");

attach(legend(),point(10S),30S);
graph-fig031
Show graph/fig0320.asy on Github.
Generated with Asymptote 3.00-0.
Categories : Examples 2D | Graph.asy
Tags : #Graph | #Interpolate | #Function (drawing) | #Legend
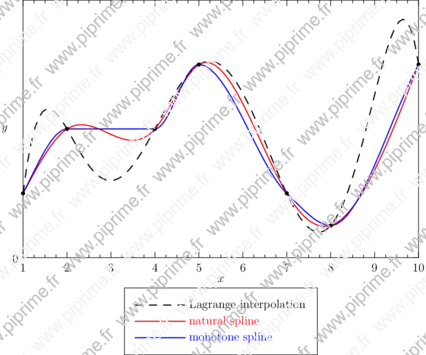
import graph;
import interpolate;

size(15cm,10cm,IgnoreAspect);

real[] xpt,ypt;
real [] xpt={1, 2, 4, 5, 7, 8, 10};
real [] ypt={1, 2, 2, 3, 1, 0.5, 3};


horner h=diffdiv(xpt,ypt);
fhorner L=fhorner(h);

scale(false,true);

pen p=linewidth(1);

draw(graph(L,min(xpt),max(xpt)),dashed+black+p,"Lagrange interpolation");
draw(graph(xpt,ypt,Hermite(natural)),red+p,"natural spline");
draw(graph(xpt,ypt,Hermite(monotonic)),blue+p,"monotone spline");
xaxis("$x$",BottomTop,LeftTicks(Step=1,step=0.25));
yaxis("$y$",LeftRight,RightTicks(Step=5));
dot(pairs(xpt,ypt),4bp+0.7black);

attach(legend(),point(10S),30S);
graph-fig032
Show graph/fig0330.asy on Github.
Generated with Asymptote 3.00-0.
Categories : Examples 2D | Graph.asy
Tags : #Graph | #Function (drawing) | #Legend | #Tex/latex features | #Slopefield
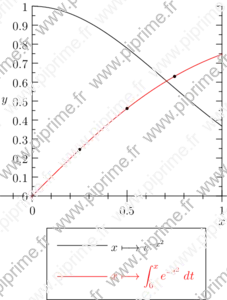
import slopefield;
import graph;
size(8cm,0);
real f(real t) {return exp(-t^2);}
defaultpen();

xlimits( 0,1);
ylimits( 0,1);
yaxis( "$y$" ,LeftRight, RightTicks);
xaxis( "$x$", Ticks());
draw(graph(f,0,1),"$x\longmapsto{}e^{-x^2}$");
draw(curve((0,0),f,(0,0),(1,10)),linecap(0)+red,"$\displaystyle x\longmapsto\int_{0}^{x}e^{-t^2}\;dt$");

//Test with three values calculated with Maxima:
dot((.25,0.13816319508411845*sqrt(pi))^^(.5 , 0.26024993890652326*sqrt(pi)));
dot((.75, 0.3555778168267576*sqrt(pi)));

attach(legend(),point(10S),30S);
graph-fig033
Show graph/fig0340.asy on Github.
Generated with Asymptote 3.00-0.
Categories : Examples 2D | Graph.asy
Tags : #Graph | #Font | #Axis
//Author: John Bowman
import graph;
size(2cm, 0);
xlimits(0, 100);
ylimits(-50, 50);
yaxis( "y-value" ,Left, Courier("m", "n") + fontsize(12), RightTicks("%.4g"));
graph-fig034
Show graph/fig0350.asy on Github.
Generated with Asymptote 3.00-0.
Categories : Examples 2D | Graph.asy
Tags : #Graph | #Function (drawing) | #Align | #Picture | #Transform/scale/shift/rotate/projection
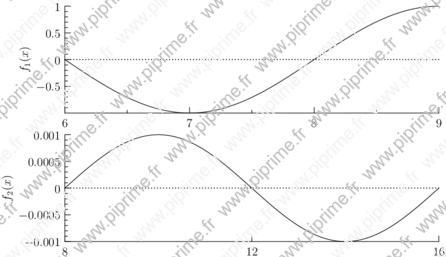
// From Asymptote's FAQ
import graph;

real width=15cm;
real aspect=0.3;

picture pic1,pic2;

size(pic1,width,aspect*width,IgnoreAspect);
size(pic2,width,aspect*width,IgnoreAspect);

scale(pic1,false);
scale(pic2,false);

real xmin1=6;
real xmax1=9;
real xmin2=8;
real xmax2=16;

real a1=1;
real a2=0.001;

real f1(real x) {return a1*sin(x/2*pi);}
real f2(real x) {return a2*sin(x/4*pi);}

draw(pic1,graph(pic1,f1,xmin1,xmax1));
draw(pic2,graph(pic2,f2,xmin2,xmax2));

xaxis(pic1,Bottom,LeftTicks());
yaxis(pic1,"$f_1(x)$",Left,RightTicks);

xaxis(pic2,Bottom,LeftTicks(Step=4));
yaxis(pic2,"$f_2(x)$",Left,RightTicks);

yequals(pic1,0,Dotted);
yequals(pic2,0,Dotted);

pair min1=point(pic1,SW);
pair max1=point(pic1,NE);

pair min2=point(pic2,SW);
pair max2=point(pic2,NE);

real scale=(max1.x-min1.x)/(max2.x-min2.x);
real shift=min1.x/scale-min2.x;

transform t1 = pic1.calculateTransform();
transform t2 = pic2.calculateTransform();
transform T=xscale(scale*t1.xx)*yscale(t2.yy);

add(pic1.fit());
real height=truepoint(N).y-truepoint(S).y;
add(shift(0,-height)*(shift(shift)*pic2).fit(T));
graph3-fig010
Show graph3/fig0100.asy on Github.
Generated with Asymptote 3.00-0.
Categories : Examples 3D | Graph3.asy
Tags : #Graph | #Contour | #Function (implicit) | #Palette | #Axis | #Array
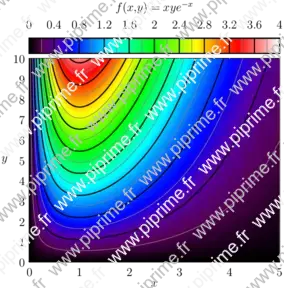
// From documentation of Asymptote
import graph;
import palette;
import contour;
texpreamble("\usepackage{icomma}");

size(10cm,10cm,IgnoreAspect);

pair a=(0,0);
pair b=(5,10);

real fz(pair z) {
  return z.x*z.y*exp(-z.x);
}
real f(real x, real y) {return fz((x,y));}

int N=200;
int Divs=10;
int divs=2;

defaultpen(1bp);
pen Tickpen=black;
pen tickpen=gray+0.5*linewidth(currentpen);
pen[] Palette=BWRainbow();

scale(false);

bounds range=image(f,Automatic,a,b,N,Palette);

xaxis("$x$",BottomTop,LeftTicks(pTick=grey, ptick=invisible, extend=true));
yaxis("$y$",LeftRight,RightTicks(pTick=grey, ptick=invisible, extend=true));

// Major contours
real[] Cvals;
Cvals=sequence(11)/10 * (range.max-range.min) + range.min;
draw(contour(f,a,b,Cvals,N,operator ..),Tickpen);

// Minor contours
real[] cvals;
real[] sumarr=sequence(1,divs-1)/divs * (range.max-range.min)/Divs;
for (int ival=0; ival < Cvals.length-1; ++ival)
    cvals.append(Cvals[ival]+sumarr);
draw(contour(f,a,b,cvals,N,operator ..),tickpen);

palette("$f(x,y)=xye^{-x}$",range,point(NW)+(0,1),point(NE)+(0,0.25),Top,Palette,
        PaletteTicks(N=Divs,n=divs,Tickpen,tickpen));
tube-fig013

Show tube/fig0130.asy on Github.
Generated with Asymptote 3.00-0.
Categories : Examples 3D | Tube.asy
Tags : #Tube | #Path | #Graph
import tube;
import graph;
size(12cm,0);
currentprojection=perspective(4,3,6);

real f(real t) {return cos(2*t);}
path g=polargraph(f,0,2pi,10,operator ..)&cycle;
path3 p=path3(scale(20)*g);

draw(tube(p,rotate(60)*polygon(3)), 0.8*red);
draw(tube(shift(Z)*p,scale(0.25)*unitcircle), orange);
draw(shift(1.25*Z)*p);
tube-fig014

Show tube/fig0140.asy on Github.
Generated with Asymptote 3.00-0.
Categories : Examples 3D | Tube.asy
Tags : #Tube | #Path | #Graph
import tube;
import graph;
size(12cm,0);
currentprojection=perspective(0,3,6);

real f(real t) {return cos(2*t);}
path g=polargraph(f,0,2pi,10,operator --)&cycle;
path3 p=path3(scale(20)*g);

draw(tube(p,2W--2E), red, bp+black);
draw(tube(p,unitcircle), orange, bp+black);