Asymptote Gallery Tagged by “Legend” #143
graph-fig026
Show graph/fig0270.asy on Github.
Generated with Asymptote 3.00-0.
Categories : Examples 2D | Graph.asy
Tags : #Graph | #Function (drawing) | #Legend
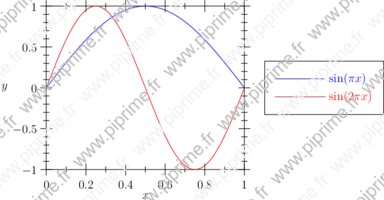
//Author: John Bowman
import graph;

size(250,200,IgnoreAspect);

real Sin(real t, real w) {return sin(w*t);}

draw(graph(new real(real t) {return Sin(t,pi);},0,1),blue,"$\sin(\pi x)$");
draw(graph(new real(real t) {return Sin(t,2pi);},0,1),red,"$\sin(2\pi x)$");

xaxis("$x$",BottomTop,Ticks);
yaxis("$y$",LeftRight,Ticks);

attach(legend(),point(E),20E,UnFill);
graph-fig027
Show graph/fig0280.asy on Github.
Generated with Asymptote 3.00-0.
Categories : Examples 2D | Graph.asy
Tags : #Graph | #Function (drawing) | #Legend | #Typedef | #Tex/latex features
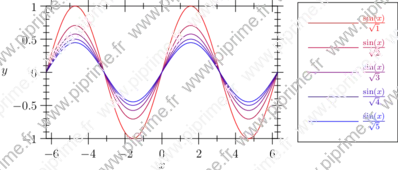
import graph;

size(10cm,6cm,IgnoreAspect);

typedef real realfcn(real);
realfcn F(real p){
  return new real(real x){return sin(x)/sqrt(p);};
};

real pmax=5;
for (real p=1; p<=pmax; p+=1)
  {
    draw(graph(F(p),-2pi,2pi),
         ((p-1)/(pmax-1)*blue+(1-(p-1)/(pmax-1))*red),
         "$\frac{\sin(x)}{\sqrt{" + (string) p +"}}$");
  }

xlimits(-2pi,2pi);
ylimits(-1,1);

xaxis("$x$",BottomTop,Ticks);
yaxis("$y$",LeftRight,Ticks);

attach(legend(),point(E),20E,UnFill);
graph-fig028
Show graph/fig0290.asy on Github.
Generated with Asymptote 3.00-0.
Categories : Examples 2D | Graph.asy
Tags : #Graph | #Interpolate | #Function (drawing) | #Legend | #Typedef
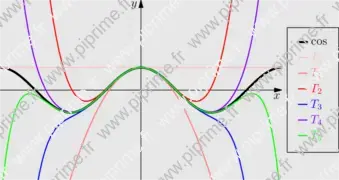
import graph;
size(10cm);

xaxis("$x$", -2*pi,2*pi, Arrow);
yaxis("$y$", -4,4, Arrow);

typedef real realfcn(real); // Define new type: real function of real

realfcn TPC(int n) { //Return Taylor polynomial (degrees 2*n) of cos
  return new real(real x) {
    return sum(sequence(new real(int m){return (-1)^m*x^(2*m)/gamma(2*m+1);}, n+1));
  };
}
draw(graph(cos,-2pi,2pi), linewidth(2bp), legend="$\cos$");

int n=6; // Number of curves
pen[] p={palered, lightred, red, blue, purple, green};
p.cyclic=true; // p[6]=p[0], p[7]=p[1], etc...

for (int i=0; i < n; ++i) {
  draw(graph(TPC(i),-2*pi,2*pi), bp+p[i], legend="$T_{"+(string)i+"}$");
}

xlimits(-2*pi,2*pi, Crop);
ylimits(-4,4, Crop);

attach(legend(linelength=3mm),point(E),5E);
shipout(bbox(Fill(lightgrey)));
graph-fig029
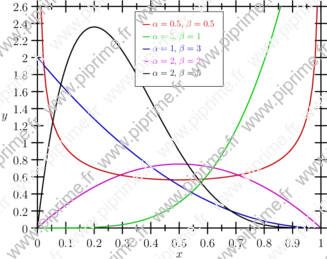
Beta distribution.
Show graph/fig0300.asy on Github.
Generated with Asymptote 3.00-0.
Categories : Examples 2D | Graph.asy
Tags : #Graph | #Function (drawing) | #Legend | #Typedef
import graph;
unitsize(10cm,3cm);

typedef real realfcn(real);

realfcn betaFunction(real alpha, real beta){
  return new real(real x){
    return gamma(alpha+beta)/(gamma(alpha)+gamma(beta))*x^(alpha-1)*(1-x)^(beta-1);
  };
};


real[][] ab=new real[][] {{0.5,0.5},{5,1},{1,3},{2,2},{2,5}};
pen[] p=new pen[] {0.8*red, 0.8*green, 0.8*blue, 0.8*magenta, black};

for (int i=0; i < 5; ++i) {
  draw(graph(betaFunction(ab[i][0],ab[i][1]),1e-5,1-1e-5), bp+p[i],
       legend="$\alpha="+(string)ab[i][0]+",\;\beta="+(string)ab[i][1]+"$");
}

xlimits(0,1,Crop);
ylimits(0,2.6,Crop);

xaxis("$x$",BottomTop,linewidth(bp),Ticks);
yaxis("$y$",LeftRight,linewidth(bp),Ticks(Step=0.2));

attach(scale(0.75)*legend(linelength=3mm),point(N),5S,UnFill);
graph-fig030
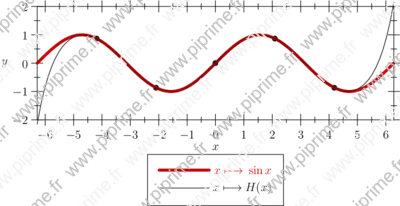
Other examples of interpolations can be found here.
Show graph/fig0310.asy on Github.
Generated with Asymptote 3.00-0.
Categories : Examples 2D | Graph.asy
Tags : #Graph | #Interpolate | #Function (drawing) | #Legend | #Typedef
import graph;
unitsize(1cm);

typedef real hermite(real);

/**
 * Retourne la fonction polynôme de Hermite
 * passant par les points m(x_i,y_i) de nombre dérivée d_i en ce point.
 * Return Hermite polynomial interpolation function
 * passing by the points m (x_i, y_i) of derived number d_i in this point.
 **/
hermite hermite(pair [] m, real [] d)
{
  return new real(real x){
    int n=m.length;
    if (n != d.length) abort("Hermite: nombres de paramètres incorrectes.");
    real q,qk,s,y=0;
    for (int k=0; k<n ; ++k) {
      real q=1, qk=1, s=0;
      for (int j=0; j<n; ++j)
        {
          if (j!=k){
            q=q*(x-m[j].x)^2;
            qk=qk*(m[k].x-m[j].x)^2;
            s=s+1/(m[k].x-m[j].x);
          }
        }
      y=y+q/qk*(m[k].y+(x-m[k].x)*(d[k]-2*s*m[k].y));
    }
    return y;
  };
}

pair[] m;
real[] d;
int nbpt=5;
real xmin=-2pi,
xmax=2pi,
l=xmax-xmin,
step=l/(nbpt+1);
for (int i=1; i<=nbpt; ++i)
  {
    real x=xmin+i*step;
    m.push((x,sin(x)));
    draw(m[m.length-1],linewidth(2mm));
    d.push(cos(x));
  }

xlimits(-2pi,2pi);
ylimits(-2,2);
xaxis("$x$",BottomTop,Ticks);
yaxis("$y$",LeftRight,Ticks);

draw(graph(sin,xmin,xmax),1mm+.8red,"$x\longmapsto{}\sin x$");
draw(graph(hermite(m,d),xmin,xmax),"$x\longmapsto{}H(x)$");

attach(legend(),point(10S),30S);
graph-fig031
Show graph/fig0320.asy on Github.
Generated with Asymptote 3.00-0.
Categories : Examples 2D | Graph.asy
Tags : #Graph | #Interpolate | #Function (drawing) | #Legend
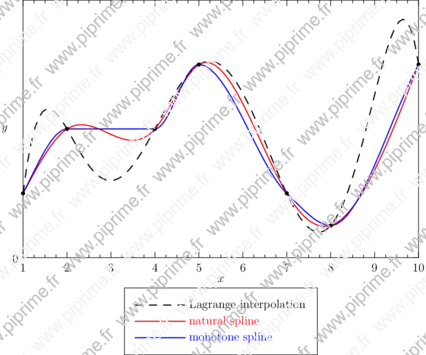
import graph;
import interpolate;

size(15cm,10cm,IgnoreAspect);

real[] xpt,ypt;
real [] xpt={1, 2, 4, 5, 7, 8, 10};
real [] ypt={1, 2, 2, 3, 1, 0.5, 3};


horner h=diffdiv(xpt,ypt);
fhorner L=fhorner(h);

scale(false,true);

pen p=linewidth(1);

draw(graph(L,min(xpt),max(xpt)),dashed+black+p,"Lagrange interpolation");
draw(graph(xpt,ypt,Hermite(natural)),red+p,"natural spline");
draw(graph(xpt,ypt,Hermite(monotonic)),blue+p,"monotone spline");
xaxis("$x$",BottomTop,LeftTicks(Step=1,step=0.25));
yaxis("$y$",LeftRight,RightTicks(Step=5));
dot(pairs(xpt,ypt),4bp+0.7black);

attach(legend(),point(10S),30S);
graph-fig032
Show graph/fig0330.asy on Github.
Generated with Asymptote 3.00-0.
Categories : Examples 2D | Graph.asy
Tags : #Graph | #Function (drawing) | #Legend | #Tex/latex features | #Slopefield
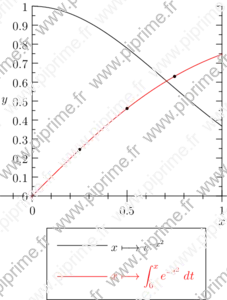
import slopefield;
import graph;
size(8cm,0);
real f(real t) {return exp(-t^2);}
defaultpen();

xlimits( 0,1);
ylimits( 0,1);
yaxis( "$y$" ,LeftRight, RightTicks);
xaxis( "$x$", Ticks());
draw(graph(f,0,1),"$x\longmapsto{}e^{-x^2}$");
draw(curve((0,0),f,(0,0),(1,10)),linecap(0)+red,"$\displaystyle x\longmapsto\int_{0}^{x}e^{-t^2}\;dt$");

//Test with three values calculated with Maxima:
dot((.25,0.13816319508411845*sqrt(pi))^^(.5 , 0.26024993890652326*sqrt(pi)));
dot((.75, 0.3555778168267576*sqrt(pi)));

attach(legend(),point(10S),30S);