Asymptote Gallery Tagged by “Pen” #92
animations-fig015
Show animations/fig0160.asy on Github.
Generated with Asymptote 3.00-0.
Categories : Animation
Tags : #Morphing | #Fill/Unfill | #Pen | #Animation
import graph_settings;
import animate;
size(16cm);

pair[] interp(pair[] a1, pair[] a2, real k)
{
  if(a1.length != a2.length) abort("interp: arrays have differents length.");
  pair[] g;
  int l=a1.length;
  g=sequence(new pair(int j){
      return interp(a1[j], a2[j], k);
    }, l);
  return g;
}

path morphing(pair[] a1, pair[] a2, real k, interpolate join=operator --)
{
  if(a1.length != a2.length) abort("morphing: arrays have differents length.");
  return join(...interp(a1, a2, k));
}

pair[] nodes(path g, int n)
{
  int np=round(n/length(g));
  n=np == 0 ? n : np*length(g);
  return sequence(new pair(int i){return point(g, length(g)*i/n);}, n);
}

animation A;

int nbpt=4;
pair[] A1=nodes(unitsquare, nbpt);
path g=(0, 0)--(1, 0)--(0, 1)--(1, 1)--cycle;
pair[] A2=shift(2, 1)*rotate(25)*nodes(g, nbpt);
interpolate join=operator ..;
// interpolate join=operator --;


int n=40;
real step=1/n;
pen p1=0.8*red, p2=0.8*blue;

filldraw(join(morphing(A1, A2, 0, join), cycle), p1);
filldraw(join(morphing(A1, A2, 1, join), cycle), p2);

for (int i=0; i <= n; ++i) {
  save();
  filldraw(join(morphing(A1, A2, i*step, join), cycle), opacity(0.5)+interp(p1, p2, i*step));
  A.add();
  restore();
}

A.movie(BBox(3mm, Fill(white)));
animations-fig016
Show animations/fig0170.asy on Github.
Generated with Asymptote 3.00-0.
Categories : Animation
Tags : #Morphing | #Fill/Unfill | #Pen | #Animation
import graph;
import animate;
size(15cm);

pair[] interp(pair[] a1, pair[] a2, real k)
{
  if(a1.length != a2.length) abort("interp: arrays have differents length.");
  pair[] g;
  int l=a1.length;
  g=sequence(new pair(int j){
      return interp(a1[j],a2[j],k);
    },l);
  return g;
}

path morphing(pair[] a1, pair[] a2, real k, interpolate join=operator --)
{
  if(a1.length != a2.length) abort("morphing: arrays have differents length.");
  return join(...interp(a1, a2, k));
}

pair[] nodes(path g, int n)
{
  int np=round(n/length(g));
  n=np == 0 ? n : np*length(g);
  return sequence(new pair(int i){return point(g, length(g)*i/n);}, n);
}

animation A;

real f(real t){ return exp(cos(t))-2*cos(4*t)+sin(t/12)^5;}
path gf=polargraph(f,0,12*pi,1000);

int nbpt=1000;
pair[] A1=nodes(scale(5.5)*unitcircle,nbpt);
pair[] A2=shift(0,0)*nodes(gf,nbpt);
interpolate join=operator --;


int n=50;
real step=1/n;
pen p1=0.8*red, p2=0.8*blue;

for (int i=0; i <= n; ++i) {
  save();
  filldraw(join(morphing(A1,A2,1,join),cycle),
           evenodd+p2);
  filldraw(join(morphing(A1,A2,i*step,join),cycle),
           evenodd+interp(p1,p2,i*step));
  A.add();
  restore();
}

int l = A.pictures.length;
for (int i=1; i <= l; ++i) {
  A.add(A.pictures[l-i]);
}

A.movie(BBox(3mm, 3bp+miterjoin+black, FillDraw(lightyellow)));
generalities-fig074
![]()
Show generalities/fig0740.asy on Github.
Generated with Asymptote 3.00-0.
Categories : Examples 2D | Generalities
Tags : #Basis | #Point/Dot | #Label | #Tex/latex features | #Align | #Defaultpen
defaultpen(fontsize(26pt));

dot(Label("$A$"),(0,0),NE);
dot(Label("$B$"),(2cm,0),NE+N);
generalities-fig088

Show generalities/fig0880.asy on Github.
Generated with Asymptote 3.00-0.
Categories : Examples 2D | Generalities
Tags : #Basis | #Defaultpen | #Point/Dot | #Transform/scale/shift/rotate | #Arrows/Bars | #Margin
size(0,0);
pair A=(0,0), B=(4cm,0);
path line=A--B;
transform TD=shift(0,-cm);
transform TR=shift(2.5cm,0);

defaultpen(linewidth(3bp));

draw("$AB$",line,.8red,Arrows(3mm));
draw("$A$",A,N); draw("$B$",B,N);

draw("$AB$",TD*line,.8red,Arrows(3mm),PenMargins);
draw("$A$",TD*A,N); draw("$B$",TD*B,N);

draw("$AB$",TD^2*line,.8red,Arrows(3mm),DotMargins);
dot("$A$",TD^2*A,dotfactor*NW); dot("$B$",TD^2*B,dotfactor*NE);

margin BigMargins=Margin(2,2);
draw("$AB$",TD^3*line,.8red,Arrows(3mm),BigMargins);
draw("$A$",TD^3*A,N); draw("$B$",TD^3*B,N);
graph-fig005
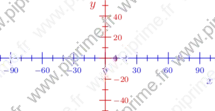
Show graph/fig0050.asy on Github.
Generated with Asymptote 3.00-0.
Categories : Examples 2D | Graph.asy
Tags : #Graph | #Axis | #Defaultpen
size(8cm,0);
import graph;

xlimits( -100, 100);
ylimits( -50, 50);

defaultpen(overwrite(SuppressQuiet));

yaxis( "$y$" , Ticks(Label(.8red+fontsize(8),align=E)), p=.8red);
xaxis( "$x$", Ticks(Label(.8blue+fontsize(8))), p=.8blue);