Asymptote Gallery Tagged by “Shading” #80
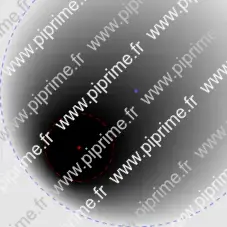
animations-fig003
Show animations/fig0030.asy on Github.
Generated with Asymptote 3.00-0.
Categories : Animation
Tags : #Animation | #Geometry | #Shading
import geometry;
import animate;
animation A;

size(15cm);

int nAnim = 75;
int nCircle = 6;
real astep = 360/nAnim;

inversion inv = inversion((-1, -2), 1);
line L1 = line(N, S);
circle C = inv * L1;
point center = C.C;

for (int i = -nAnim; i < nAnim; ++i) {
  real r;
  r = 0.001 + 4 * (i/nAnim)^2;
  line L2 = shift(2 * r * E) * L1;
  transform T = shift(0, -2 * r);
  transform R = rotate(astep * i, center);
  point C0c = r * E + nCircle/2 * sqrt(r) * N;
  circle[] Ci = sequence(new circle(int i){return circle(T^i * C0c, r);},  nCircle);

  fill(R * (path)C,  0.3 * blue);
  circle Cl = (circle) (R * (inv * L2));
  transform dsh = shift(Cl.r / 3 * unit(center-Cl.C));
  radialshade((path)Cl, white, dsh * Cl.C, 0, black, dsh * Cl.C, Cl.r);

  for (int i = 0; i < Ci.length; ++i) {
    circle Ct = inv * Ci[i];
    transform dsh = shift(Ct.r/3 * unit(center-Ct.C));
    radialshade(R * (path)Ct, red, dsh * R * Ct.C, 0, black, dsh * R * Ct.C, Ct.r);
  }

  A.add();
  erase();
}

A.movie(BBox(2mm, Fill(black)));
generalities-fig052
Show generalities/fig0520.asy on Github.
Generated with Asymptote 3.00-0.
Categories : Examples 2D | Generalities
Tags : #Basis | #Fill/Unfill | #Shading | #Array | #Path
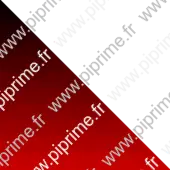
pen[][] p={{rgb(black)}, {rgb(.8red)}};

latticeshade((0,0)--(0,6cm)--(6cm,0)--cycle, p);
generalities-fig053
Show generalities/fig0530.asy on Github.
Generated with Asymptote 3.00-0.
Categories : Examples 2D | Generalities
Tags : #Basis | #Fill/Unfill | #Shading | #Array
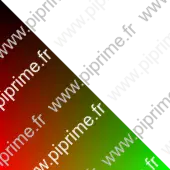
pen[][] p={{rgb(black),rgb(black)}, {rgb(red),rgb(green)}};

latticeshade((0,0)--(0,6cm)--(6cm,0)--cycle,p);
generalities-fig054
Show generalities/fig0540.asy on Github.
Generated with Asymptote 3.00-0.
Categories : Examples 2D | Generalities
Tags : #Basis | #Fill/Unfill | #Shading
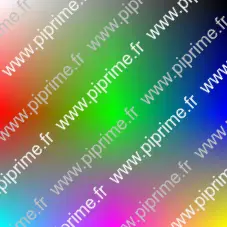
size(8cm,0);

pen[][] p={{rgb(white),rgb(grey),rgb(black)},
    {red,green,blue},
    {cyan,magenta,yellow}};

latticeshade(unitsquare,p);
generalities-fig055
Show generalities/fig0550.asy on Github.
Generated with Asymptote 3.00-0.
Categories : Examples 2D | Generalities
Tags : #Basis | #Fill/Unfill | #Shading
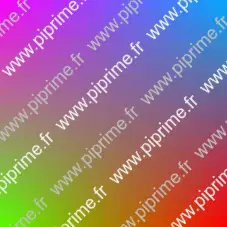
size(8cm,0);
import palette;

real[][] v={{1,2},{3,4}};
pen[] Palette=Rainbow();

latticeshade(box((0,0),(1,1)),palette(v,Palette));
generalities-fig056
Show generalities/fig0560.asy on Github.
Generated with Asymptote 3.00-0.
Categories : Examples 2D | Generalities
Tags : #Basis | #Fill/Unfill | #Shading | #Circle
size(8cm,0);

pair A=(0.35,0.35), B=(0.6,0.6);

radialshade(unitsquare,black,A,0.15,lightgrey,B,.6);

dot(A,.8red);
dot(B,blue+grey);
draw(shift(A)*scale(.15)*unitcircle,dashed+.8red);
draw(shift(B)*scale(.6)*unitcircle,dashed+blue+grey);
clip(unitsquare);
generalities-fig057
Show generalities/fig0570.asy on Github.
Generated with Asymptote 3.00-0.
Categories : Examples 2D | Generalities
Tags : #Basis | #Fill/Unfill | #Shading | #Transform/scale/shift/rotate | #Direction
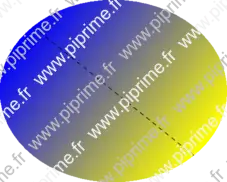
size(8cm,0);

transform t=xscale(1.25);
pen p1=blue, p2=yellow;
pair pa=t*dir(135), pb=t*dir(-45);

axialshade(t*unitcircle,p1,pa,p2,pb);
draw(pa--pb, dashed);
generalities-fig058
Show generalities/fig0580.asy on Github.
Generated with Asymptote 3.00-0.
Categories : Examples 2D | Generalities
Tags : #Fill/Unfill | #Shading | #Arc | #Loop/for/while | #Transform/scale/shift/rotate
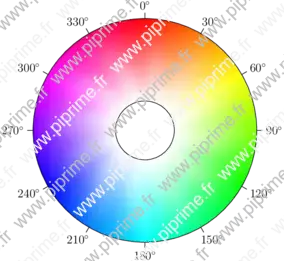
// Author: John Bowman
size(10cm,0);

real r=1;
real R=3.8;

int step=30;
path p=arc(0,r,0,step);
path P=arc(0,R,step,0);
for(int h=0; h < 360; h += step) {
  transform t=rotate(90-h);
  tensorshade(t*p--t*P--cycle,
              new pen[] {white,white,hsv(h-step,1,1),hsv(h,1,1)});
}

for(int h=0; h < 360; h += 30) {
  pair v=R*dir(90-h);
  draw(Label(string(h)+"$^\circ$",EndPoint),(v--1.05v));
}

draw(circle(0,r));
draw(circle(0,R));
generalities-fig059

Show generalities/fig0590.asy on Github.
Generated with Asymptote 3.00-0.
Categories : Examples 2D | Generalities
Tags : #Basis | #Shading | #Tex/latex features | #Texpath | #Fill/Unfill | #Array
size(16cm,0);

path[] P=texpath("$\displaystyle\int_{-\infty}^{+\infty}e^{-\alpha x^2}\,dx=
\sqrt{\frac{\pi}{\alpha}}$");
pair m=min(P), M=max(P);

axialshade(P,yellow,m,red,(m.x,M.y));
draw(P,0.5*blue);
shipout(bbox(3mm,Fill));
generalities-fig140

Show generalities/fig1410.asy on Github.
Generated with Asymptote 3.00-0.
Categories : Examples 2D | Generalities
Tags : #Basis | #Circle | #Shading
size(6cm,0);

path cle=scale(2)*unitcircle;

radialshade(scale(2)*cle, white, (0,0), 2, yellow, (0,0), 4);
radialshade(cle, white, (1,.5), 0, 0.8*blue, (0,0), 2);

for(real i=0; i<=length(cle); i+=.2)
  draw(point(cle,i)--(-2*I*dir(cle,i)+point(cle,i)),p=2mm+yellow+linecap(0));
generalities-fig156
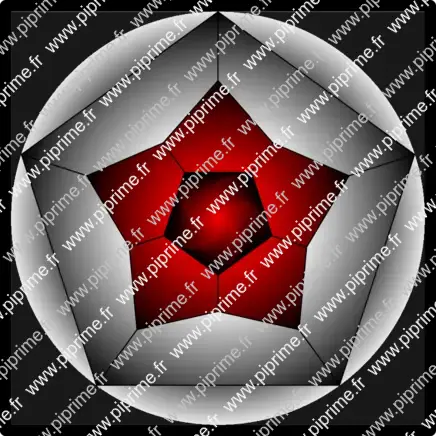
Show generalities/fig1570.asy on Github.
Generated with Asymptote 3.00-0.
Categories : Examples 2D | Generalities
Tags : #Basis | #Array | #Loop/for/while | #Fill/Unfill | #Shading
size(0,0);

pair [] P, Q, R, S;
real u=2cm;

for (int i=0; i<=4; ++i)
  P[i] = rotate(i*360/5)*(0,-u);

P[5] = P[0];
for (int i=0; i<=4; ++i)
  Q[i] = 3*midpoint(P[i]--P[i+1]);

Q[5] = Q[0];
for (int i=0; i<=4; ++i)
  R[i] = 1/3*( Q[i] + Q[i+1] + P[i+1] );

R[5] = R[0];
for (int i=0; i<=5; ++i)
  S[i] = 1.5*Q[i];

fill(shift(-abs(S[0]),-abs(S[0]))*scale(2*abs(S[0]))*unitsquare,.2grey);

radialshade(scale(abs(S[0]))*unitcircle,lightgrey,(0,0),abs(S[0]),
            black,(0,0),abs(.85*midpoint(S[0]--S[1])));

P[6]=P[1];
for (int i=0; i<=4; ++i)
  {
    radialshade(S[i]--Q[i]--R[i]--Q[i+1]--S[i+1]--cycle,
                lightgrey,(0,0),abs(R[i]),
                black,(0,0),abs(S[i]));
    radialshade(R[i]--Q[i+1]--R[i+1]--P[i+2]--P[i+1]--cycle,
                .8red,(0,0),sqrt(1-(2-2cos(pi/5))/4)*u,
                black,(0,0),abs(Q[i+1]));
  }

for (real i=1; i>0; i-=.05)
  fill(rotate(90*(1-i))*scale(i)*(P[0]--P[1]--P[2]--P[3]--P[4]--cycle),
       (1-i)*red);

pen p=linewidth(1pt);
for (int i=0; i<=4; ++i)
  {
    draw(P[i]   -- P[i+1],p);
    draw(P[i+1] -- R[i],p);
    draw(Q[i]   -- R[i],p);
    draw(R[i]   -- Q[i+1],p);
    draw(Q[i]   -- S[i],p);
    draw(S[i]   -- S[i+1],p);
  }

shipout(bbox(0,black+4mm));
graph3-fig011
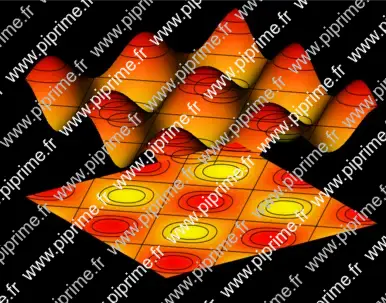
Show graph3/fig0110.asy on Github.
Generated with Asymptote 3.00-0.
Categories : Examples 3D | Graph3.asy
Tags : #Graph (3D) | #Surface | #Level set (3D) | #Contour | #Function (implicit) | #Palette | #Projection (3D) | #Axis (3D) | #Label (3D) | #Shading (3D) | #Shading
import graph3;
import palette;
import contour;
size(14cm,0);
currentprojection=orthographic(-1,-1.5,0.75);
currentlight=(-1,0,5);

real a=1, b=1;
real f(pair z) { return a*(6+sin(z.x/b)+sin(z.y/b));}
real g(pair z){return f(z)-6a;}

// The axes
limits((0,0,4a),(14,14,8a));
xaxis3(Label("$x$",MidPoint),OutTicks());
yaxis3(Label("$y$",MidPoint),OutTicks(Step=2));
ticklabel relativelabel()
{
  return new string(real x) {return (string)(x-6a);};
}
zaxis3(Label("$z$",Relative(1),align=2E),Bounds(Min,Max),OutTicks(relativelabel()));

// The surface
surface s=surface(f,(0,0),(14,14),100,Spline);

pen[] pens=mean(palette(s.map(zpart),Gradient(yellow,red)));

// Draw the surface
draw(s,pens);
// Project the surface onto the XY plane.
draw(planeproject(unitsquare3)*s,pens,nolight);

// Draw contour for "datumz"
real[] datumz={-1.5, -1, 0, 1, 1.5};
guide[][] pl=contour(g,(0,0),(14,14),datumz);
for (int i=0; i < pl.length; ++i)
  for (int j=0; j < pl[i].length; ++j)
    draw(path3(pl[i][j]));

// Draw the contours on the surface
draw(lift(f,pl));

if(!is3D())
  shipout(bbox(3mm,Fill(black)));
opacity-fig018

Show opacity/fig0180.asy on Github.
Generated with Asymptote 3.00-0.
Categories : Examples 2D | Opacity
Tags : #Opacity | #Layer | #Label | #Fill/Unfill | #Shipout | #Bbox | #Shading
size(4cm,0);
dotfactor*=5;

dot(scale(2)*"A",(0.5,1),5N);

layer();

dot(scale(2)*"B",(1.5,1),5N);
filldraw(scale(2)*unitsquare, lightgray+opacity(.5));

shipout(bbox(5mm,black,RadialShade(lightblue,darkblue)), "pdf");
opacity-fig019

Show opacity/fig0190.asy on Github.
Generated with Asymptote 3.00-0.
Categories : Examples 2D | Opacity
Tags : #Opacity | #Fill/Unfill | #Shading
size(10cm,0);
transform T=rotate(10)*xscale(1.1);
path c1=T*unitcircle, c2=T*scale(5)*unitcircle;
real l1=length(c1), l2=length(c2);

fill(scale(8)*shift(-0.5,-0.5)*unitsquare,blue);
int n=500;
real step=1/n;
for (int i=0; i < n; ++i) {
  real t=i*step;
  path g1=subpath(c1,t*l1,(t+step)*l1);
  path g2=subpath(c2,t*l2,(t+step)*l2);
  pair A=(relpoint(c1,t)+relpoint(c2,t))/2;
  pair B=(relpoint(c1,t+step)+relpoint(c2,t+step))/2;
  path sector=g1--reverse(g2)--cycle;
  pen trans=opacity(((2-(2*i/n)^1.5))/2);
  axialshade(sector,trans+i/n*white,A,trans+(i+1)/n*white,B);
}
shipout(bbox(lightblue+white,Fill),format="pdf");