Asymptote Gallery Tagged by “Hyperbola” #127
geometry-fig034
Show geometry/fig0340.asy on Github.
Generated with Asymptote 3.00-0.
Categories : Examples 2D | Geometry.asy
Tags : #Geometry | #Draw (2D) | #Clip | #Deferred drawing | #Hyperbola | #Line
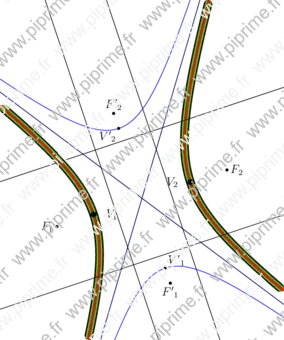
import geometry;
size(10cm,0);

// currentcoordsys=cartesiansystem((2,1),i=(1,0.5),j=(-0.25,.75));
// show(currentcoordsys);

point F1=(1,0);
point F2=(4,1);
dot("$F_1$",F1,W);
dot("$F_2$",F2);

// Enlarge the bounding box of the current picture
draw(box((0,-2), (5,4)), invisible);

/*<asyxml><view file="modules/geometry.asy" type="hyperbola" signature="hyperbola(point,point,real,bool)"/></asyxml>*/
hyperbola h=hyperbola(F1, F2, 0.9);
draw(h, linewidth(3mm));
draw(h.A1, grey);
draw(h.A2, grey);
draw(h.D1);
draw(h.D2);

/*<asyxml><view file="modules/geometry.asy" type="hyperbola" signature="hyperbola(point,real,real,real)"/></asyxml>*/
draw(hyperbola(h.C, h.a, h.b, h.angle), 2mm+green);

/*<asyxml><view file="modules/geometry.asy" type="hyperbola" signature="hyperbola(bqe)"/></asyxml>*/
draw(hyperbola(equation(h)), 1mm+red);

/*<asyxml><view file="modules/geometry.asy" type="hyperbola" signature="conj(hyperbola)"/></asyxml>*/
hyperbola ch=conj(h);
draw(ch, blue);
draw(ch.A1, 0.5blue);
draw(ch.A2, 0.5blue);
draw(ch.D1);
draw(ch.D2);
dot("${V'}_1$", ch.V1, NE);
dot("${V'}_2$", ch.V2, SW);
dot("${F'}_1$", ch.F1, S);
dot("${F'}_2$", ch.F2, N);

dot("$V_1$", h.V1, 2E, linewidth(2mm));
dot("$V_2$", h.V2, 2W, linewidth(2mm));
geometry-fig038

Show geometry/fig0380.asy on Github.
Generated with Asymptote 3.00-0.
Categories : Examples 2D | Geometry.asy
Tags : #Geometry | #Line | #Intersection | #Hyperbola
import geometry;
size(10cm);

// currentcoordsys=cartesiansystem((2,1),i=(1,0.5),j=(-0.25,.75));
// show(currentcoordsys);

// Enlarge the bounding box of the current picture
draw(box((-6,-5), (10,2)), invisible);

point A=(-2,-2);
point B=(2,-3);
dot("$A$",A,N,red);
dot("$B$",B,S,red);

line l=line(A,B);
draw(l);

point C=(2,-1.5);
dot("$C$",C,N);

hyperbola h=hyperbola(C,sqrt(2),sqrt(2)/2,0);
draw(h);

/*<asyxml><view file="modules/geometry.asy" type="point[]" signature="intersectionpoints(line,hyperbola)"/></asyxml>*/
point[] inter=intersectionpoints(l,h);
dot("$M$", inter[0], 2N+E, red);
dot("$N$", inter[1], 2S+E, red);
geometry-fig048

Show geometry/fig0480.asy on Github.
Generated with Asymptote 3.00-0.
Categories : Examples 2D | Geometry.asy
Tags : #Geometry | #Line | #Intersection | #Hyperbola | #Abscissa | #Point | #Tangent
import geometry;
size(10cm);

point C=(4,2);
dot("$C$",C,E+NE,red);

hyperbola h=hyperbola(C,1.5,1,-20);
draw(h, linewidth(bp));

/*<asyxml><view file="modules/geometry.asy" type="line" signature="tangent(hyperbola,abscissa)"/></asyxml>*/
line l=tangent(h,angabscissa(85));
draw(l, grey);
dot(intersectionpoints(h,l));

l=tangent(h,angabscissa(0,fromCenter));
draw(l, grey);
dot(intersectionpoints(h,l));

// Enlarge the bounding box of the current picture.
draw(box((-1,-0.5), (9,4)), invisible);
geometry-fig049
Show geometry/fig0490.asy on Github.
Generated with Asymptote 3.00-0.
Categories : Examples 2D | Geometry.asy
Tags : #Geometry | #Line | #Intersection | #Hyperbola | #Point | #Tangent
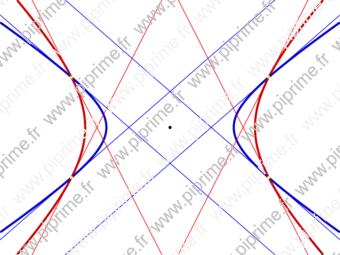
import geometry;
size(12cm);

point C=(0,0);
dot(C);

hyperbola[] h;
h[0]=hyperbola(C,2,2);
h[1]=hyperbola(C,1.5,1);

draw(h[0], 2bp+0.8*red);
draw(h[1], 2bp+0.8*blue);

point[] P=intersectionpoints(h[0],h[1]);

line[] l;
for (int i=0; i < P.length; ++i) {
  for (int j=0; j < 2; ++j) {
    /*<asyxml><view file="modules/geometry.asy" type="line[]" signature="tangents(hyperbola,point)"/></asyxml>*/
    l=tangents(h[j],P[i]);
    draw(l[0], j == 0 ? red : blue);
  }
}

dot(P, yellow);

// Enlarge the bounding box of the current picture.
draw(box((-4,-3), (4,3)), invisible);
geometry-fig068
Show geometry/fig0680.asy on Github.
Generated with Asymptote 3.00-0.
Categories : Examples 2D | Geometry.asy
Tags : #Geometry | #Abscissa | #Hyperbola | #Point | #Arc
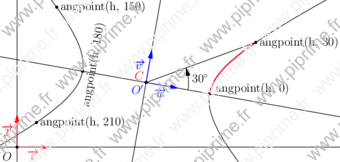
import geometry;
size(12cm);

// currentcoordsys=cartesiansystem((0,0),i=(1,0.5),j=(-0.5,.75));
coordsys R=currentcoordsys;
show(R);

point C=(4,2);
dot("$C$", C, NW, red);

hyperbola h=hyperbola(C, 2, 1.5, -10);
draw(h);

///////////////////////////////////////
currentpolarconicroutine=fromCenter;//
/////////////////////////////////////

coordsys Rp=canonicalcartesiansystem(h);
show(Label("$O'$", align=SW,blue),
     Label("$\vec{u}$",blue),
     Label("$\vec{v}$",blue),
     Rp, ipen=blue);

/*<asyxml><view file="modules/geometry.asy" type="point" signature="angpoint(explicit hyperbola,real,polarconicroutine)"/></asyxml>*/
dot("angpoint(h, 0)", angpoint(h,0), E+NE);
dot(rotate(80)*"angpoint(h, 180)", angpoint(h,180),E);

draw(arcfromcenter(h,0,30), bp+red);

// point(p,angbscissa(150)) can be replaced by angpoint(p,150)
dot("angpoint(h, 150)", point(h, angabscissa(150)), E);

point P=point(h, angabscissa(210));
dot("angpoint(h, 210)", P, E);

point P=angpoint(h, 30);
dot("angpoint(h, 30)", P, E);

segment s=segment(C, P);
draw(s);
markangle("$30^\circ$", Ox(Rp),(line) s, radius=1.5cm, Arrow);
geometry-fig072
Show geometry/fig0720.asy on Github.
Generated with Asymptote 3.00-0.
Categories : Examples 2D | Geometry.asy
Tags : #Geometry | #Abscissa | #Hyperbola | #Point
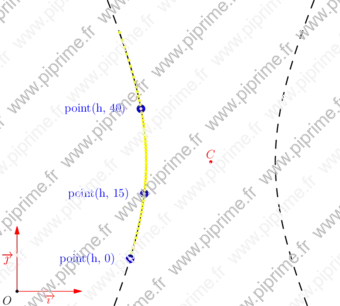
import geometry;
size(12cm);

// currentcoordsys=cartesiansystem((0,0),i=(1,0.5),j=(-0.5,.75));
show(currentcoordsys, xpen=invisible);

point C=(3,2);
dot("$C$", C, N, red);

// Enlarge the bounding box of the current picture.
draw(box((0,0),(5,4.5)), invisible);

hyperbola h=hyperbola(C, 1, 2);

draw(h, bp+dashed); /* Defered drawing to adjust the path to the final
                       bounding box.*/

// Define the bounding box to draw the hyperbola.
// Try finalbounds(); to determine the final bounding box.
h.bmin=(0,0.5); h.bmax=(5,4);
draw((path)h, linewidth(bp)); /* The path of 'p' is restricted to the box whose
                                 the corners are p.bmin, p.bmax.*/

/*<asyxml><view file="modules/geometry.asy" type="point" signature="point(explicit hyperbola,explicit real)"/></asyxml>*/
dot("point(h, 0)", point(h,0), 2W, 3mm+blue);

dot("point(h, 15)", point(h,15), 2W, 3mm+blue);

/*<asyxml><view file="modules/geometry.asy" type="abscissa" signature="nodabscissa(real)"/></asyxml>*/
dot("point(h, 40)", point(h,nodabscissa(40)), 2W,3mm+blue);
// point(h,nodabscissa(40)) can be replaced by point(h,40)

/*<asyxml><view file="modules/geometry.asy" type="real[]" signature="bangles(picture,hyperbola)"/></asyxml>*/
real[][] bg=bangles(h);

dot((path)h, yellow);
geometry-fig076
Show geometry/fig0760.asy on Github.
Generated with Asymptote 3.00-0.
Categories : Examples 2D | Geometry.asy
Tags : #Geometry | #Ellipse | #Draw (2D) | #Circle | #Parabola | #Hyperbola | #Conic | #Intersection
import geometry;
size(12cm);

// currentcoordsys=cartesiansystem((2,1),i=(1,0.5),j=(-0.25,0.75));
// currentcoordsys=cartesiansystem((2,1),i=rotate(45)*(1,0),j=rotate(45)*(0,1));
// show(currentcoordsys);

conic co[];
co[0]=circle((point)(0,0),1);
/*<asyxml><view file="modules/geometry.asy" type="void" signature="draw(picture,Label,explicit conic,align,pen,arrowbar,arrowbar,margin,Label,marker)"/></asyxml>*/
draw(co[0]);

co[1]=ellipse((point)(0,0),4,1);
draw(co[1]);

co[2]=parabola((0,0),1,90);
draw(co[2]);

hyperbola h=hyperbola((-1,0),(1,0),1.2,byvertices);
co[3]=h;
draw(co[3]);
draw(h.A1,grey);
draw(h.A2,grey);

dotfactor *= 1;

for (int i=0; i < 4; ++i) {
  dot(intersectionpoints(h.A1,co[i]),blue);
  dot(intersectionpoints(h.A2,co[i]),blue);
  for (int j=i+1; j < 4; ++j)
    /*<asyxml><view file="modules/geometry.asy" type="point[]" signature="intersectionpoints(conic,conic)"/></asyxml>*/
    dot(intersectionpoints(co[i],co[j]), red);
}
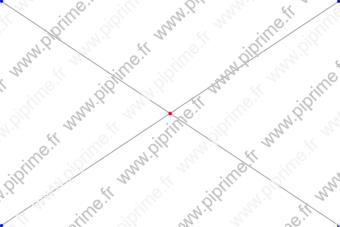
graph-fig024
Show graph/fig0250.asy on Github.
Generated with Asymptote 3.00-0.
Categories : Examples 2D | Graph.asy
Tags : #Graph | #Function (drawing) | #Hyperbola | #Contour | #Function (implicit)
size(10cm,0);
import contour;
import graph;

xlimits( -3, 3);
ylimits( -3, 3);
yaxis( "$y$" , Ticks());
xaxis( "$x$", Ticks());

real f(real x, real y) {return x*y;}

draw(contour(f,(-3,-3),(3,3),new real[] {1}));
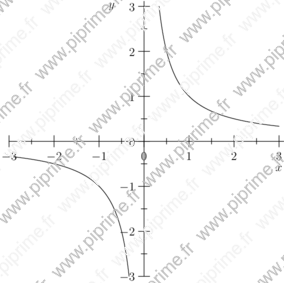
graph-fig025

Show graph/fig0260.asy on Github.
Generated with Asymptote 3.00-0.
Categories : Examples 2D | Graph.asy
Tags : #Graph | #Function (drawing) | #Hyperbola | #Contour | #Function (implicit) | #Array
size(10cm,0);
import contour;
import stats;
import graph;

xlimits( -5, 5);
ylimits( -4, 5);
yaxis( "$y$" , Ticks(Label(currentpen+fontsize(8),align=E)));
xaxis( "$x$", Ticks(Label(currentpen+fontsize(8))));

real f(real x, real y) {return x^2-x-y^2+3y-6;}

int min=-5,
  max=5,
  n=max-min+1;

real[] value=sequence(min,max);

pen[] p=sequence(new pen(int i) {
    return (value[i] >= 0 ? solid : dashed) +
    (value[i] >= 0 ? (value[i]/max)*red : (value[i]/min)*blue) +
    fontsize(4);
  },n);

Label[] Labels=sequence(new Label(int i) {
    return Label(value[i] != 0 ? (string) value[i] : "",Relative(unitrand()),(0,0),
                 UnFill(1bp));
  },n);

draw(Labels,contour(f,(-5,-5),(5,5),value),p);