Examples of code using tube.asy from the Asymptote drawing
software
tube-fig001
Show tube/fig0010.asy on Github.
Generated with Asymptote 3.00-0.
Categories : Examples 3D | Tube.asy
Tags : #Tube
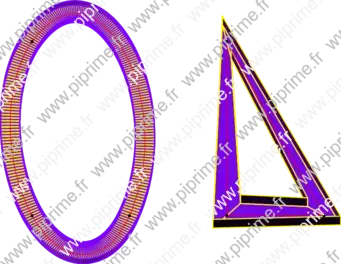
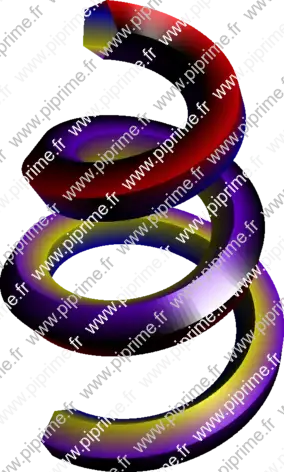
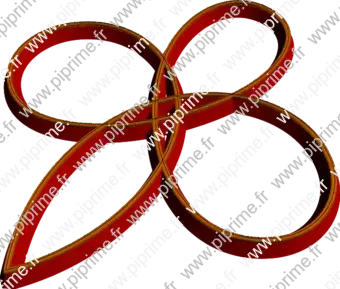
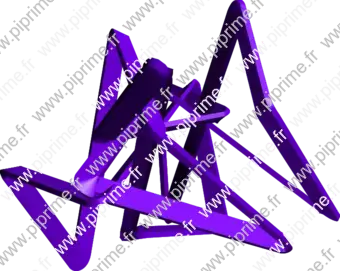
import tube;
size(12cm,0);

currentprojection=orthographic(0,0.5,1);

// The tube's section used is a path (here an U);
path section=rotate(90)*(N+W--W--E--N+E);

// The tubed curve (yellow tube) has three nodes joined with cubic spline:
path3 p=shift(20X)*scale(10,20,1)*(X..Y..X+Y..cycle);

// A tube is a surface, here the tube is drawn in yellow with purple meshes.
draw(tube(p,section), yellow, bp+purple);
draw(p,red); dot(p);

// The tubed curve (purple tube) has three nodes joined with linear segments:
path3 p=scale(10,20,1)*(X--Y--(X+Y)--cycle);

// Here the tube is drawn in purple with yellow meshes.
draw(tube(p,scale(2)*section), purple, bp+yellow);
draw(p,red); dot(p);
tube-fig002
Show tube/fig0020.asy on Github.
Generated with Asymptote 3.00-0.
Categories : Examples 3D | Tube.asy
Tags : #Tube
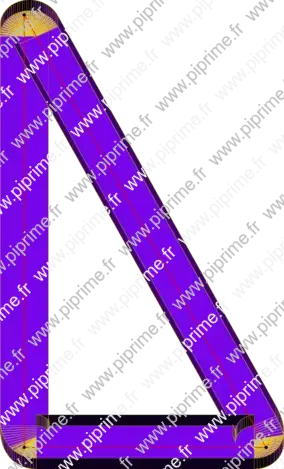
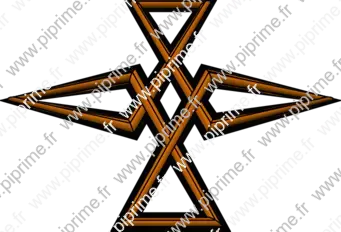
import tube;
size(10cm,0);

currentprojection=orthographic(0,0.5,1);
path section=rotate(90)*(N+W--W--E--N+E);

// The tubed curve has three nodes joined with linear segments.
path3 p=scale(10,20,1)*(X--Y--(X+Y)--cycle);

// We may use the routine roundedpath in order to obtain rounded corner:
draw(tube(roundedpath(p,r=0.05),
          section,
          corner=100), // Controls the number of elementary tubes at the corners
     purple, bp+yellow+thin());
draw(p,red); dot(p);
tube-fig003
Show tube/fig0030.asy on Github.
Generated with Asymptote 3.00-0.
Categories : Examples 3D | Tube.asy
Tags : #Tube
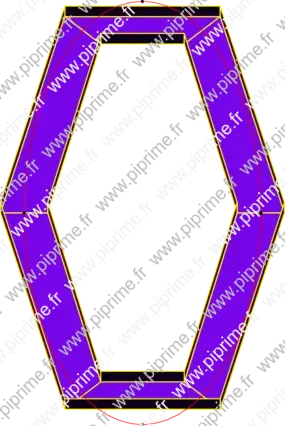
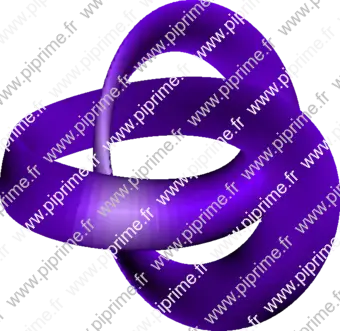
import tube;
size(10cm,0);

currentprojection=orthographic(0,0.5,1);
path section=rotate(180)*(N+W--W--E--N+E);

path3 p=scale(5,10,1)*unitcircle3;

draw(tube(p, section,
          relstep=1/6), // Fix the sample step of the relative time (reltime) of the elementary tubes.
     purple, bp+yellow);
draw(p,red); dot(p);
tube-fig004

Show tube/fig0040.asy on Github.
Generated with Asymptote 3.00-0.
Categories : Examples 3D | Tube.asy
Tags : #Tube | #Graph (3D)
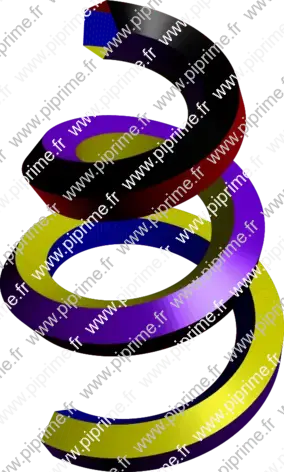
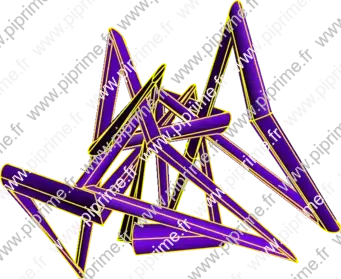
import tube;
import graph3;

size(10cm,0);
currentprojection=perspective(4,3,4);

triple f(real t){
  return t*Z+(cos(2pi*t),sin(2pi*t),0)/sqrt(1+0.5*t^2);
}

path3 p=graph(f,0,2.7,operator ..);
draw(tube(p,scale(0.2)*polygon(5)), purple);
tube-fig005
Show tube/fig0050.asy on Github.
Generated with Asymptote 3.00-0.
Categories : Examples 3D | Tube.asy
Tags : #Tube | #Graph (3D) | #Shading (3D)
import tube;
import graph3;

size(10cm,0);
currentprojection=perspective(4,3,4);
real x(real t) {return (1/sqrt(1+0.5*t^2))*cos(2pi*t);}
real y(real t) {return (1/sqrt(1+0.5*t^2))*sin(2pi*t);}
real z(real t) {return t;}

path3 p=graph(x,y,z,0,2.7,operator ..);
path section=scale(0.2)*polygon(5);

// tube.asy defines a "colored path".
// The value of coloredtype may be coloredSegments or coloredNodes.
// Here the path scale(0.2)*polygon(5) has fixed colored SEGMENTS.
coloredpath cp=coloredpath(section,
                           // The array of pens become automatically cyclic.
                           new pen[]{0.8*red, 0.8*blue, 0.8*yellow, 0.8*purple, black},
                           colortype=coloredSegments);

// Draw the tube, each SEGMENT of the section is colored.
draw(tube(p,cp));
tube-fig006
Show tube/fig0060.asy on Github.
Generated with Asymptote 3.00-0.
Categories : Examples 3D | Tube.asy
Tags : #Tube | #Graph (3D) | #Shading (3D)
import tube;
import graph3;

size(10cm,0);
currentprojection=perspective(4,3,4);
real x(real t) {return (1/sqrt(1+0.5*t^2))*cos(2pi*t);}
real y(real t) {return (1/sqrt(1+0.5*t^2))*sin(2pi*t);}
real z(real t) {return t;}

path3 p=graph(x,y,z,0,2.7,operator ..);
path section=scale(0.2)*polygon(5);

// Here the path scale(0.2)*polygon(5) has colored NODES.
coloredpath cp=coloredpath(section,
                           new pen[]{0.8*red, 0.8*blue, 0.8*yellow, 0.8*purple, black},
                           colortype=coloredNodes);

// Draw the tube, each NODE of the section is colored.
draw(tube(p,cp));
tube-fig007

Show tube/fig0070.asy on Github.
Generated with Asymptote 3.00-0.
Categories : Examples 3D | Tube.asy
Tags : #Tube | #Graph (3D) | #Shading (3D)
import tube;
import graph3;

size(10cm,0);
currentprojection=perspective(4,3,4);
real x(real t) {return (1/sqrt(1+0.5*t^2))*cos(2pi*t);}
real y(real t) {return (1/sqrt(1+0.5*t^2))*sin(2pi*t);}
real z(real t) {return t;}

path3 p=graph(x,y,z,0,2.7,operator ..);
path section=scale(0.2)*polygon(5);

// Define a pen wich depends of a real t. t represent the "reltime" of the path3 p.
pen pen(real t){
  return interp(red,blue,1-2*abs(t-0.5));
}

// Here the section has colored segments (by default) depending to reltime.
draw(tube(p,coloredpath(section,pen)));
tube-fig008
Show tube/fig0080.asy on Github.
Generated with Asymptote 3.00-0.
Categories : Examples 3D | Tube.asy
Tags : #Tube | #Graph (3D) | #Shading (3D)
import tube;
import graph3;
size(12cm,0);
currentprojection=perspective((-1,1,1));

int p=7, q=3;
real n=p/q;
real a=1, b=1;
real x(real t){return a*cos(t);}
real y(real t){return a*sin(t);}
real z(real t){return b*cos(n*t);}

real R(real t){
  real st2=(n*sin(n*t))^2;
  return a*(1+st2)^(1.5)/sqrt(1+st2+n^4*cos(n*t)^2);
  // return -a*(1+st2)^(1.5)/sqrt(1+st2+n^4*cos(n*t)^2); // Signed radius curvature
}

real mt=q*2*pi;
path3 p=graph(x,y,z,0,mt,operator ..)..cycle;

real m=R(0), M=R(0.5*pi/n);

// Define a pen depending to the radius curvature of graph(x,y,z) at reltime t
pen curvaturePen(real t){
  real r=abs(R(t*mt)-m)/(M-m);
  return interp(red,blue,r);
}

// Draw the tube, colors depend of the radius curvature R.
draw(tube(p,coloredpath(scale(0.1)*unitcircle, curvaturePen)));
tube-fig009
Show tube/fig0090.asy on Github.
Generated with Asymptote 3.00-0.
Categories : Examples 3D | Tube.asy
Tags : #Tube | #Graph (3D) | #Shading (3D) | #Array
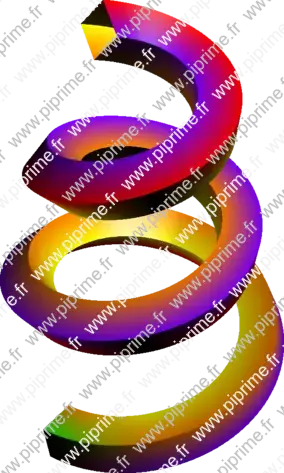
import tube;
import graph3;

size(10cm,0);
currentprojection=perspective(4,3,4);
real x(real t) {return (1/sqrt(1+0.5*t^2))*cos(2pi*t);}
real y(real t) {return (1/sqrt(1+0.5*t^2))*sin(2pi*t);}
real z(real t) {return t;}

path3 p=graph(x,y,z,0,2.7,operator ..);
path section=scale(0.2)*polygon(4);

// Define an array of pen wich depends of a real t. t represent the "reltime" of the path3 p.
pen[] pens(real t){
  return new pen[] {interp(blue,red,t),
      interp(orange,yellow,t),
      interp(green,orange,t),
      interp(red,purple,t)};
}

// "pen[] pens(real t)" allows to color each nodes or segments with a real parameter (the reltime)
// Note that all arrays of pens are convert to cyclical arrays.
draw(tube(p,coloredpath(section,
                        pens,
                        colortype=coloredNodes)));
tube-fig010

Show tube/fig0100.asy on Github.
Generated with Asymptote 3.00-0.
Categories : Examples 3D | Tube.asy
Tags : #Tube | #Transform (3D)
import tube;
import graph3;
size(12cm,0);
currentprojection=orthographic(4,3,2);

real x(real t) {return sin(t);}
real y(real t) {return cos(t);}
real z(real t) {return sqrt(t);}

path3 p=graph(x,y,z,0,4pi,50,operator ..);

path section=subpath(unitcircle,0,2);

pen pens(real t){
  return interp(red,blue,t);
}

// Define a transformation wich will be applied to each section at reltime t.
transform T(real t){return scale(t^0.75/2);}

// Combination of pens and transform:
draw(tube(p,coloredpath(section,pens), T));
draw(p);
tube-fig011

Show tube/fig0110.asy on Github.
Generated with Asymptote 3.00-0.
Categories : Examples 3D | Tube.asy
Tags : #Tube
import tube;
import graph3;
size(12cm,0);
currentprojection=orthographic(4,3,4);

real x(real t) {return sin(t);}
real y(real t) {return 0.5*sin(2*t);}

path g=graph(x,y,0,2pi,50,operator ..);
path3 p=path3(scale(5)*g);

pen pen(real t){
  return interp(red,blue,1-2*abs(t-0.5));
}

draw(tube(p,coloredpath(subpath(unitcircle,1,3),pen)));
draw(p);
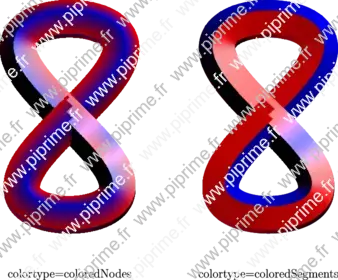
tube-fig012
Show tube/fig0120.asy on Github.
Generated with Asymptote 3.00-0.
Categories : Examples 3D | Tube.asy
Tags : #Tube | #Shading (3D)
import tube;
import graph3;
size(12cm,0);
currentprojection=orthographic(1,0,6);

real x(real t) {return sin(t);}
real y(real t) {return 0.5*sin(2*t);}

path g=graph(x,y,0,2pi,50,operator ..);
path3 p=path3(scale(5)*g);

pen[] pens(real t){
  real tt=1-2*abs(t-0.5);
  return new pen[] {interp(red,blue,tt), interp(blue,red,tt)};
}

draw(tube(p,
          coloredpath(polygon(5),pens,colortype=coloredNodes)));
label("colortype=coloredNodes",8*X);

draw(tube(shift(10*Y)*p,
          coloredpath(polygon(5),pens,colortype=coloredSegments)));
label("colortype=coloredSegments",8*X+10Y);
tube-fig013
Show tube/fig0130.asy on Github.
Generated with Asymptote 3.00-0.
Categories : Examples 3D | Tube.asy
Tags : #Tube | #Path | #Graph
import tube;
import graph;
size(12cm,0);
currentprojection=perspective(4,3,6);

real f(real t) {return cos(2*t);}
path g=polargraph(f,0,2pi,10,operator ..)&cycle;
path3 p=path3(scale(20)*g);

draw(tube(p,rotate(60)*polygon(3)), 0.8*red);
draw(tube(shift(Z)*p,scale(0.25)*unitcircle), orange);
draw(shift(1.25*Z)*p);
tube-fig014
Show tube/fig0140.asy on Github.
Generated with Asymptote 3.00-0.
Categories : Examples 3D | Tube.asy
Tags : #Tube | #Path | #Graph
import tube;
import graph;
size(12cm,0);
currentprojection=perspective(0,3,6);

real f(real t) {return cos(2*t);}
path g=polargraph(f,0,2pi,10,operator --)&cycle;
path3 p=path3(scale(20)*g);

draw(tube(p,2W--2E), red, bp+black);
draw(tube(p,unitcircle), orange, bp+black);
tube-fig015

Show tube/fig0150.asy on Github.
Generated with Asymptote 3.00-0.
Categories : Examples 3D | Tube.asy
Tags : #Tube
import tube;
import graph3;
size(12cm,0);
// currentprojection=perspective((2,1,6),-Z); real q=1;
currentprojection=perspective((-1,1,1)); real q=2;

real x(real t){return (1-cos(t))*cos(q*t);}
real y(real t){return (1-cos(t))*sin(q*t);}
real z(real t){return cos(3t);}

path3 p=graph(x,y,z,0,2pi,20,operator ..);
draw(tube(p,scale(0.4,0.1)*unitcircle), purple);
tube-fig016
Show tube/fig0160.asy on Github.
Generated with Asymptote 3.00-0.
Categories : Examples 3D | Tube.asy
Tags : #Tube
import tube;
import graph3;
size(12cm,0);

currentprojection=perspective(1,-1,0);

real x(real t)
{
return 41*cos(t)-18*sin(t)-83*cos(2t)-83*sin(2t)-11*cos(3t)+27*sin(3t);
}

real y(real t)
{
  return 36*cos(t)+27*sin(t)-113*cos(2t)+30*sin(2t)+11*cos(3t)-27*sin(3t);
}

real z(real t)
{
  return 45*sin(t)-30*cos(2t)+113*sin(2t)-11*cos(3t)+27*sin(3t);
}

path3 p=scale3(0.05)*graph(x,y,z,-pi,pi,200,operator --)&cycle;

path section=scale(2,0.5)*unitcircle;
// path section=scale(2,0.5)*polygon(4);
// path section=scale(2)*polygon(6);
draw(tube(p,section), purple);
tube-fig017
Show tube/fig0170.asy on Github.
Generated with Asymptote 3.00-0.
Categories : Examples 3D | Tube.asy
Tags : #Tube
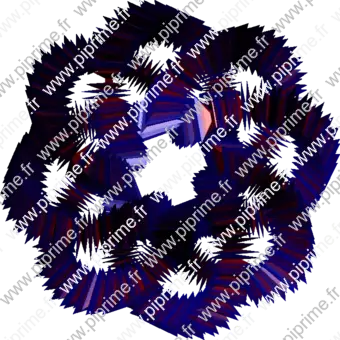
import tube;
import graph3;
size(12cm,0);

currentprojection=perspective(1,-1,0);


path3 p=scale3(20)*randompath3(20,false,operator--)--cycle;

path section=scale(1,0.5)*unitcircle;
// path section=polygon(6);
// path section=scale(1,0.25)*polygon(4);
draw(tube(p,section), purple, bp+yellow);
tube-fig018
Show tube/fig0180.asy on Github.
Generated with Asymptote 3.00-0.
Categories : Examples 3D | Tube.asy
Tags : #Tube
import tube;
import graph3;
size(12cm,0);

currentprojection=perspective(1,-1,0);


path3 p=scale3(20)*randompath3(20,false,operator--)--cycle;

path section=scale(1,0.25)*polygon(4);
draw(tube(roundedpath(p,0.05),section, corner=10), purple);
tube-fig019
Show tube/fig0190.asy on Github.
Generated with Asymptote 3.00-0.
Categories : Examples 3D | Tube.asy
Tags : #Tube
import tube;
import solids;

size(12cm,0);
currentprojection=perspective((0,0,1));

int p=8, q=3;
real n=p/q, R=2, r=1;

real x(real t){return (R+r*cos(n*t))*cos(t);}
real y(real t){return (R+r*cos(n*t))*sin(t);}
real z(real t){return r*sin(n*t);}

path3 p=graph(x,y,z,0,6pi,200,operator ..)&cycle;

revolution torus=revolution(Circle(R*X,r,Y,10),Z);

transform T(real t){return scale(0.3+0.25*sin(t*20pi));}

pen[] bpen={0.5red,0.5blue};
bpen.cyclic=true;
pen pen(real t){return bpen[ceil(sin(t*20pi)-1e-3)];}

draw(tube(p,coloredpath(polygon(3),pen),T));
// draw(surface(torus),yellow);
tube-fig020
Show tube/fig0200.asy on Github.
Generated with Asymptote 3.00-0.
Categories : Examples 3D | Tube.asy
Tags : #Tube
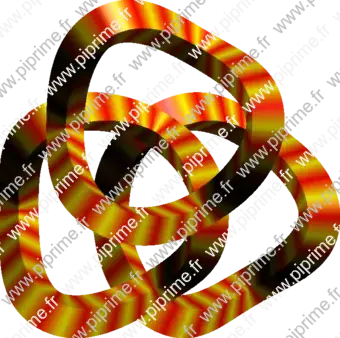
// Anneau de Borrommée
// Borromean rings

import tube;
import solids;

size(12cm,0);
currentprojection=perspective((0,0,1));

real a=5, b=2, sq3=sqrt(3);
for (int i=0; i <= 2; ++i) {
  real ai, bi;
  if(i == 0) {
    ai=a/2;
    bi=a*sq3/2;
  } else if(i == 1) {
    ai=-a/2;
    bi=a*sq3/2;
  } else {
    ai=0;
    bi=a*sq3;
  }
  real x(real t){return a*cos(t)+ai;}
  real y(real t){return a*sin(t)+bi;}
  real z(real t){return b*cos(3t);}

  path3 p=graph(x,y,z,0,2pi,100,operator ..)&cycle;


  real trig(real t){return 1-2*abs(t%1-0.5);}
  pen pens(real t) {
    real tt=trig(t+i/3);
    return interp(red,yellow,(tt));
  }

  draw(tube(p, coloredpath(polygon(4),pens)));
}
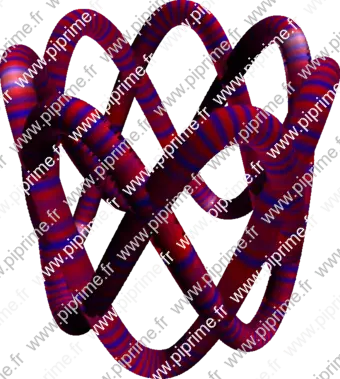
tube-fig021
Show tube/fig0210.asy on Github.
Generated with Asymptote 3.00-0.
Categories : Examples 3D | Tube.asy
Tags : #Tube | #Palette | #Shading (3D) | #Graph (3D)
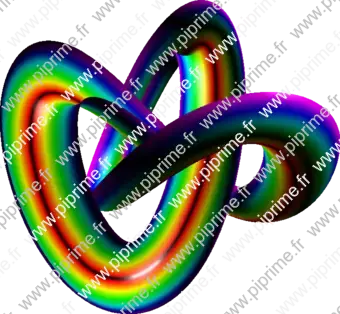
import tube;
import graph3;
import palette;

size(12cm,0);
currentprojection=perspective(1,1,1);

int e=1;
real x(real t) {return cos(t)+2*cos(2t);}
real y(real t) {return sin(t)-2*sin(2t);}
real z(real t) {return 2*e*sin(3t);}

path3 p=scale3(2)*graph(x,y,z,0,2pi,50,operator ..)&cycle;

pen[] pens=Rainbow(15);
pens.push(black);
for (int i=pens.length-2; i >= 0 ; --i)
  pens.push(pens[i]);

path sec=subpath(Circle(0,1.5,2*pens.length),0,pens.length);
coloredpath colorsec=coloredpath(sec, pens,colortype=coloredNodes);
draw(tube(p,colorsec));