Asymptote Gallery Tagged by “Transform (3D)” #162
solids-fig004
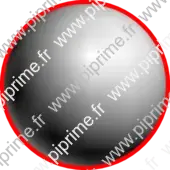
Show solids/fig0040.asy on Github.
Generated with Asymptote 3.00-0.
Categories : Examples 3D | Solids.asy
Tags : #Solid | #Transform (3D) | #Revolution | #Surface | #Sphere | #Projection (3D)
import solids;
size(6cm,0);

currentprojection=orthographic(100,150,30);

real r=1;

skeleton s;
revolution sph=sphere(O,r);
draw(surface(sph), palegray);

path3 cle=rotate(90,X)*scale3(r)*unitcircle3;

triple cam=unit(currentprojection.camera);
real a=degrees(xypart(cam),false)-90;
real b=-sgn(cam.z)*aCos(sqrt(cam.x^2+cam.y^2)/abs(cam));
cle=rotate(b,cross(Z,cam))*rotate(a,Z)*cle;
draw(cle,4pt+red);
solids-fig005
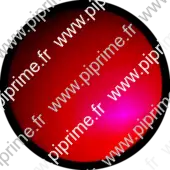
Show solids/fig0050.asy on Github.
Generated with Asymptote 3.00-0.
Categories : Examples 3D | Solids.asy
Tags : #Projection (3D) | #Solid | #Transform (3D) | #Revolution | #Surface | #Sphere | #Light (3D)
import solids;
size(6cm,0);
currentlight=light(diffuse=yellow, specular=blue, specularfactor=5, (5,-5,10));
// currentprojection=orthographic(100,100,30);
real r=2;

skeleton s;
revolution sph=sphere(O,r);
draw(surface(sph),red);

triple cam=unit(currentprojection.camera);
revolution cle=revolution(O,r*(rotate(90,Z)*cam),cam);
draw(cle, 8pt+black);
solids-fig006

Show solids/fig0060.asy on Github.
Generated with Asymptote 3.00-0.
Categories : Examples 3D | Solids.asy
Tags : #Solid | #Transform (3D) | #Sphere | #Projection (3D) | #
// Author: John Bowman
import three;
size(6cm,0);
currentprojection=perspective(10,100,50);
real a=2.5;

draw(scale3(a)*unitsphere,lightyellow);
draw(align(unit(currentprojection.vector()))*scale3(a)*unitcircle3,2bp+red);
solids-fig008

Show solids/fig0080.asy on Github.
Generated with Asymptote 3.00-0.
Categories : Examples 3D | Solids.asy
Tags : #Solid | #Plane | #Shading (3D) | #Transform (3D) | #Projection (3D) | #Surface | #Palette
import solids;
import palette;
size(14cm,0);
currentlight=light(
  gray(0.4),
  specularfactor=3,
  (-0.5,-0.25,0.45),
  (0.5,-0.5,0.5),(0.5,0.5,0.75)
);

nslice=4*nslice;
surface s=surface(sphere(O,1));
draw(s,lightgrey);

path3 pl=plane((1,0,0),(0,1,0),(0,0,-1));
surface pls=shift(3,3,-1e-3)*scale(-6,-6,1)*surface(pl);
draw(pls,0.7*red);

real dist(triple z){return abs(z-Z);}

surface shade;
for (int i=0; i < currentlight.position.length; ++i) {
  shade=planeproject(pl,currentlight.position[i])*s;
  draw(shade,mean(palette((shade.map(dist)),
                          Gradient(black,gray(0.6)))),
       nolight);
}
solids-fig013
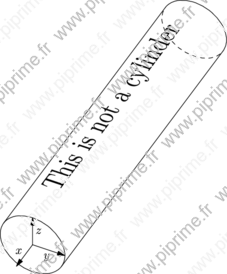
Show solids/fig0130.asy on Github.
Generated with Asymptote 3.00-0.
Categories : Examples 3D | Solids.asy
Tags : #Solid | #Label (3D) | #Transform (3D) | #Projection (3D) | #Revolution
import solids;
size(8cm,0);
currentprojection=orthographic((2, 1, 2));

revolution r=cylinder((0, 0, 0), 1, -10, X);

draw(r);
draw("$x$",O--X,Arrow3);
draw("$y$",O--Y,Arrow3);
draw("$z$",O--Z,Arrow3);

label(XY()*(scale(2.5)*"This is not a cylinder"), (-5,0,1), align=Z);
three-fig009
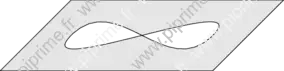
Show three/fig0090.asy on Github.
Generated with Asymptote 3.00-0.
Categories : Examples 3D | Three.asy
Tags : #Plan | #Transform (3D) | #Projection (3D) | #Fill/Unfill | #Path3 | #Triple
size(10cm,0);
import three;

currentprojection=obliqueX;

triple v1=(4,0,0),
       v2=(0,6,0),
       p0=(-2,-3,0);
path3 pl1=plane(v1,v2,p0);

path ph=transform(v1,v2,p0,currentprojection)*((0,-2){W}..(0,2){W}..cycle);
filldraw(project(pl1)^^ph,evenodd+lightgrey);
three-fig010
Show three/fig0100.asy on Github.
Generated with Asymptote 3.00-0.
Categories : Examples 3D | Three.asy
Tags : #Plane | #Label (3D) | #Texpath | #Transform (3D) | #Projection (3D) | #Bsp
size(12cm,0);
import bsp;

currentprojection=orthographic(1,1.5,1);

path3 xy=plane((1,0,0),(0,1,0),(0,0,0));
path3 xz=rotate(90,X)*xy;
path3 yz=rotate(-90,Y)*xy;

face[] f;
filldraw(f.push(xy),project(xy),grey);
filldraw(f.push(xz),project(xz),grey);
filldraw(f.push(yz),project(yz),grey);
add(f);

draw(Label("$x$",EndPoint), O--(1,0,0), Arrow3);
draw(Label("$y$",EndPoint), O--(0,1,0), Arrow3);
draw(Label("$z$",EndPoint), O--(0,0,1), Arrow3);
dot(O);

path[] ph=texpath("$\displaystyle\int_{-\infty}^{+\infty}e^{-\alpha x^2}\,dx=
\sqrt{\frac{\pi}{\alpha}}$");
ph =shift((0.5,0.5))*rotate(-45)*scale(1/abs(min(ph)-max(ph)))*ph;

filldraw(project(path3(ph,XYplane)),0.8*yellow);
filldraw(project(path3(ph,ZXplane)),0.8*yellow);
filldraw(project(path3(ph,YZplane)),0.8*yellow);
three-fig011
Show three/fig0110.asy on Github.
Generated with Asymptote 3.00-0.
Categories : Examples 3D | Three.asy
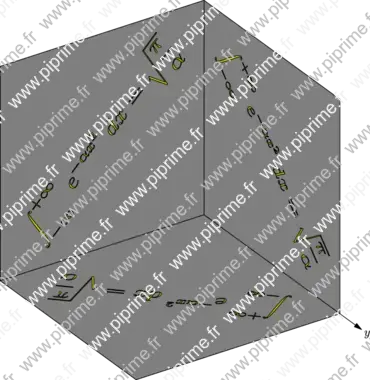
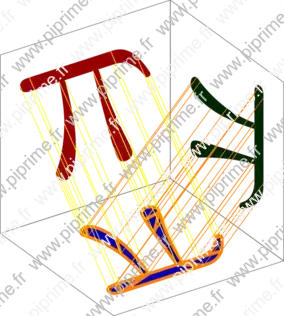
Tags : #Plane | #Label (3D) | #Texpath | #Transform (3D) | #Projection (3D)
import three;
size(10cm,0);
currentprojection=orthographic(1,1.5,1);

path3 xy=XY*unitsquare3, xz=ZX*unitsquare3, yz=YZ*unitsquare3;

draw(xy^^xz^^yz, grey);
path3 p3xy=path3(texpath("$\pi$")[0],XYplane);
p3xy=shift((0.5,0.5,0))*scale3(1/abs(min(p3xy)-max(p3xy)))*p3xy;

surface s=surface(p3xy,planar=true);
draw(s, surfacepen=blue, meshpen=orange+3pt);

transform3 Txz=planeproject(xz,(0,-1,1));
draw(Txz*s, red);

transform3 Tyz=planeproject(yz,(-1,0,1));
draw(Tyz*s, green);

path3 p3xz=Txz*p3xy;
path3 p3yz=Tyz*p3xy;

int lg=length(p3xy);
triple p;
for(int i=0;i<=lg;++i) {
  p=point(p3xy,i);
  draw(p--point(p3xz,i), yellow);
  draw(p--point(p3yz,i), orange);
}
tube-fig010

Show tube/fig0100.asy on Github.
Generated with Asymptote 3.00-0.
Categories : Examples 3D | Tube.asy
Tags : #Tube | #Transform (3D)
import tube;
import graph3;
size(12cm,0);
currentprojection=orthographic(4,3,2);

real x(real t) {return sin(t);}
real y(real t) {return cos(t);}
real z(real t) {return sqrt(t);}

path3 p=graph(x,y,z,0,4pi,50,operator ..);

path section=subpath(unitcircle,0,2);

pen pens(real t){
  return interp(red,blue,t);
}

// Define a transformation wich will be applied to each section at reltime t.
transform T(real t){return scale(t^0.75/2);}

// Combination of pens and transform:
draw(tube(p,coloredpath(section,pens), T));
draw(p);