Figure Asymptote graph3 -- 011
This picture comes from the Asymptote gallery of topic graph3
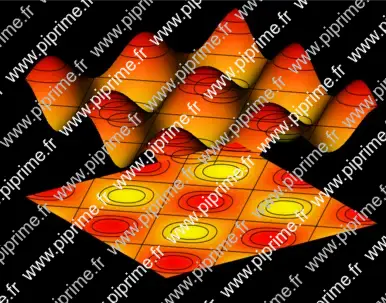
Show graph3/fig0110.asy on Github.
Generated with Asymptote 3.00-0.
Categories : Examples 3D | Graph3.asy
Tags : #Graph (3D) | #Surface | #Level set (3D) | #Contour | #Function (implicit) | #Palette | #Projection (3D) | #Axis (3D) | #Label (3D) | #Shading (3D) | #Shading
import graph3;
import palette;
import contour;
size(14cm,0);
currentprojection=orthographic(-1,-1.5,0.75);
currentlight=(-1,0,5);

real a=1, b=1;
real f(pair z) { return a*(6+sin(z.x/b)+sin(z.y/b));}
real g(pair z){return f(z)-6a;}

// The axes
limits((0,0,4a),(14,14,8a));
xaxis3(Label("$x$",MidPoint),OutTicks());
yaxis3(Label("$y$",MidPoint),OutTicks(Step=2));
ticklabel relativelabel()
{
  return new string(real x) {return (string)(x-6a);};
}
zaxis3(Label("$z$",Relative(1),align=2E),Bounds(Min,Max),OutTicks(relativelabel()));

// The surface
surface s=surface(f,(0,0),(14,14),100,Spline);

pen[] pens=mean(palette(s.map(zpart),Gradient(yellow,red)));

// Draw the surface
draw(s,pens);
// Project the surface onto the XY plane.
draw(planeproject(unitsquare3)*s,pens,nolight);

// Draw contour for "datumz"
real[] datumz={-1.5, -1, 0, 1, 1.5};
guide[][] pl=contour(g,(0,0),(14,14),datumz);
for (int i=0; i < pl.length; ++i)
  for (int j=0; j < pl[i].length; ++j)
    draw(path3(pl[i][j]));

// Draw the contours on the surface
draw(lift(f,pl));

if(!is3D())
  shipout(bbox(3mm,Fill(black)));