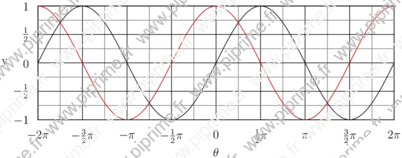
Figure Asymptote graph -- 022
🔗This picture comes from the Asymptote gallery of topic graph

Show graph/fig0230.asy on Github.
Generated with Asymptote 3.00-0.
Categories : Examples 2D | Graph.asy
Tags : #Graph | #Function (drawing) | #Fraction | #Label | #Tex/latex features | #Struct
import graph;
unitsize(x=1cm,y=2cm);

struct rational
{
  int p;
  int q;
  real ep=1/10^5;
};

rational operator init() {return new rational;}

rational rational(real x, real ep=1/10^5)
{
  rational orat;
  int q=1;
  while (abs(round(q*x)-q*x)>ep)
    {
      ++q;
    }
  orat.p=round(q*x);
  orat.q=q;
  orat.ep=ep;
  return orat;
}

int pgcd(int a, int b)
{
  int a_=abs(a), b_=abs(b), r=a_;
  if (b_>a_) {a_=b_; b_=r; r=a_;}
  while (r>0)
    {
      r=a_%b_;
      a_=b_;
      b_=r;
    }
  return a_;
}

string texfrac(int p, int q,
               string factor="",
               bool signin=false, bool factorin=true,
               bool displaystyle=false,
               bool zero=true)
{
  if (p==0) return (zero ? "$0$" : "");
  string disp= displaystyle ? "$\displaystyle " : "$";
  int pgcd=pgcd(p,q);
  int num= round(p/pgcd), den= round(q/pgcd);
  string nums;
  if (num==1)
    if (factor=="" || (!factorin && (den !=1))) nums="1"; else nums="";
  else
    if (num==-1)
      if (factor=="" || (!factorin && (den !=1))) nums="-1"; else nums="-";
    else nums= (string) num;
  if (den==1) return "$" + nums + factor + "$";
  else
    {
      string dens= (den==1) ? "" : (string) den;
      if (signin || num>0)
        if (factorin)
          return disp + "\frac{" + nums + factor + "}{" + (string) dens + "}$";
        else
          return disp + "\frac{" + nums + "}{" + (string) dens + "}"+ factor + "$";
      else
        {
          if (num==-1)
            if (factor=="" || !factorin) nums="1"; else nums="";
          else nums=(string)(abs(num));
        if (factorin)
          return disp + "-\frac{" + nums + factor + "}{" + (string) dens + "}$";
        else
          return disp + "-\frac{" + nums + "}{" + (string) dens + "}"+ factor + "$";
        }
    }
}

string texfrac(rational x,
               string factor="",
               bool signin=false, bool factorin=true,
               bool displaystyle=false,
               bool zero=true)
{
  return texfrac(x.p, x.q, factor, signin, factorin, displaystyle, zero);
}

ticklabel labelfrac(real ep=1/10^5, real factor=1.0,
                    string symbol="",
                    bool signin=false, bool symbolin=true,
                    bool displaystyle=false,
                    bool zero=true)
{
  return new string(real x)
    {
      return texfrac(rational(x/factor), symbol, signin, symbolin, displaystyle, zero);
    };
}

ticklabel labelfrac=labelfrac();

xlimits( -2pi, 2pi);
ylimits( -1, 1);

yaxis("y",LeftRight , Ticks(labelfrac,Step=.5,step=.25, ptick=grey, extend=true));

xaxis("$\theta$",BottomTop, Ticks(labelfrac(factor=pi,symbol="\pi",symbolin=false),
                           Step=pi/2, step=pi/4, ptick=grey, extend=true));

draw(graph(new real(real x){return sin(x);},-2pi,2pi));
draw(graph(new real(real x){return cos(x);},-2pi,2pi), .8red);