Figure Asymptote graph -- 019
This picture comes from the Asymptote gallery of topic graph
Show graph/fig0200.asy on Github.
Generated with Asymptote 3.00-0.
Categories : Examples 2D | Graph.asy
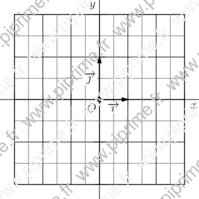
Tags : #Graph | #Axis | #Label | #Grid | #Vector
import graph;

void graphicrules(picture pic=currentpicture, string prefix=defaultfilename, real unit=1cm,
                  real xunit=unit != 0 ? unit : 0,
                  real yunit=unit != 0 ? unit : 0,
                  real xmin, real xmax, real ymin, real ymax)
{
  xlimits(xmin, xmax);
  ylimits(ymin, ymax);
  unitsize(x=xunit, y=yunit);
}

void grid(picture pic=currentpicture,
          real xmin=pic.userMin().x, real xmax=pic.userMax().x,
          real ymin=pic.userMin().y, real ymax=pic.userMax().y,
          real xStep=1, real xstep=.5,
          real yStep=1, real ystep=.5,
          pen pTick=nullpen, pen ptick=grey, bool above=false)
{
  draw(pic,box((xmin,ymin),(xmax,ymax)),invisible);
  xaxis(pic, BottomTop, xmin, xmax, Ticks("%",extend=true,Step=xStep,step=xstep,pTick=pTick,ptick=ptick), above=above);
  yaxis(pic, LeftRight, ymin, ymax, Ticks("%",extend=true,Step=yStep,step=ystep,pTick=pTick,ptick=ptick), above=above);
}

void cartesianaxis(picture pic=currentpicture,
                   Label Lx=Label("$x$",align=S),
                   Label Ly=Label("$y$",align=W),
                   real xmin=pic.userMin().x, real xmax=pic.userMax().x,
                   real ymin=pic.userMin().y, real ymax=pic.userMax().y,
                   real extrawidth=1, real extraheight=extrawidth,
                   pen p=currentpen,
                   ticks xticks=Ticks("%",pTick=nullpen, ptick=grey),
                   ticks yticks=Ticks("%",pTick=nullpen, ptick=grey),
                   bool above=true,
                   arrowbar arrow=Arrow)
{
  extraheight= cm*extraheight/(2*pic.yunitsize);
  extrawidth = cm*extrawidth/(2*pic.xunitsize);
  yequals(pic, Lx, 0, xmin-extrawidth, xmax+extrawidth, p, above, arrow=arrow);
  xequals(pic, Ly, 0, ymin-extraheight, ymax+extraheight, p, above, arrow=arrow);
  yequals(pic, 0, xmin, xmax, p, xticks, above);
  xequals(pic, 0, ymin, ymax, p, yticks, above);
}

void labeloij(picture pic=currentpicture,
              Label Lo=Label("$O$",NoFill),
              Label Li=Label("$\vec{\imath}$",NoFill),
              Label Lj=Label("$\vec{\jmath}$",NoFill),
              pair diro=SW, pair diri=S, pair dirj=W,
              pen p=scale(2)*currentpen,
              filltype filltype=NoFill, arrowbar arrow=Arrow(2mm))
{
  if (Lo.filltype==NoFill) Lo.filltype=filltype;
  if (Li.filltype==NoFill) Li.filltype=filltype;
  if (Lj.filltype==NoFill) Lj.filltype=filltype;
  labelx(pic, Lo, 0, diro, p);
  draw(pic, Li, (0,0)--(1,0), diri, p, arrow);
  draw(pic, Lj, (0,0)--(0,1), dirj, p, arrow);
  dot(pic, (0,0), dotsize(p)+p);
}

//The figure starts here
graphicrules(yunit=1.5cm, xmin=-3, xmax=3, ymin=-2, ymax=2);
grid();
cartesianaxis(arrow=None);
labeloij(UnFill);