Figure Asymptote graph3 -- 010
This picture comes from the Asymptote gallery of topic graph3
Show graph3/fig0100.asy on Github.
Generated with Asymptote 3.00-0.
Categories : Examples 3D | Graph3.asy
Tags : #Graph | #Contour | #Function (implicit) | #Palette | #Axis | #Array
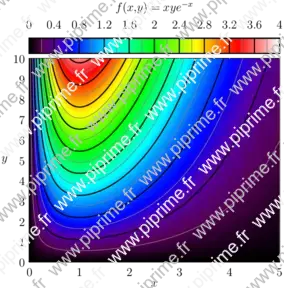
// From documentation of Asymptote
import graph;
import palette;
import contour;
texpreamble("\usepackage{icomma}");

size(10cm,10cm,IgnoreAspect);

pair a=(0,0);
pair b=(5,10);

real fz(pair z) {
  return z.x*z.y*exp(-z.x);
}
real f(real x, real y) {return fz((x,y));}

int N=200;
int Divs=10;
int divs=2;

defaultpen(1bp);
pen Tickpen=black;
pen tickpen=gray+0.5*linewidth(currentpen);
pen[] Palette=BWRainbow();

scale(false);

bounds range=image(f,Automatic,a,b,N,Palette);

xaxis("$x$",BottomTop,LeftTicks(pTick=grey, ptick=invisible, extend=true));
yaxis("$y$",LeftRight,RightTicks(pTick=grey, ptick=invisible, extend=true));

// Major contours
real[] Cvals;
Cvals=sequence(11)/10 * (range.max-range.min) + range.min;
draw(contour(f,a,b,Cvals,N,operator ..),Tickpen);

// Minor contours
real[] cvals;
real[] sumarr=sequence(1,divs-1)/divs * (range.max-range.min)/Divs;
for (int ival=0; ival < Cvals.length-1; ++ival)
    cvals.append(Cvals[ival]+sumarr);
draw(contour(f,a,b,cvals,N,operator ..),tickpen);

palette("$f(x,y)=xye^{-x}$",range,point(NW)+(0,1),point(NE)+(0,0.25),Top,Palette,
        PaletteTicks(N=Divs,n=divs,Tickpen,tickpen));