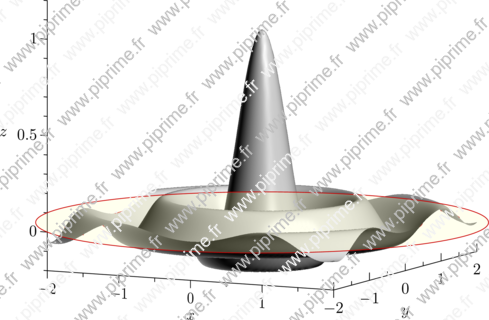
Figure Asymptote graph3 -- 008
This picture comes from the Asymptote gallery of topic graph3
Show graph3/fig0080.asy on Github.
Generated with Asymptote 3.00-0.
Categories : Examples 3D | Graph3.asy
Tags : #Graph (3D) | #Surface | #Level set (3D) | #Contour | #Function (implicit)
// Adapted from the documentation of Asymptote.
import graph3;
import contour;
texpreamble("\usepackage{icomma}");

size3(12cm, 12cm, 8cm, IgnoreAspect);

real sinc(pair z) {
  real r=2pi*abs(z);
  return r != 0 ? sin(r)/r : 1;
}

limits((-2, -2, -0.2), (2, 2, 1.2));
currentprojection=orthographic(1, -2, 0.5);

xaxis3(rotate(90, X)*"$x$",
       Bounds(Min, Min),
       OutTicks(rotate(90, X)*Label, endlabel=false));

yaxis3("$y$", Bounds(Max, Min), InTicks(Label));
zaxis3("$z$", Bounds(Min, Min), OutTicks());

draw(lift(sinc, contour(sinc, (-2, -2), (2, 2), new real[] {0})), bp+0.8*red);
draw(surface(sinc, (-2, -2), (2, 2), nx=100, Spline), lightgray);

draw(scale3(2*sqrt(2))*unitdisk, paleyellow+opacity(0.25), nolight);
draw(scale3(2*sqrt(2))*unitcircle3, 0.8*red);