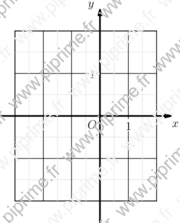
Figure Asymptote graph -- 018
This picture comes from the Asymptote gallery of topic graph

Show graph/fig0190.asy on Github.
Generated with Asymptote 3.00-0.
Categories : Examples 2D | Graph.asy
Tags : #Graph | #Axis | #Label | #Grid
import graph;
unitsize(x=1cm, y=1.5cm);

xlimits( -3, 2);
ylimits( -2, 2);
xaxis(BottomTop, Ticks("%",extend=true, ptick=lightgrey));
yaxis(LeftRight, Ticks("%",extend=true, ptick=lightgrey));
xequals(Label("$y$",align=2NW),0,ymin=-2.5, ymax=2.5, p=linewidth(1.5pt), Arrow(2mm));
yequals(Label("$x$",align=2SE),0,xmin=-3.5, xmax=2.5, p=linewidth(1.5pt), Arrow(2mm));
labelx(Label("$1$",UnFill), 1);
labely(Label("$1$",UnFill), 1);
labelx("$O$",0,SW);
dot((0,0));