Figure Asymptote graph3 -- 009
This picture comes from the Asymptote gallery of topic graph3
Show graph3/fig0090.asy on Github.
Generated with Asymptote 3.00-0.
Categories : Examples 3D | Graph3.asy
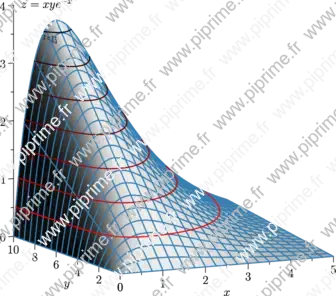
Tags : #Graph (3D) | #Surface | #Level set (3D) | #Contour | #Function (implicit) | #Palette
size(12cm,0,false);
import graph3;
import contour;
import palette;

texpreamble("\usepackage{icomma}");

real f(pair z) {return z.x*z.y*exp(-z.x);}

currentprojection=orthographic(-2.5,-5,1);

draw(surface(f,(0,0),(5,10),20,Spline),palegray,bp+rgb(0.2,0.5,0.7));

scale(true);

xaxis3(Label("$x$",MidPoint),OutTicks());
yaxis3(Label("$y$",MidPoint),OutTicks(Step=2));
zaxis3(Label("$z=xye^{-x}$",Relative(1),align=2E),Bounds(Min,Max),OutTicks);

real[] datumz={0.5,1,1.5,2,2.5,3,3.5};

Label[] L=sequence(new Label(int i) {
    return YZ()*(Label(format("$z=%g$",datumz[i]),
                       align=2currentprojection.vector()-1.5Z,Relative(1)));
  },datumz.length);

pen fontsize=bp+fontsize(10);
draw(L,lift(f,contour(f,(0,0),(5,10),datumz)),
     palette(datumz,Gradient(fontsize+red,fontsize+black)));