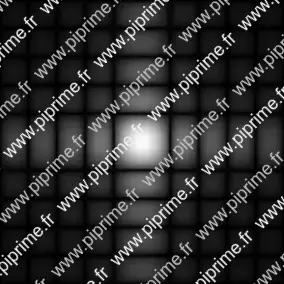
Figure Asymptote graph3 -- 012
This picture comes from the Asymptote gallery of topic graph3

Show graph3/fig0120.asy on Github.
Generated with Asymptote 3.00-0.
Categories : Examples 3D | Graph3.asy
Tags : #Graph (3D) | #Palette | #Surface | #Projection (3D) | #Shading (3D)
import graph3;
import palette;

real sinc(real x){return x != 0 ? sin(x)/x : 1;}

real f(pair z){
  real value = (sinc(pi*z.x)*sinc(pi*z.y))**2;
  return value^0.25;
}

currentprojection=orthographic(0,0,1);

size(10cm,0);

surface s=surface(f,(-5,-5),(5,5),100,Spline);
s.colors(palette(s.map(zpart),Gradient((int)2^11 ... new pen[]{black,white})));

draw(planeproject(unitsquare3)*s,nolight);