Figure Asymptote graph3 -- 017
This picture comes from the Asymptote gallery of topic graph3
Show graph3/fig0170.asy on Github.
Generated with Asymptote 3.00-0.
Categories : Examples 3D | Graph3.asy
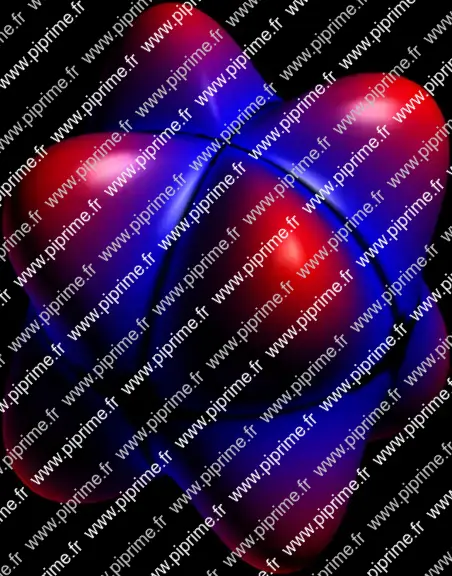
Tags : #Graph (3D) | #Palette | #Surface | #Shading (3D) | #Array | #Spherical harmonics
import graph3;
size(16cm, 0);

currentprojection=orthographic(4, 2, 4);

real r(real Theta, real Phi){return 1+0.5*(sin(2*Theta)*sin(2*Phi))^2;}
triple f(pair z) {return r(z.x, z.y)*expi(z.x, z.y);}

pen[][] pens(triple[][] z)
{
  pen[][] p=new pen[z.length][];
  for(int i=0; i < z.length; ++i) {
    triple[] zi=z[i];
    p[i]=sequence(new pen(int j) {
    real a=abs(zi[j]);

    return a < 1+1e-3 ? black : interp(blue, red, 2*(a-1));}, zi.length);
  }

  return p;
}

surface s=surface(f, (0, 0), (pi, 2pi), 100, Spline);
// Here we determine the colors of vertexes (vertex shading).
// Since the PRC output format does not support vertex shading of Bezier surfaces, PRC patches
// are shaded with the mean of the four vertex colors.
s.colors(pens(s.corners()));
draw(s);

if(!is3D())
  shipout(bbox(1mm, Fill(black)));