Figure Asymptote graph -- 030
This picture comes from the Asymptote gallery of topic graph
Other examples of interpolations can be found here.
Show graph/fig0310.asy on Github.
Generated with Asymptote 3.00-0.
Categories : Examples 2D | Graph.asy
Tags : #Graph | #Interpolate | #Function (drawing) | #Legend | #Typedef
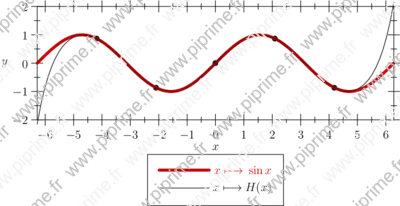
import graph;
unitsize(1cm);

typedef real hermite(real);

/**
 * Retourne la fonction polynôme de Hermite
 * passant par les points m(x_i,y_i) de nombre dérivée d_i en ce point.
 * Return Hermite polynomial interpolation function
 * passing by the points m (x_i, y_i) of derived number d_i in this point.
 **/
hermite hermite(pair [] m, real [] d)
{
  return new real(real x){
    int n=m.length;
    if (n != d.length) abort("Hermite: nombres de paramètres incorrectes.");
    real q,qk,s,y=0;
    for (int k=0; k<n ; ++k) {
      real q=1, qk=1, s=0;
      for (int j=0; j<n; ++j)
        {
          if (j!=k){
            q=q*(x-m[j].x)^2;
            qk=qk*(m[k].x-m[j].x)^2;
            s=s+1/(m[k].x-m[j].x);
          }
        }
      y=y+q/qk*(m[k].y+(x-m[k].x)*(d[k]-2*s*m[k].y));
    }
    return y;
  };
}

pair[] m;
real[] d;
int nbpt=5;
real xmin=-2pi,
xmax=2pi,
l=xmax-xmin,
step=l/(nbpt+1);
for (int i=1; i<=nbpt; ++i)
  {
    real x=xmin+i*step;
    m.push((x,sin(x)));
    draw(m[m.length-1],linewidth(2mm));
    d.push(cos(x));
  }

xlimits(-2pi,2pi);
ylimits(-2,2);
xaxis("$x$",BottomTop,Ticks);
yaxis("$y$",LeftRight,Ticks);

draw(graph(sin,xmin,xmax),1mm+.8red,"$x\longmapsto{}\sin x$");
draw(graph(hermite(m,d),xmin,xmax),"$x\longmapsto{}H(x)$");

attach(legend(),point(10S),30S);