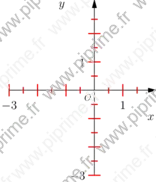
Figure Asymptote graph -- 017
This picture comes from the Asymptote gallery of topic graph

Show graph/fig0180.asy on Github.
Generated with Asymptote 3.00-0.
Categories : Examples 2D | Graph.asy
Tags : #Graph | #Axis | #Label
import graph;
unitsize(1cm);

xlimits( -3, 2);
ylimits( -3, 3);

xaxis("$x$", Ticks(ticklabel=OmitFormat(-2,-1,2),
                   modify=NoZero,
                   1bp+red,
                   end=false),
      arrow=Arrow);

yaxis("$y$", Ticks(ticklabel=OmitFormat(-2,-1,2,3),
                   modify=NoZero,
                   1bp+red,
                   end=false),
      arrow=Arrow);

labelx(scale(.75)*"$O$",0,SW);