Figure Asymptote geometry -- 034
This picture comes from the Asymptote gallery of topic geometry
Show geometry/fig0340.asy on Github.
Generated with Asymptote 3.00-0.
Categories : Examples 2D | Geometry.asy
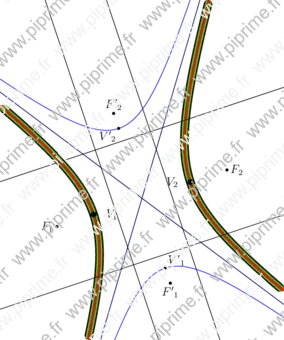
Tags : #Geometry | #Draw (2D) | #Clip | #Deferred drawing | #Hyperbola | #Line
import geometry;
size(10cm,0);

// currentcoordsys=cartesiansystem((2,1),i=(1,0.5),j=(-0.25,.75));
// show(currentcoordsys);

point F1=(1,0);
point F2=(4,1);
dot("$F_1$",F1,W);
dot("$F_2$",F2);

// Enlarge the bounding box of the current picture
draw(box((0,-2), (5,4)), invisible);

/*<asyxml><view file="modules/geometry.asy" type="hyperbola" signature="hyperbola(point,point,real,bool)"/></asyxml>*/
hyperbola h=hyperbola(F1, F2, 0.9);
draw(h, linewidth(3mm));
draw(h.A1, grey);
draw(h.A2, grey);
draw(h.D1);
draw(h.D2);

/*<asyxml><view file="modules/geometry.asy" type="hyperbola" signature="hyperbola(point,real,real,real)"/></asyxml>*/
draw(hyperbola(h.C, h.a, h.b, h.angle), 2mm+green);

/*<asyxml><view file="modules/geometry.asy" type="hyperbola" signature="hyperbola(bqe)"/></asyxml>*/
draw(hyperbola(equation(h)), 1mm+red);

/*<asyxml><view file="modules/geometry.asy" type="hyperbola" signature="conj(hyperbola)"/></asyxml>*/
hyperbola ch=conj(h);
draw(ch, blue);
draw(ch.A1, 0.5blue);
draw(ch.A2, 0.5blue);
draw(ch.D1);
draw(ch.D2);
dot("${V'}_1$", ch.V1, NE);
dot("${V'}_2$", ch.V2, SW);
dot("${F'}_1$", ch.F1, S);
dot("${F'}_2$", ch.F2, N);

dot("$V_1$", h.V1, 2E, linewidth(2mm));
dot("$V_2$", h.V2, 2W, linewidth(2mm));