Figure Asymptote graph -- 031
This picture comes from the Asymptote gallery of topic graph
Show graph/fig0320.asy on Github.
Generated with Asymptote 3.00-0.
Categories : Examples 2D | Graph.asy
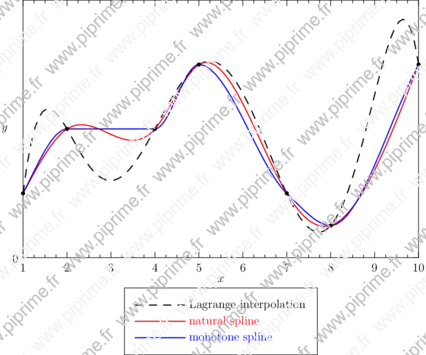
Tags : #Graph | #Interpolate | #Function (drawing) | #Legend
import graph;
import interpolate;

size(15cm,10cm,IgnoreAspect);

real[] xpt,ypt;
real [] xpt={1, 2, 4, 5, 7, 8, 10};
real [] ypt={1, 2, 2, 3, 1, 0.5, 3};


horner h=diffdiv(xpt,ypt);
fhorner L=fhorner(h);

scale(false,true);

pen p=linewidth(1);

draw(graph(L,min(xpt),max(xpt)),dashed+black+p,"Lagrange interpolation");
draw(graph(xpt,ypt,Hermite(natural)),red+p,"natural spline");
draw(graph(xpt,ypt,Hermite(monotonic)),blue+p,"monotone spline");
xaxis("$x$",BottomTop,LeftTicks(Step=1,step=0.25));
yaxis("$y$",LeftRight,RightTicks(Step=5));
dot(pairs(xpt,ypt),4bp+0.7black);

attach(legend(),point(10S),30S);