Figure Asymptote geometry -- 018
This picture comes from the Asymptote gallery of topic geometry
Show geometry/fig0180.asy on Github.
Generated with Asymptote 3.00-0.
Categories : Examples 2D | Geometry.asy
Tags : #Geometry | #Coords system | #Point | #Line | #Parallel | #Perpendicular | #Transform/scale/shift/rotate
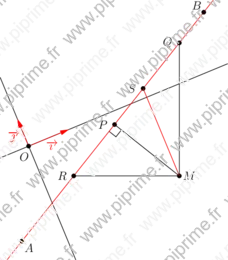
unitsize(1cm);
import geometry;
dotfactor*=1.5;

currentcoordsys=cartesiansystem((0,0),i=expi(pi/8)*(1.5,0),j=expi(pi/8)*(0,1));
show(currentcoordsys);

point A=(-1,-3), B=(5,2);
line l1=line(A,B);

draw(l1,red);
dot("$A$",A,SE);
dot("$B$",B,NW);

point M=(3,-3);
dot("$M$",M);

/*<asyxml><view file="modules/geometry.asy" type="transform" signature="projection(line)"/></asyxml>*/
point P=projection(l1)*M;
dot("$P$",P,2W);
draw(M--P);
markrightangle(l1.A,P,M);


/*<asyxml><view file="modules/geometry.asy" type="transform" signature="vprojection(line,bool)"/></asyxml>*/
point Q=vprojection(l1)*M;
dot("$Q$",Q,2W);
draw(M--Q);

/*<asyxml><view file="modules/geometry.asy" type="transform" signature="hprojection(line,bool)"/></asyxml>*/
point R=hprojection(l1)*M;
dot("$R$",R,2W);
draw(M--R);

/*<asyxml><view file="modules/geometry.asy" type="transform" signature="projection(line,line,bool)"/></asyxml>*/
point S=projection(l1,line((0,0),(0,1)))*M;
dot("$S$",S,2W);
draw(M--S,red);

draw(box((-1,-4),(7,5)),invisible);