Figure Asymptote grid3 -- 006
This picture comes from the Asymptote gallery of topic grid3
Show grid3/fig0600.asy on Github.
Generated with Asymptote 3.00-0.
Categories : Examples 3D | Grid3.asy
Tags : #Graph (3D) | #Grid (3D) | #Axis (3D)
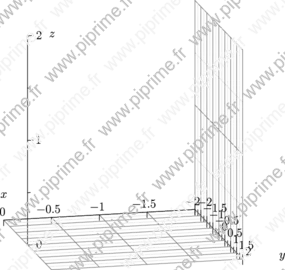
import grid3;

size(10cm,0,IgnoreAspect);
currentprojection=orthographic(0.25,1,0.25);
limits((-2,-2,0),(0,2,2));

xaxis3(Label("$x$",position=EndPoint,align=Z), YZEquals(-2,0),
       OutTicks(Label(align=0.5*(Z-Y)),Step=0.5, gridroutine=XYgrid));

yaxis3(Label("$y$",position=EndPoint,align=-X), XZEquals(-2,0),
       InOutTicks(Label(align=0.5*(Z-X)),N=8,n=2, gridroutine=YX_YZgrid));

zaxis3("$z$", OutTicks(ZYgrid));