Asymptote Gallery Tagged by “Grid (3D)” #155
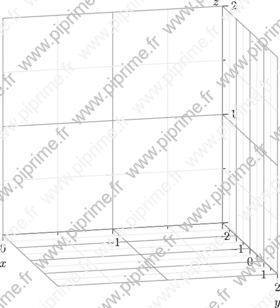
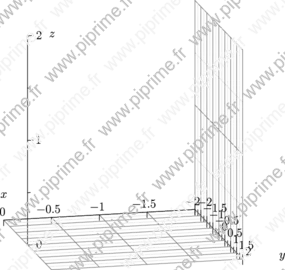
grid3-fig001
Show grid3/fig0100.asy on Github.
Generated with Asymptote 3.00-0.
Categories : Examples 3D | Grid3.asy
Tags : #Graph (3D) | #Grid (3D) | #Axis (3D)
import grid3;

size(10cm,0,IgnoreAspect);
currentprojection=orthographic(0.25, 1, 0.25);

limits((-2,-2,0), (0,2,2));

grid3(
      pic=currentpicture,            // picture (default=currentpicture)

      gridroutine=XYZgrid(           // gridtype3droutine or gridtype3droutine [] (alias gridtype3droutines)
                          //                         or gridtype3droutines []:
                          //                         The routine(s) to draw the grid(s);
                          //                         the values can be as follows:
                          //                            * XYgrid : draw grid from X in direction of Y
                          //                            * YXgrid : draw grid from Y in direction of X
                          //                                etc...
                          //                            * An array of previous values XYgrid, YXgrid, ...
                          //                            * XYXgrid : draw XYgrid and YXgrid grids
                          //                            * YXYgrid : draw XYgrid and YXgrid grids
                          //                            * ZXZgrid : draw ZXgrid and XZgrid grids
                          //                            * YX_YZgrid : draw YXgrid and YZgrid grids
                          //                            * XY_XZgrid : draw XYgrid and XZgrid grids
                          //                            * YX_YZgrid : draw YXgrid and YZgrid grids
                          //                            * An array of previous values XYXgrid, YZYgrid, ...
                          //                            * XYZgrid : draw XYXgrid, ZYZgrid and XZXgrid grids.
                          pos=Relative(0)), // position (default=Relative(0)) :
      //                          this is the position of the grid relatively to
      //                          the perpendicular axe of the grid.
      //                          If 'pos' is a the real, 'pos' is a coordinate relativly to this axe.
      //                          Alias 'top=Relative(1)', 'middle=Relative(0.5)'
      //                          and 'bottom=Relative(0)' can be used as value.

      // Following arguments are similar as the function 'Ticks'.
      N=0,                // int (default=0)
      n=0,                // int (default=0)
      Step=0,             // real (default=0)
      step=0,             // real (default=0)
      begin=true,         // bool (default=true)
      end=true,           // bool (default=true)
      pGrid=grey,         // pen (default=grey)
      pgrid=lightgrey,    // pen (default=lightgrey)
      above=false         // bool (default=false)
      );

xaxis3(Label("$x$",position=EndPoint,align=S), Bounds(Min,Min), OutTicks());
yaxis3(Label("$y$",position=EndPoint,align=S), Bounds(Min,Min), OutTicks());
zaxis3(Label("$z$",position=EndPoint,align=(0,0.5)+W), Bounds(Min,Min), OutTicks(beginlabel=false));
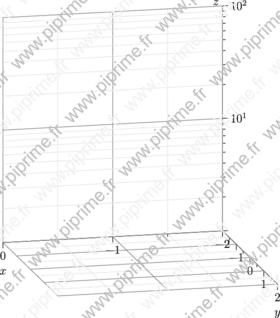
grid3-fig002
Show grid3/fig0200.asy on Github.
Generated with Asymptote 3.00-0.
Categories : Examples 3D | Grid3.asy
Tags : #Graph (3D) | #Grid (3D) | #Axis (3D)
import grid3;

size(10cm,0,IgnoreAspect);
currentprojection=orthographic(0.25, 1, 0.25);

limits((-2,-2,0), (0,2,2));

scale(Linear, Linear, Log(automax=false));
grid3(XZXgrid);
grid3(XYXgrid);
xaxis3(Label("$x$",position=EndPoint,align=S), Bounds(Min,Min), OutTicks());
yaxis3(Label("$y$",position=EndPoint,align=S), Bounds(Min,Min), OutTicks());
zaxis3(Label("$z$",position=EndPoint,align=(0,0.5)+W), Bounds(Min,Min), OutTicks(beginlabel=false));
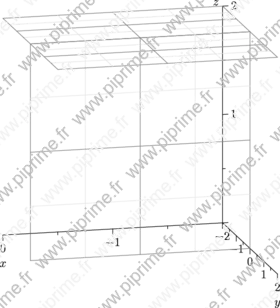
grid3-fig003
Show grid3/fig0300.asy on Github.
Generated with Asymptote 3.00-0.
Categories : Examples 3D | Grid3.asy
Tags : #Graph (3D) | #Grid (3D) | #Axis (3D)
import grid3;

size(10cm,0,IgnoreAspect);
currentprojection=orthographic(0.25, 1, 0.25);
limits((-2,-2,0), (0,2,2));

grid3(new grid3routines [] {XYXgrid(Relative(1)), XZXgrid(0)});

xaxis3(Label("$x$",position=EndPoint,align=S), Bounds(Min,Min), OutTicks());
yaxis3(Label("$y$",position=EndPoint,align=S), Bounds(Min,Min), OutTicks());
zaxis3(Label("$z$",position=EndPoint,align=(0,.5)+W), Bounds(Min,Min), OutTicks(beginlabel=false));
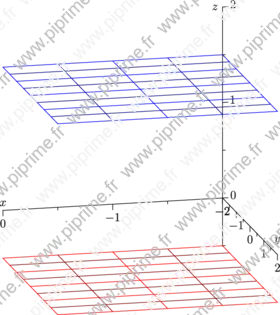
grid3-fig004
Show grid3/fig0400.asy on Github.
Generated with Asymptote 3.00-0.
Categories : Examples 3D | Grid3.asy
Tags : #Graph (3D) | #Grid (3D) | #Axis (3D)
import grid3;

size(10cm,0,IgnoreAspect);
currentprojection=orthographic(0.25, 1, 0.25);
limits((-2,-2,0),(0,2,2));

grid3(new grid3routines [] {XYXgrid(-0.5), XYXgrid(1.5)},
      pGrid=new pen[] {red, blue},
      pgrid=new pen[] {0.5red, 0.5blue});
xaxis3(Label("$x$",position=EndPoint,align=Z), YZEquals(-2,0), OutTicks());
yaxis3(Label("$y$",position=EndPoint,align=Z), XZEquals(-2,0), OutTicks());
zaxis3(Label("$z$",position=EndPoint,align=X), XYEquals(-2,-2), OutTicks(Label("",align=-X-Y)));
grid3-fig005

Show grid3/fig0500.asy on Github.
Generated with Asymptote 3.00-0.
Categories : Examples 3D | Grid3.asy
Tags : #Graph (3D) | #Grid (3D) | #Axis (3D)
import grid3;

size(10cm,0,IgnoreAspect);
currentprojection=orthographic(0.25,1,0.25);
limits((-2,-2,0),(0,2,2));

real Step=0.5, step=0.25;
xaxis3(Label("$x$",position=EndPoint,align=Z), YZEquals(-2,0),
       InOutTicks(Label(align=0.5*(Z-Y)),
                  Step=Step, step=step,
                  gridroutine=XYgrid,
                  pGrid=red, pgrid=0.5red));

yaxis3(Label("$y$",position=EndPoint,align=Z), XZEquals(-2,0),
       InOutTicks(Label(align=-0.5*(X-Z)), Step=Step, step=step,
                  gridroutine=YXgrid,
                  pGrid=red, pgrid=0.5red));

zaxis3("$z$", XYEquals(-1,0), OutTicks(Label(align=-0.5*(X+Y))));
grid3-fig006
Show grid3/fig0600.asy on Github.
Generated with Asymptote 3.00-0.
Categories : Examples 3D | Grid3.asy
Tags : #Graph (3D) | #Grid (3D) | #Axis (3D)
import grid3;

size(10cm,0,IgnoreAspect);
currentprojection=orthographic(0.25,1,0.25);
limits((-2,-2,0),(0,2,2));

xaxis3(Label("$x$",position=EndPoint,align=Z), YZEquals(-2,0),
       OutTicks(Label(align=0.5*(Z-Y)),Step=0.5, gridroutine=XYgrid));

yaxis3(Label("$y$",position=EndPoint,align=-X), XZEquals(-2,0),
       InOutTicks(Label(align=0.5*(Z-X)),N=8,n=2, gridroutine=YX_YZgrid));

zaxis3("$z$", OutTicks(ZYgrid));