Figure Asymptote grid3 -- 003
This picture comes from the Asymptote gallery of topic grid3
Show grid3/fig0300.asy on Github.
Generated with Asymptote 3.00-0.
Categories : Examples 3D | Grid3.asy
Tags : #Graph (3D) | #Grid (3D) | #Axis (3D)
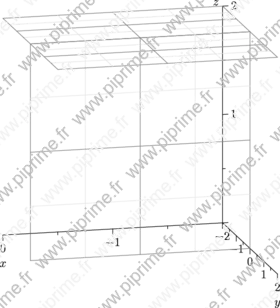
import grid3;

size(10cm,0,IgnoreAspect);
currentprojection=orthographic(0.25, 1, 0.25);
limits((-2,-2,0), (0,2,2));

grid3(new grid3routines [] {XYXgrid(Relative(1)), XZXgrid(0)});

xaxis3(Label("$x$",position=EndPoint,align=S), Bounds(Min,Min), OutTicks());
yaxis3(Label("$y$",position=EndPoint,align=S), Bounds(Min,Min), OutTicks());
zaxis3(Label("$z$",position=EndPoint,align=(0,.5)+W), Bounds(Min,Min), OutTicks(beginlabel=false));